

Abstract
Cellular aging is known to correlate with the accumulation of many harmful agents1, but can aging also result from deterioration of certain poorly-renewed beneficial components? Here we found that a group of plasma membrane-associated transporters, belonging to the multidrug resistance (MDR) protein families, may represent the latter type aging determinants. These proteins are deposited before the birth of a virgin yeast cell. During the subsequent division of this cell, the original protein population remains tightly associated with the mother cortex, while the newly synthesized transporter proteins are deposited mostly into the bud. Thus, the new and old pools of membrane-bound MDR proteins are spatially segregated during yeast asymmetric cell division with the older pool stably inherited by the aging mother. A model based on the observed dynamics of MDR protein inheritance and turnover predicted a decline in MDR activity as the mother cell advances in replicative age. As MDR proteins play crucial roles in cellular metabolism, detoxification and stress response, their collective decline may lead to fitness loss at an advance age. Supporting this hypothesis, mutants lacking certain MDR genes exhibited a reduced replicative lifespan (RLS), while introduction of only one extra copy of these MDR genes extended RLS.
Asymmetric cell division is a mechanism for an unequal distribution of aging factors to progeny cells, for the continuous renewal of a “youthful” and genetically stable population2. Budding yeast Saccharomyces cerevisiae cells have a finite replicative life span of 20-30 divisions, and each division gives rise to a “new-born” bud with a reset RLS from a mother cell of varying replicative age3. This asymmetry in age during yeast cell divisions has been mainly attributed to the accumulation and asymmetric inheritance of extrachromosomal rDNA circles (ERC) and oxidatively damaged proteins in mother cells, while the buds are free of these deleterious materials1,4,5. However, it has been unclear whether there are recessive aging factors, i.e., beneficial components, which could become limiting as mother cells advance in replicative age.
Yeast cells make their buds through polarized growth, during which membrane and organelle materials are trafficked toward the nascent bud along oriented actin tracks6. A comprehensive survey of the green fluorescent protein (GFP)-tagged yeast protein localization database7 led us to identify, serendipitously, a group of plasma membrane proteins (Supplementary Information, Table 1 online), all belonging to the MDR protein families8, which exhibit a localization pattern opposite to the direction of polarized trafficking: these proteins concentrate in the mother cell cortex instead of the bud in small-budded cells undergoing polarized growth (Fig. 1a-b). Using a spindle marker (GFP-Tub1), we established that the distribution of these proteins was strongly biased toward the mother before the onset of anaphase; however, during anaphase their fluorescence increased in the bud, diminishing the asymmetry (Fig.1c). Time-lapse imaging of cells expressing GFP-tagged Tpo1 (a polyamine tranporter9, as a representative of the group) from the native genomic locus (Fig. 1d) found that the rapid accumulation of Tpo1-GFP in the bud during anaphase did not occur at the expense of the mother-localized Tpo1-GFP but was more likely due to new protein deposition, because the mother fluorescence did not decrease. However, Tpo1 deposition during anaphase was strongly biased toward the bud: fluorescence increase in the mother cell was only 17% of that in the bud (Fig. 1e). The appearance of Tpo1 in the bud requires activation of the anaphase promoting complex, as the localization asymmetry was maintained in cells arrested in metaphase with nocodazole, or with the temperature sensitive cdc23-1 mutation10 (Fig. 1f-g). This result also indicates that the lack of Tpo1-GFP in the bud was not due to a delay in GFP maturation after synthesis. Neither was the observed localization patterns an artifact of the C-terminal tag, as the same observation was made with a GFP tag at the N-terminus of Tpo1 (Supplementary Information, Fig. S1a).
Figure 1. A group of MDR transporter proteins are asymmetrically localized in the mother cortex in a cell cycle-regulated manner.

a, Representative images of different GFP-tagged transporters showing asymmetric localization to the mother cortex in small budded cells and loss of this asymmetry in large budded cells. White arrows point to small buds with no Tpo1-GFP; arrowheads point to large-budded cells with Tpo1-GFP in the bud. b, Representative images of cells expressing Tpo1-GFP and GFP-Tub1 (as a marker for the spindle length and hence cell cycle stage) showing asymmetric Tpo1-GFP localization in cells in S-G2 and M phases and a loss of the asymmetry in anaphase cells. c, Quantification of cells displaying asymmetric transporter localization toward the mother (n > 200 cells) in populations with specific spindle morphologies, as represented by the color scheme in the cartoon drawings. d, Montage of fluorescence images of cells expressing Tpo1-GFP and GFP-Tub1 (Supplementary Information, Movie S1) showing Tpo1 localization changes during the cell cycle. White arrows follow small buds that started with asymmetric Tpo1 localization through different cell cycle stages. e, Average fluorescence intensities of Tpo1-GFP on the cortex of the mother (squares) and bud (circles) cells over time as recorded in Supplementary Information, Movie S1. Bars show the standard error of the mean (SEM) from 3 different cells quantified. f-g, Asymmetric Tpo1-GFP distribution in cells arrested in metaphase either by using nocodazole (f, average cortex fluorescence intensity Ibud/ Imother = 0.2, n=17) or by the temperature sensitive allele cdc23-1 at 37 °C (g, Ib/Im = 0.17, n = 22). Scale bars: 2 μm.
Microarray data available from the yeast genome database suggested that the majority of the MDR transporters show peak mRNA levels in metaphase11. We confirmed this expression timing for TPO1 by performing quantitative RT-PCR in comparison with SWI5 as a metaphase marker12 and the timing of budding and nuclear morphologies (Fig. 2a-c). Such restricted expression timing may underlie the lack of MDR proteins in the growing bud and appearance of MDR in the mature bud prior to cytokinesis. To test this, we integrated the inducible GAL1 promoter in front of TPO1-GFP in the genome such that the sole source of Tpo1-GFP was under the control of this promoter. Using cell populations synchronized in G1 with pheromone, we performed pulse expression (induction with galactose for 30 min, followed by rapid repression with glucose) at G1 or S phase of the cell cycle (Fig. 2d). Nocodazole was present in the release media, and hence the cells eventually arrested in the first metaphase. As predicted, pulse expression in G1 resulted in Tpo1-GFP exclusion from the bud after the release from the G1 arrest (Fig. 2e), whereas pulse expression immediately after the release from the G1 arrest resulted in localization of Tpo1-GFP in the bud, likely as a result of polarized secretion (Fig. 2f). These results support the hypothesis that the timing of expression for Tpo1 is crucial for its observed pattern of localization.
Figure 2. The timing of Tpo1 expression during the cell cycle is critical to the observed localization patterns.
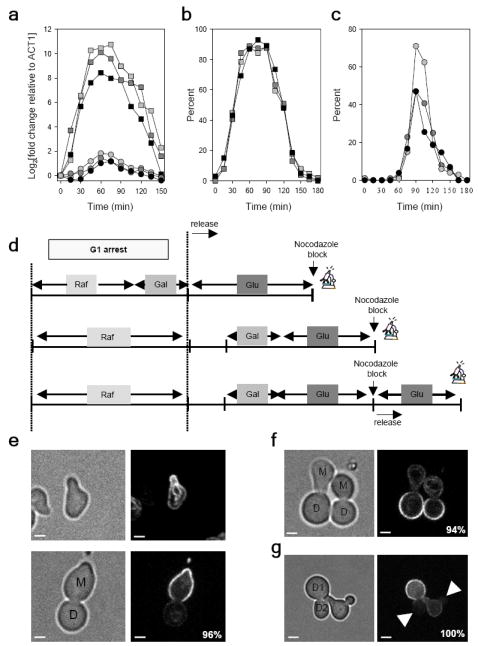
a, Total RNA at different time points was purified from cells released from G1-arrest. Using cDNA generated from total RNA, quantitative PCR (qPCR) confirmed that TPO1 (circles) expression peaks at M-phase upon comparison to SWI5 (squares) expression profile. Three biological replicates are shown. b-c, Cell cycle progression was tracked by the budding index (b) and nuclear division kinetics (c) for the three biological replicates used for RNA purification in quantitative RT-PCR analyses. d, Schematic diagrams explaining the experiment of pulse-expressing Tpo1-GFP with the GAL1 promoter at different cell cycle stages in cell cultures synchronized in G1 with the α mating factor. Top row: pulse expression in G1; middle row: pulse expression in S/M; and bottom row: pulse expression in S/M followed by release from the nocodazole block. e, Pulse expression of Tpo1-GFP in G1 (top panels) resulted in asymmetric localization toward the mother after bud formation (bottom panels). M: mother; D: daughter. The mother can be distinguished from the bud (daughter) due to the shmoo shape caused by pheromone arrest. f-g, Pulse expression of Tpo1-GFP in S/M resulted in asymmetric localization toward the bud (f), and upon further release of the budded cells from the nocodazole block, the bud (D2) of the first daughter cell (D1) was completely devoid of Tpo1-GFP (g). Percent numbers refer to % of cells with the characteristic Tpo1 localization pattern noted in the text for each panel. Scale bars: 2 μm.
Strikingly, when cells with bud-localized Tpo1, due to pulse expression in S phase, were followed into the subsequent cell cycle after release from the nocodazole arrest, the newly formed buds (D2 in Fig. 2g) were completely devoid of Tpo1, suggesting that the Tpo1 protein expressed in the previous cycle was tightly sequestered by the mother cortex. We first thought that this might be due to the septin diffusion barrier at the bud neck13. However, after shifting a septin mutant (cdc12-6)14 to the non-permissive temperature for 1 hr, Tpo1 in the mutant cells was still retained in the mother and no protein was observed in the abnormally elongated buds characteristic of septin loss (Fig. 3a). To test if Tpo1 was simply unable to diffuse in the membrane, fluorescence recovery after photo bleaching (FRAP) was performed where a section of the mother cortex was photo-bleached. No recovery was observed for the duration of the imaging (10 min), suggesting that Tpo1 was tightly bound to the mother cell cortex (Fig. 3b, Supplementary Information, Movie S2). Similarly, photo bleaching of the entire mother cell in a large-budded cell did not show fluorescence recovery in the mother while the bud maintained its fluorescence, suggesting a lack of exchange of Tpo1 between the mother and the bud (Fig. 3c, Supplementary Information, Movie S3). FRAP experiments also confirmed the same stable inheritance for two other MDR proteins examined, Ctr1 and Yor1 (Supplementary Information, Fig. S1b)
Figure 3. Stable inheritance and protein abundance and activity changes of Tpo1 during RLS.

a, Septin mutant cdc12-6 grown at 37 °C for 1 hr to disrupt the septin ring maintained asymmetric localization of Tpo1p to the mother cortex. Note cells developed the elongated buds (arrowheads) typical of septin deficient cells. Scale bars: 2 μm. b-c, FRAP analysis of Tpo1-GFP demonstrating a lack of diffusion in the membrane (b) or exchange between the mother and the bud (c). In b, a small section of the mother cortex (red circle) of two cells with small buds (arrows) was photobleached. Montage of the movie (top) and quantification of fluorescence recovery as a percentage of the pre-bleached level (bottom) are shown. In c, the entire cortex of the mother cell (red circle) was photobleached and montage of the movie (top) and quantification (bottom) as in (b) are shown. The bud fluorescence was also plotted showing no loss after bleaching of the mother. Error bars represent SEM (n=9 for b; 5 for c). Scale bars: 2 μm. d, Schematic diagram showing asymmetric inheritance of different pools of MDR protein during each cell division. Orange represents the original pool of MDR proteins in the mother. At anaphase, a new pool of MDR proteins (green) is synthesized but is mostly deposited into the bud, the new cell to be. e, Examination of Tpo1-GFP stability by FACS. Shown are distributions of the population (cell %) along the fluorescence scale at different time points. Due to reduction in GFP+ population, the “cell %” scale was consecutively reduced (arrows) for the boxed areas to show peaks. At the start of the chase the entire population was GFP+, but as a result of asymmetric division and retention of Tpo1-GFP in the mother cells, all subsequent newborn cells are GFP- (low fluorescence). f, Simulation of Tpo1 level change (blue) and activity decay (red) over a cell’s RLS. See Supplementary Information for model details. g, Spermidine uptake, at pH 7.2, for equal-dry weight young (black circles) and old cell (gray squares) populations sorted by elutriation from the same culture (see Supplementary Information, Fig. S2d).
The above results suggest that while the mother cell keeps its own pool of MDR proteins, the daughter cell inherits the majority of the newly synthesized MDR proteins during mitosis, and the new and aged proteins are stably segregated along the bud-mother axis (Fig. 3d). This implies that a cell receives most of the MDR proteins at its birth, and as the cell undergoes subsequent divisions, its pool of MDR proteins is only slightly replenished during each anaphase, because the majority of the new protein is deposited into the bud. Meanwhile the aging MDR protein population is retained in the mother and restricted from entering the bud. Depending on the rate of decay of these proteins, their level and/or activity could eventually decline as the mother cell advances in replicative age. As such, MDR transporters may fit the criteria as recessive, beneficial determinants of a cell’s RLS.
To quantitatively assess the above idea, we modeled the dynamics of the MDR protein population over a yeast cell’s RLS. This model assumes deposition of newly synthesized MDR protein at a cell’s birth. This protein pool follows a decay rate of α and is poorly replenished with newly synthesized protein (amount as β as a fraction of the first pool) during each subsequent anaphase (Supplementary Information). To estimate α, Tpo1 expression was induced from the GAL1 promoter for 3 hrs and then shut off upon addition of glucose, and the stability of Tpo1-GFP was monitored using fluorescent-activated cell sorting (FACS). As shown in Figure 3e (and Supplementary Information, Fig. S2a), as the culture underwent exponential growth, the fraction of GFP+ cells decreased rapidly; however, the level of Tpo1-GFP fluorescence in GFP+ cells remained observable for the duration of the experiments (24 hours, ~ 14 divisions), consistent with stable inheritance of the pulse-expressed fluorescent protein in the original population. An exponential fitting of mean fluorescence within the fluorescent cell population led to an estimate of decay rate α to be 0.16 h-1 (Supplementary Information, Fig. S2b-c). β was estimated to be on average 0.27 by quantification of mother cell fluorescence increase as a fraction of fluorescence deposition in the daughter from the time-lapse movie (Supplementary Information, Movie S1).
Model simulation showed a non-monotonic change of Tpo1 level as a function of the cell’s replicative age: the level increased initially and then gradually declined for the duration of the RLS (Fig. 3f, blue line). A factor contributing to the time-dependent change in Tpo1 level during RLS is a slow but gradual increase in cell cycle length as observed in many studies15,16, which results in slowed replenishment while the decay rate remains constant. In addition to a diminishing protein level, transporter molecules present in older cells are expected to be, on average, older than those in younger cells, which may result in reduced functionality. Since Tpo1 is a major polyamine transporter in the cell, to examine if polyamine transport activity was indeed altered in older compared to younger cells, we used an elutriation protocol17 to isolate populations enriched for young or old cells (Supplementary Information, Fig. S2d). The polyamine transport activity was assayed by using radioactive spermidine18. As shown in Figure 3g, the older cell population exhibited a considerable reduction in polyamine transport activity. Activity decay can be modeled with an additional rate, estimated from the result in Figure 3g (see Supplementary Information). Accounting for the functional decay predicts an even sharper decline of the overall polyamine transporter activity over the RLS (Fig. 3f, red line), which approaches a minima around 20-30 generations.
Substrates of MDR transporters have been well implicated in aging. For example, polyamines are known to play an important role in the life span of a variety of cell types, including yeast19,20. Ctr1 is a major transporter of the copper ion, an essential cofactor for superoxide dismutase, an enzyme critical for protecting cells against oxidative damage and for normal life span21. Yor1 confers resistance to many organic acids22, including acetic acid, a product of fermentative metabolism and a key factor in chronological aging23. To determine if MDR proteins play any role in RLS, we used a micromanipulation assay24 to measure the RLS of mutant cells bearing gene deletion for Tpo1, Yor1 or Ctr1. None of the mutations appeared to cause any drastic growth defect in actively dividing populations, expected to be composed mostly of young cells (Supplementary Information, Fig. S3a), although these mutations could have subtle effects on cellular physiology. a type ctr1Δ cells exhibited a drastically reduced RLS (by 66.4%, P<0.001) compared to wild-type cells, while tpo1Δ reduced RLS by 31.5% (P<0.001) and yor1Δ by 11.3% (P<0.06) (Fig. 4a). Qualitatively similar observations were made for α type ctr1Δ (95% reduction, p<0.001) and yor1Δ (15.8% reduction, p<0.002). The lifespan of α tpo1Δ cells was also short compared to wild-type RLS (8.2% reduction), though the difference was not statistically significant (p<0.2) (Supplementary Information, Fig. S3b-d, and Supplementary Information, Table 2 online for detailed RLS data).
Figure 4. Levels of different MDR transporters affect the replicative life span.

a, A representative set of viability curves from a single experiment showing deletions of different MDR transporters, tpo1Δ, ctr1Δ, or yor1Δ (in a-mating type strains), reduced RLS relative to the wild-type a strain (BY4741) (for α strain analysis see Supplementary Information, Fig. S3b-d and Supplementary Information, Table 2 online). b, An extra copy of TPO1 increases TPO1 expression, as shown by quantitative PCR (left bar graph) and Tpo1-GFP cortical fluorescence intensity (right bar graph). Representative images are shown for Tpo1-GFP in cells with 1x TPO1-GFP (specifically marked with the spindle pole body marker Spc42-mCherry) or 2x TPO1-GFP observed in the same field. Error bars represent SEM (n>100). Scale bar: 2 μm. c-e, Representative viability curves showing that introduction of an extra copy of TPO1, CTR1 or YOR1 extended RLS relative to the wild type (BY4741) tested along side of each mutant strain in the same experiment. f, Bar graphs representing the effect of deletion or 1 extra copy of TPO1, CTR1 or YOR1 on RLS, as represented by the percentage difference of mean RLS relative to that of their corresponding wild-type control strain. See Supplementary Information, Table 2 online for all details of the result.
An alternative way to test if MDR transporters are limiting factors in RLS determination is to examine if an increased MDR protein level leads to extended RLS. Since gross and unregulated over-expression of MDR proteins may have deleterious or pleiotropic effects, we opted to perform this analysis by introducing one extra copy of the TPO1, YOR1 or CTR1 gene, controlled under the respective native promoter, to the respective genomic locus. A moderate increase in mRNA and protein expression levels in the 2x TPO1 strain compared to those in the wild type was confirmed by quantitative RT-PCR and fluorescence measurement, respectively (Fig. 4b). Remarkably, introduction of an extra copy of TPO1, YOR1 or CTR1 to the respective native locus resulted in significant increase in RLS to varying extents compared to that of the wild type (Fig. 4c-f, Supplementary Information, Fig. S3 and Supplementary Information, Table 2 online).
Taken together, the cellular experiments described above demonstrated that the MDR proteins exhibit a unique asymmetric inheritance pattern as a result of their timed expression in the cell cycle, localized deposition, and stable association with the cortex, which poises these proteins to be markers of cellular replicative aging in asymmetrically dividing yeast cells. Analysis using a polyamine transporter (Tpo1) as an example suggested a slow protein turnover and a decline in the transporter activity during RLS. RLS measurements further provide functional evidence that these transporter proteins are aging determinants: even individual deletion of the MDR genes could lead to shortened RLS, whereas a moderate increase in the expression of one of the three tested transporters, due to an extra copy of the gene, led to extended RLS. Thus, in addition to deleterious, dominant aging factors, MDR proteins represent a class of recessive, beneficial factors that limit RLS. Interestingly, the dominant and recessive factors may represent the two sides of the same coin: while aging cells accumulate such materials as ERC and oxidatively damaged proteins that may interfere with normal cellular processes1, diminution of the protective functions provided by MDR proteins may exacerbate the progress toward cell death induced by toxic agents. In turn, environmental or physiological factors, such as calorie restriction or stress, could impact the aging process25,26 by lessening the production of the toxic substrates of MDR transporters, such as organic acids , or the need for importing protective substrates such as polyamines27.
Many interesting questions remain for future study, including what are the relevant substrates of the MDR transporters that affect aging, and how the aging mechanism due to changes in the level of MDR proteins interact with other well studied pathways of cellular replicative aging. Finally, several mammalian ABC transporters are well known stem-cell markers and are down-regulated at the time of differentiation28. It has been hypothesized that these transporter proteins are particularly important for maintaining the long-term proliferative potential of stem cells. It will be interesting to investigate if MDR transporter proteins are also segregated asymmetrically during stem cell divisions and play any role in aging and senescence in multi-cellular organisms.
METHODS
Methods and any associated references are available in the online version of the paper at http://www.nature.com/naturecellbiology/
Supplementary Material
Acknowledgments
We thank C. Zhou for assistance on RLS experiments; C. Seidel and B. Fleharty for help on RNA purification and quantitative RT-PCR; R. Zhu, K. Wagner and J. Haug on cell sorting experiments; B. Slaughter, N. Pavelka and S. Xia on technical advice and critical comments. This research is supported by the National Institutes of Health grant R01GM057063 to R.L. The content is solely the responsibility of the authors and does not necessarily represent the official views of the National Institute of General Medical Sciences or the National Institutes of Health.
Footnotes
AUTHOR CONTRIBUTIONS A.E. performed all of the experiments and prepared the manuscript figures and draft. G.R. contributed to MDR protein quantification and RLS measurements. B.R. constructed the mathematical model for MDR dynamics during RLS. P.P. and V.C. provided technical assistance to various experiments. R.L. conceived and supervised the project and revised the manuscript.
Note: Supplementary Information is available on the Nature Cell Biology website.
COMPETING FINANCIAL INTERESTS The authors declare no competing financial interests.
References
- 1.Henderson KA, Gottschling DE. A mother’s sacrifice: what is she keeping for herself? Current Opinion in Cell Biology. 2008;20:723–728. doi: 10.1016/j.ceb.2008.09.004. [DOI] [PMC free article] [PubMed] [Google Scholar]
- 2.Steinkraus KA, Kaeberlein M, Kennedy B. Replicative Aging in Yeast: The Means to the End. Annual Review of Cell and Developmental Biology. 2008;24 doi: 10.1146/annurev.cellbio.23.090506.123509. [DOI] [PMC free article] [PubMed] [Google Scholar]
- 3.Mortimer RK, Johnston JR. Life Span of Individual Yeast cells. Nature. 1959;183:1751–1752. doi: 10.1038/1831751a0. [DOI] [PubMed] [Google Scholar]
- 4.Erjavec N, Larsson L, Grantham J, Nystrom T. Accelerated aging and failure to segregate damaged proteins in Sir2 mutants can be suppressed by overproducing the protein aggregation-remodeling factor Hsp104p. Genes & Development. 2007;21:2410–2421. doi: 10.1101/gad.439307. [DOI] [PMC free article] [PubMed] [Google Scholar]
- 5.Sinclair DA, Guarente L. Extrachromosomal rDNA Circles A Cause of Aging in Yeast. 1997;91:1033–1042. doi: 10.1016/s0092-8674(00)80493-6. [DOI] [PubMed] [Google Scholar]
- 6.Park H-O, Bi E. Central Roles of Small GTPases in the Development of Cell Polarity in Yeast and Beyond. Microbiol Mol Biol Rev. 2007;71:48–96. doi: 10.1128/MMBR.00028-06. [DOI] [PMC free article] [PubMed] [Google Scholar]
- 7.Huh WK, et al. Global analysis of protein localization in budding yeast. Nature. 2003;425:686–691. doi: 10.1038/nature02026. [DOI] [PubMed] [Google Scholar]
- 8.Ernst R, Klemm R, Schmitt L, Kuchler K. Yeast ATP-Binding Cassette Transporters: Cellular Cleaning Pumps. Methods in Enzymology. 2005;400:460–484. doi: 10.1016/S0076-6879(05)00026-1. [DOI] [PubMed] [Google Scholar]
- 9.Uemura T, Tachihara K, Tomitori H, Kashiwagi K, Igarashi K. Characteristics of the Polyamine Transporter TPO1 and Regulation of Its Activity and Cellular Localization by Phosphorylation. J Biol Chem. 2005;280:9646–9652. doi: 10.1074/jbc.M410274200. [DOI] [PubMed] [Google Scholar]
- 10.Burke DJ, Church D. Protein synthesis requirements for nuclear division, cytokinesis, and cell separation in Saccharomyces cerevisiae. Mol Cell Biol. 1991;11:3691–3698. doi: 10.1128/mcb.11.7.3691. [DOI] [PMC free article] [PubMed] [Google Scholar]
- 11.Spellman PT, et al. Comprehensive Identification of Cell Cycle-regulated Genes of the Yeast Saccharomyces cerevisiae by Microarray Hybridization. Mol Biol Cell. 1998;9:3273–3297. doi: 10.1091/mbc.9.12.3273. [DOI] [PMC free article] [PubMed] [Google Scholar]
- 12.Althoefer H, Schleiffer A, Wassmann K, Nordheim A, Ammerer G. Mcm1 is required to coordinate G2-specific transcription in Saccharomyces cerevisiae. Mol Cell Biol. 1995;15:5917–5928. doi: 10.1128/mcb.15.11.5917. [DOI] [PMC free article] [PubMed] [Google Scholar]
- 13.Faty M, Fink M, Barral Y. Septins: a ring to part mother and daughter. Current Genetics. 2002;41:123–131. doi: 10.1007/s00294-002-0304-0. [DOI] [PubMed] [Google Scholar]
- 14.Barral Y, Mermall V, Mooseker MS, Snyder M. Compartmentalization of the Cell Cortex by Septins Is Required for Maintenance of Cell Polarity in Yeast. 2000;5:841–851. doi: 10.1016/s1097-2765(00)80324-x. [DOI] [PubMed] [Google Scholar]
- 15.Egilmez NK, Jazwinski SM. Evidence for the involvement of a cytoplasmic factor in the aging of the yeast Saccharomyces cerevisiae. J Bacteriol. 1989;171:37–42. doi: 10.1128/jb.171.1.37-42.1989. [DOI] [PMC free article] [PubMed] [Google Scholar]
- 16.Egilmez NK, C J, Jazwinski SM. Preparation and partial characterization of old yeast cells. Journal of Bacteriology. 1990;45:b9–17. doi: 10.1093/geronj/45.1.b9. [DOI] [PubMed] [Google Scholar]
- 17.Lesur I, Campbell JL. The Transcriptome of Prematurely Aging Yeast Cells Is Similar to That of Telomerase-deficient Cells. Mol Biol Cell. 2004;15:1297–1312. doi: 10.1091/mbc.E03-10-0742. [DOI] [PMC free article] [PubMed] [Google Scholar]
- 18.Tomitori H, et al. Multiple polyamine transport systems on the vacuolar membrane in yeast. Biochem J. 2001;353:681–688. doi: 10.1042/0264-6021:3530681. [DOI] [PMC free article] [PubMed] [Google Scholar]
- 19.Eisenberg T, et al. Induction of autophagy by spermidine promotes longevity. Nat Cell Biol. 2009;11:1305–1314. doi: 10.1038/ncb1975. [DOI] [PubMed] [Google Scholar]
- 20.Morselli E, G L, Kepp O, Criollo A, Maiuri MC, Tavernarakis N, Madeo F, Kroemer G. Autophagy mediates pharmacological lifespan extension by spermidine and resveratrol. Aging. 2009;1:961–970. doi: 10.18632/aging.100110. [DOI] [PMC free article] [PubMed] [Google Scholar]
- 21.Kirchman PA, Botta G. Copper supplementation increases yeast life span under conditions requiring respiratory metabolism. Mechanisms of Ageing and Development. 2007;128:187–195. doi: 10.1016/j.mad.2006.10.003. [DOI] [PMC free article] [PubMed] [Google Scholar]
- 22.Cui Z, Hirata D, Tsuchiya E, Osada H, Miyakawa T. The Multidrug Resistance-associated Protein (MRP) Subfamily (Yrs1/Yor1) of Saccharomyces cerevisiae Is Important for the Tolerance to a Broad Range of Organic Anions. Journal of Biological Chemistry. 1996;271:14712–14716. doi: 10.1074/jbc.271.25.14712. [DOI] [PubMed] [Google Scholar]
- 23.Burtner C, Murakami C, Kennedy B, Kaeberlein M. A molecular mechanism of chronological aging in yeast. cell Cycle. 2009;8:1256–1270. doi: 10.4161/cc.8.8.8287. [DOI] [PMC free article] [PubMed] [Google Scholar]
- 24.Steffen KK, K B, Kaeberlein M. Measuring Replicative Life Span in the Budding Yeast. JoVE (Journal of Visulaized Experiments) 2009;28 doi: 10.3791/1209. [DOI] [PMC free article] [PubMed] [Google Scholar]
- 25.Chen D, Guarente L. SIR2: a potential target for calorie restriction mimetics. Trends in Molecular Medicine. 2007;13:64–71. doi: 10.1016/j.molmed.2006.12.004. [DOI] [PubMed] [Google Scholar]
- 26.Merry BJ. Oxidative stress and mitochondrial function with aging-the effects of calorie restriction. Aging Cell. 2004;3:7–12. doi: 10.1046/j.1474-9728.2003.00074.x. [DOI] [PubMed] [Google Scholar]
- 27.Igarashi K, Kashiwagi K. Polyamines: Mysterious Modulators of Cellular Functions. Biochemical and Biophysical Research Communications. 2000;271:559–564. doi: 10.1006/bbrc.2000.2601. [DOI] [PubMed] [Google Scholar]
- 28.Bunting KD. ABC Transporters as Phenotypic Markers and Functional Regulators of Stem Cells. Stem Cells. 2002;20:11–20. doi: 10.1002/stem.200011. [DOI] [PubMed] [Google Scholar]
- 29.Sherman F, Fink G, Lawerence C Laboratory., a.C.S.H. Methods in Yeast genetics. Cold Spring Harbor, NY: Cold Spring Harbor Laobratory Press; 1974. [Google Scholar]
- 30.Livak KJ, Schmittgen TD. Analysis of Relative Gene Expression Data Using Real-Time Quantitative PCR and the 2-[Delta][Delta]CT Method. Methods. 2001;25:402–408. doi: 10.1006/meth.2001.1262. [DOI] [PubMed] [Google Scholar]
Associated Data
This section collects any data citations, data availability statements, or supplementary materials included in this article.