

Abstract
Background & Aims
Intestinal metaplasia (IM) and spasmolytic polypeptide-expressing metaplasia (SPEM) are precursors to gastric carcinogenesis. We sought to identify molecular biomarkers of gastric metaplasias and gastric cancer by gene expression profiling of metaplastic lesions from patients.
Methods
cDNA microarray analysis was performed on IM and SPEM cells isolated from patient samples using laser capture microdissection. Up-regulated transcripts in metaplstic lesions were confirmed by immunostaining analysis in IM, SPEM, and gastric cancer tissues. Proteins that were highly expressed specifically in gastric cancer tissues were analyzed for their association with survival in a test set (n=450) and a validation set (n=502) of samples from gastric cancer patients.
Results
Compared to normal chief cells, 858 genes were differentially expressed in IM or SPEM samples. Immunostaining was detected for 12 proteins, including 3 new markers of IM (ACE2, LGALS4, AKR1B10) and 3 of SPEM (OLFM4, LYZ, DPCR1). Of 13 proteins expressed in IM or SPEM, 8 were expressed by 17%–50% of human gastric cancer tissues (MUC13, OLFM4, CDH17, KRT20, MUC5AC, LGALS4, AKR1B10, REG4). Expression of CDH17 or MUC13 correlated with patient survival in the test and a validation sets. Multivariate analysis showed that CDH17 was an independent prognostic factor in patients with stage I or node-negative disease.
Conclusion
We identified several novel biomarkers for IM, SPEM, and gastric cancer using gene expression profiling of human metaplastic lesions. Expression of CDH17 and MUC13 was upregulated in gastric cancer tissues. CDH17 is a promising prognostic marker for early-stage gastric cancer.
Keywords: metaplasia, cadherin-17, MUC13, gastric cancer, olfactomedin 4, SPEM, intestinal metaplasia
Introduction
Although the incidence of gastric cancer has decreased in the western countries, it still ranks as the fourth most common cancer worldwide and the second most common cause of cancer-related death.1 While considerable improvements have occurred in early detection, surgical technique, and adjuvant chemotherapy,2,3 little has been achieved in the development of novel prognostic markers. For prediction of prognosis, only the TNM staging system and surgical curability (R-category) are commonly used in the clinical setting.4 Therefore, novel molecular prognostic markers for gastric cancer, especially those with insights within the same TNM stage, are needed not only for the accurate prediction of recurrence, but also for the personalized treatment of each patient. This need is especially apparent in the treatment of early-stage gastric cancer patients, where adjuvant chemotherapy could be applied more selectively if effective prognostic markers were available.
Similar to other malignancies, gene expression profiling using cDNA microarray has been previously performed on tumor samples to identify new diagnostic and prognostic markers for gastric cancer.5-9 Unfortunately, these studies have yielded few useful biomarkers for gastric cancer, likely due to the heterogeneity of the original tumor samples and contamination by the premalignant metaplastic processes in the surrounding mucosa that usually served as the “normal” control. To avoid these problems, we have focused on gene expression profiling of gastric metaplastic lesions from the gastric cancer patients to identify novel biomarkers affecting the early stage of gastric carcinogenesis.
Intestinal metaplasia (IM) is a well-established precursor in gastric carcinogenesis, especially of intestinal-type tumors.10 Another metaplastic lesion, designated spasmolytic polypeptide expressing metaplasia (SPEM), shows morphological similarity with deep antral gland cells and expresses trefoil factor 2 (TFF2, spasmolytic polypeptide).11,12 In human studies, SPEM was found in 90% of fundic mucosal samples adjacent to gastric cancer.13,14 Recent investigations in mice support the development of SPEM from transdifferentiation of normal chief cells into mucous metaplasia following loss of gastric parietal cells.15,16 Also, evidence from rodents suggests that IM and dysplasia can develop from SPEM.17,18
In this study, we performed cDNA microarray analysis on mRNA isolated from microdissected IM, SPEM, and normal chief cell lineages from human stomach. By testing and validating expression of putative up-regulated proteins in two large cohorts of gastric cancer tissues, we identified an independent prognostic biomarker, CDH17, in stage I or node-negative gastric cancer.
Materials and Methods
Oligonucleotide microarray from microdissected RNA
Total RNAs from both IM and SPEM lineages adjacent to intestinal-type gastric cancer in fundus were collected from 6 patients who underwent gastrectomy. In addition, since transdifferentiation of chief cells into SPEM appears to be the first step in metaplastic response to oxyntic atrophy, RNAs from normal chief cells were collected from 6 patients who underwent gastrectomy with no evidence of atrophic gastritis, IM, SPEM or gastric cancer in the fundic mucosa. All samples were obtained from Department of Surgery at Seoul National University Hospital (SNUH) from July 2007 to July 2008. This work was approved by the institutional review board (IRB) at SNUH and written consents were obtained from each patient. Detailed information on each patient is shown in Supplementary Table 1.
Before performing the laser capture microdissection (LCM), double immunohistochemical staining with anti-human MUC2 (1:200, sc-15334, Santa Cruz, CA) and anti-human TFF2/SP (1:100, a gift from Dr. Nicholas Wright, Cancer UK, London, UK) as well as hematoxylin-eosin staining were performed for every tissue sample to confirm the presence and location of IM and SPEM (Supplementary Fig 1). LCM procedures were performed using a Veritas Microdissection System (Molecular Devices, CA). Total RNA was extracted and isolated using a Picopure RNA Isolation Kit (Molecular Devices).
Isolated RNAs were amplified using a NuGEN FFPE amplification kit and labeled using a NuGEN Ovation™ cDNA Biotin Module V2 kit (San Carlos, CA). RNA quality was determined using the Agilent 2100 bioanalyzer. Five μg of each sample was hybridized to Affymetrix U133 Plus 2.0 GeneChip® Expression arrays (∼55,000 probes) according to manufacturer's instructions. The raw expression data were converted to expression values using the Affy function in R (http://www.bioconductor.org).
Gene selection
Once expression values were obtained, we filtered those probes/features that had at least 25% samples with intensities above 100 fluorescent units and interquartile range of at least 0.5. The log2-based expression levels were examined using analysis of variance (ANOVA) and ebayes-moderated t-tests implemented in the limma package; the pair-wise contrasts tested chief cell versus IM or SPEM. After type I error was mitigated by first testing for the overall p-value of any difference in means, only those that were found significant in the overall test underwent pair-wise tests. The significant p-values from the two pair-wise tests (chief cell versus IM and chief cell versus SPEM) were ranked and a candidate probe list was compiled, using False Discovery Rate adjusted p-value cut-offs obtained by the linear step-up method described by Benjamini and Hochberg.19 We used the Annotate package to convert the probe set definitions to searchable forms that were linked to web-based databases. We examined pathways associated with these candidate probes using the SPIA package. The candidate probes associated with known genes were filtered manually for further analyses of their protein expression. Gene products were prioritized for further analysis based on their classification as (1) secretory or extracellular protein, (2) protein with limited expression in stomach and other tissues, or (3) a novel marker in the oncologic field. Final selection was based on the availability of antibodies for immunohistochemical staining in paraffin-embedded tissues.
Tissue microarray (TMA) analysis
To evaluate the protein expression in the normal fundus and metaplastic and cancerous lesions, two small-scale gastric cancer TMAs were used: (1) a collection of 42 gastric adenocarcinomas resected at Vanderbilt University Hospital (Vanderbilt-GC; median age: 67 yrs, M:F=24:18,),20 and (2) a collection of 36 gastric adenocarcinomas resected at SNUH (SNUH-TA78, SuperBioChips, Seoul, Korea; median age: 58 yrs, M:F=27:9,). Another two large-scale sets of tissue microarrays: (1) a collection of 450 gastric adenocarcinomas resected at SNUH in 2004 (SNUH-2004-GC, SuperBioChips) as a test set and (2) a collection of 502 gastric adenocarcinomas resected at SNUH in 1996 (SNUH-1996-GC, SuperBioChips) as a validation set, were used to evaluate the expression profiles of proteins, which were expressed in more than 40% of gastric cancers in initial tissue arrays. In both sets, annotated data for each case were available for age, sex, tumor size and location, Lauren classification, TNM stage (according to 6th UICC/AJCC TNM classification), lymphatic invasion, venous invasion, surgical curability, and disease-specific survival period (Supplementary Table 3). The median follow-up periods were 49.1 months (range: 0.4 ∼ 64.4 mo) in SNUH-2004-GC and 76.0 months (range: 2.0 ∼ 96.0 mo) in SNUH-1996-GC, respectively.
None of the patients received preoperative chemotherapy or radiotherapy. Extended lymph node dissection was uniformly applied for the curatively resected cases, with mean number of retrieved lymph nodes of 31.5 (in the test set) and 32.0 (in the validation set), respectively. Adjuvant chemotherapy was not indicated in patients with stage Ia, but was usually administered in patients with stage II or higher disease. In patients with stage Ib, adjuvant chemotherapy was selectively indicated considering patient's physical activity and the presence of co-morbidity. A 5-fluorouracil (5-FU) based combination (5-FU plus cisplatin or 5-FU plus mitomycin) was the most commonly used chemotherapeutic regimen. The analysis of survival data of the patient was approved by the IRB at SNUH.
Immunohistochemical staining
For the immunohistochemistry in human tissues, except SNU-2004-GC and SNU-1996-GC, sections were blocked using normal serum provided in the Vectastain kit (Vector Laboratories, Burlingame, CA) and then incubated with the primary antibody overnight at 4°C. After incubation with biotinylated secondary antibody for an hour at room temperature, each slide was incubated either with horseradish-peroxidase-conjugated streptavidin followed by development with diaminobenzidine (Biogenex, San Ramon, CA) or with alkaline phosphatase-conjugated streptavidin followed by development with Vector Red (Vector Laboratories). The sections were counterstained with Mayer's hematoxylin. Detailed information on the selected primary antibodies is shown in Supplementary Table 2.
For the immunohistochemical staining of SNU-2004-GC and SNU-1996-GC, an automated procedure was applied with a Bond-Max Immunostainer and a Bond polymer Refine Detection Kit (Leica Microsystems, Germany) according to the manufacturer's recommendations.
After selecting only cancer tissues in each core, pre-defined staining patterns (membranous or cytoplasmic) of each protein were considered positive. A staining intensity was scored as 0 (negative), 1 (positive), and 2 (strong positive), and dichotomized into negative (0) and positive (1-2) for further analysis. If the staining was observed in less than 10% of total cancer cells within a core, it was considered as negative. Each TMA was scored independently by different pathologic specialists without any clinical information (Vanderbilt-GC and SNUH-TA78 by N.K.T., SNUH-2004-GC by P.H.S., SNU-1996-GC by K.M.A. and K.W.H.)
Statistical analysis of tissue array staining
The association between protein expression and clinicopathologic variables was evaluated using the χ2 test. Disease-specific survival curves were calculated by the Kaplan-Meier method, and the log-rank test was used to evaluate the statistical difference. Any clinicopathologic variables as well as the expression of certain proteins with a log-rank p-value less than 0.1 were entered into the multivariate analysis. The Cox proportional hazards model was used for the multivariate analysis to identify independent prognostic factors for survival in a combined cohort of a test and a validation set. In addition, prognostic implications of each protein were evaluated in the subgroup stratified according to tumor location or Lauren classification in a combined cohort. All statistical analyses were conducted using the SPSS version 13.0 (Chicago, IL, USA).
Results
Gene expression profile of SPEM and IM compared to normal chief cells
Based on our recent studies indicating that SPEM is derived from chief cells in mice,15,16 we sought to compare the expression profiles for microdissected IM and SPEM compared with normal chief cells. We identified 858 probes, which were differentially expressed between chief cells versus IM or SPEM. Among them, 45 probes were significantly up-regulated in both SPEM and IM, 523 were significantly up-regulated in IM alone, 287 were significantly down-regulated in IM alone, and 3 were significantly up-regulated in SPEM alone. No probe was significantly up-regulated in IM and simultaneously significantly down-regulated in SPEM, and vice versa (Supplementary Table 4). The top 25 genes which were significantly up-regulated in IM or in SPEM are listed in Table 1.
Table 1. Top 25 genes significantly up-regulated in intestinal metaplasia (A) or in spasmolytic polypeptide expressing metaplasia (B).
| (A) intestinal metaplasia (IM) | |||||
|---|---|---|---|---|---|
| No. | Symbol | Title | UniGene ID | Fold-up* | GO Cellular Component |
| 1 | FABP1 | fatty acid binding protein 1, liver | Hs.380135 | 788.9 | cytoplasm |
| 2 | REG4 | regenerating islet-derived family, member 4 | Hs.660883 | 441.8 | extracellular |
| 3 | OLFM4 | olfactomedin 4 | Hs.508113 | 309.7 | extracellular |
| 4 | GDA | guanine deaminase | Hs.494163 | 264.2 | intracellular |
| 5 | DEFA5 | defensin, alpha 5, Paneth cell-specific | Hs.655233 | 260.3 | extracellular |
| 6 | ACE2 | angiotensin I converting enzyme (peptidyl-dipeptidase A) 2 | Hs.178098 | 259.6 | extracellular |
| 7 | DMBT1 | deleted in malignant brain tumors 1 | Hs.279611 | 253.2 | extracellular |
| 8 | PCK1 | phosphoenolpyruvate carboxykinase 1 | Hs.1872 | 215.6 | cytoplasm |
| 9 | CLCA1 | Chloride channel accessory 1 | Hs.194659 | 204.2 | integral to membrane |
| 10 | RBP2 | retinol binding protein 2, cellular | Hs.655516 | 193.9 | cytoplasm |
| 11 | KRT20 | keratin 20 | Hs.84905 | 190.6 | cytoplasm |
| 12 | HSD17B2 | hydroxysteroid (17-β) dehydrogenase 2 | Hs.162795 | 189.6 | endoplasmic reticulum membrane |
| 13 | MTTP | microsomal triglyceride transfer protein | Hs.195799 | 186.4 | soluble fraction |
| 14 | CDH17 | cadherin 17, LI cadherin (liver-intestine) | Hs.591853 | 156.3 | membrane fraction |
| 15 | SLC26A3 | solute carrier family 26, member 3 | Hs.1650 | 151.6 | membrane fraction |
| 16 | SI | sucrase-isomaltase (alpha-glucosidase) | Hs.429596 | 145.1 | Golgi apparatus |
| 17 | ANPEP | alanyl (membrane) aminopeptidase | Hs.1239 | 129.8 | soluble fraction |
| 18 | LGALS4 | lectin, galactoside-binding, soluble, 4 (galectin 4) | Hs.5302 | 128.8 | cytosol |
| 19 | SLC5A1 | solute carrier family 5 (sodium/glucose cotransporter), member 1 | Hs.1964 | 126.3 | integral to plasma membrane |
| 20 | MUC13 | mucin 13, cell surface associated | Hs.5940 | 115.1 | extracellular |
| 21 | SPINK4 | serine peptidase inhibitor, Kazal type 4 | Hs.555934 | 113.7 | extracellular |
| 22 | APOB | apolipoprotein B (including Ag(x) antigen) | Hs.120759 | 113.6 | extracellular |
| 23 | CPS1 | carbamoyl-phosphate synthetase 1, mitochondrial | Hs. 149252 | 108.9 | mitochondrion |
| 24 | GBA3 | glucosidase, beta, acid 3 (cytosolic) | Hs.653107 | 103.8 | cytoplasm |
| 25 | PRSS7 | protease, serine, 7 (enterokinase) | Hs.149473 | 99.2 | brush border |
| (B) spasmolytic polypeptide expressing metaplasia (SPEM) | |||||
| No. | Symbol | Title | UniGene ID | Fold-up* | GO Cellular Component |
| 1 | OLFM4 | olfactomedin 4 | Hs.508113 | 102.8 | extracellular |
| 2 | TFF1 | trefoil factor 1 | Hs.162807 | 31.2 | extracellular |
| 3 | GKN2 | gastrokine 2 | Hs.16757 | 26.4 | extracellular |
| 4 | TFF2 | trefoil factor 2 (spasmolytic protein 1) | Hs.2979 | 24.9 | extracellular |
| 5 | DPCR1 | diffuse panbronchiolitis critical region 1 | Hs.631993 | 23.3 | membrane |
| 6 | S100P | S100 calcium binding protein P | Hs.2962 | 22.6 | nucleus |
| 7 | FCGBP | Fc fragment of IgG binding protein | Hs.111732 | 21.6 | extracellular |
| 8 | LGALS4 | lectin, galactoside-binding, soluble, 4 (galectin 4) | Hs.5302 | 17.6 | cytosol |
| 9 | CEACAM5 | carcinoembryonic antigen-related cell adhesion molecule 5 | Hs.709196 | 16.8 | plasma membrane |
| 10 | GDA | guanine deaminase | Hs.494163 | 14.1 | intracellular |
| 11 | LYZ | lysozyme (renal amyloidosis) | Hs.524579 | 13.8 | extracellular |
| 12 | CFTR | cystic fibrosis transmembrane conductance regulator | Hs.489786 | 13.7 | membrane fraction |
| 13 | MUC5AC | mucin 5AC, oligomeric mucus/gel-forming | Hs.558950 | 13.3 | extracellular |
| 14 | KRT20 | keratin 20 | Hs.84905 | 12.0 | cytoplasm |
| 15 | ADH1C | alcohol dehydrogenase 1C (class I), gamma polypeptide | Hs.654537 | 12.0 | cytoplasm |
| 16 | AKR1B10 | aldo-keto reductase family 1, member B10 (aldose reductase) | Hs. 116724 | 11.6 | cytoplasm |
| 17 | CDCA7 | cell division cycle associated 7 | Hs.470654 | 10.4 | nucleus |
| 18 | SLC5A1 | solute carrier family 5 (sodium/glucose cotransporter), member 1 | Hs.1964 | 10.2 | integral to plasma membrane |
| 19 | CYP2C18 | cytochrome P450, family 2, subfamily C, polypeptide 18 | Hs.511872 | 9.9 | endoplasmic reticulum |
| 20 | ELOVL6 | ELOVL family member 6, elongation of long chain fatty acids | Hs.412939 | 9.7 | mitochondrion |
| 21 | MUC13 | mucin 13, cell surface associated | Hs.5940 | 9.6 | extracellular |
| 22 | SLC6A14 | solute carrier family 6 (amino acid transporter), member 14 | Hs.522109 | 9.6 | integral to plasma membrane |
| 23 | AADAC | arylacetamide deacetylase (esterase) | Hs.506908 | 9.4 | endoplasmic reticulum |
| 24 | HSD17B2 | hydroxysteroid (17-beta) dehydrogenase 2 | Hs. 162795 | 9.3 | endoplasmic reticulum membrane |
| 25 | GCNT3 | glucosaminyl (N-acetyl) transferase 3, mucin type | Hs.194710 | 9.1 | Golgi membrane |
Fold change of genes in IM or SPEM, compared to chief cell
Identification of markers for gastric metaplastic lineages
To examine the protein expression of selected genes in gastric metaplastic lineages, we performed immunohistochemical staining in IM, SPEM, and normal gastric fundic mucosa with more than 20 antibodies. Twelve proteins were expressed in different locations and distributions in IM, including (1) apical membranous expression in the luminal gland (ACE2) or in the entire gland (MUC13)21, (2) lateral membranous expression in the entire gland (CDH17)22 (3) scattered expression at the bases of gland (OLFM4)23, (4) goblet staining in IM cells in the entire gland (MUC5AC, REG4)24,25, (5) diffuse cytoplasmic expression in the luminal gland cells (KRT20)26 or in the entire gland (LGALS4, AKR1B10, FABP1)27, and (6) Paneth cell expression at the bases of glands (LYZ, DEFA5)28. Three markers (ACE2, LGALS4, AKR1B10) had not been associated with IM previously. In addition, three proteins (OLFM4, LYZ, DPCR1) were found as novel SPEM markers. Out of 13 proteins described here, eight were completely negative in normal fundic mucosa, but five including MUC5AC, KRT20, LGALS4, AKR1B10 were expressed in normal foveolar cells. OLFM4 was expressed strongly in scattered cells at the bases of fundic glands and also showed variable diffuse staining in parietal cells (Table 2, Fig 1).
Table 2. Expression profile of 13 proteins in normal fundus, intestinal metaplasia (IM), spasmolytic polypeptide expressing metaplasia (SPEM), and gastric cancer.
| Marker | Normal fundus | IM pattern | IM location | SPEM | Gastric cancer | Intestinal type GC | Diffuse type GC | |
|---|---|---|---|---|---|---|---|---|
| 1 | MUC13 | - | Membranous (apical) | entire | - | 50% (18/36) |
91%† (10/11) |
8% (1/13) |
| 2 | CDH17 | FC+ | Membranous (lateral) | entire | - | 41% (17/42) |
42% (11/26) |
42% (5/12) |
| 3 | OLFM4 | PC+ | scattered | basal | + | 41% (17/42) |
46% (12/26) |
25% (3/12) |
| 4 | MUC5AC | FC+ | goblet | entire | - | 36% (15/42) |
50% (13/26) |
17% (2/12) |
| 5 | KRT20 | FC+ | cytoplasmic | luminal | - | 36% (13/36) |
73% (8/11) |
0 (0/13) |
| 6 | LGALS4* | FC+ | cytoplasmic | entire | - | 29% (12/42) |
31% (8/26) |
17% (2/12) |
| 7 | AKR1B10* | - | cytoplasmic | entire | - | 29% (12/42) |
35% (9/26) |
17% (2/12) |
| 8 | REG4 | - | goblet | entire | - | 17% (7/42) |
19% (5/26) |
8% (1/12) |
| 9 | ACE2* | - | Membranous (apical) | luminal | - | 0 (0/36) |
0 (0/11) |
0 (0/13) |
| 10 | FABP1 | - | cytoplasmic | entire | - | 0 (0/42) |
0 (0/26) |
0 (0/12) |
| 11 | LYZ | - | Paneth cell | basal | + | 0 (0/36) |
0 (0/11) |
0 (0/13) |
| 12 | DEFA5 | - | Paneth cell | basal | - | 0 (0/36) |
0 (0/11) |
0 (0/13) |
| 13 | DPCR1 | - | - | - | + | 0 (0/36) |
0 (0/11) |
0 (0/13) |
Abbreviations: FC, foveolar cell; PC, parietal cell; IM, intestinal metaplasia; SPEM, spasmolytic polypeptide expressing metaplasia; GC, gastric cancer.
novel markers for IM
membranous pattern.
Statistically significant p-values (p<0.05) are in boldface.
sorted by the expression rate in gastric cancer tissue.
Fig 1. Protein expression of the selected genes in metaplastic lineages in the stomach.

See Table 2(A) for detailed information on immunohistochemical staining.
(A-L) Immunohistochemical staining of the selected genes in normal fundus (left, ×50) and intestinal metaplasia (IM) (right, ×100; insert ×400) (A) ACE2, (B) MUC13, (C) CDH17, (D) OLFM4, (E) MUC5AC, (F) REG4, (G) KRT20, (H) LGALS4, (I) AKR1B10, (J) FABP1, (K) LYZ, (L) DEFA5, (M-O) Immunohistochemical staining of the selected genes in SPEM (M) OLFM4 in SPEM (left, ×50; insert, ×200), (N) LYZ in normal jejunum (left, ×100) and in SPEM (right, ×100; insert, ×400), (O) DPCR1 in normal fundus (left, ×50) and in SPEM (right, ×100; insert ×400).
Expression profile of metaplastic lineage markers in gastric cancer
To identify the expression profiles in gastric cancer tissues of 13 proteins, which were expressed in IM or SPEM, we performed immunohistochemical staining in either the Vanderbilt-GC or SNUH-TA78 tissue arrays. MUC13 showed the highest expression rate in gastric cancers (50%), followed by OLFM4 (41%), CDH17 (41%), KRT20 (36%), MUC5AC (36%), LGALS4 (29%), AKR1B10 (29%), and REG4 (17%). ACE2, FABP1, DPCR1, LYZ, and DEFA5 were not expressed in any of the gastric cancers (Fig 2). All of the proteins expressed in gastric cancers showed predominant expression in intestinal-type tumors, although the difference between intestinal-type and diffuse-type cancers did not reach statistical significance except for MUC13 and KRT20, both of which showed significantly higher expression in intestinal-type than in diffuse-type tumors (Table 2).
Fig 2. Protein expression of the selected genes in gastric adenocarcinoma.

(original magnification ×100; all gastric cancer tissues are intestinal-type, except (B) which is diffuse-type). (A) MUC13, membranous pattern, (B) MUC13, cytoplasmic pattern, (C) OLFM4, (D) CDH17, (E) KRT20, (F) MUC5AC, (G) LGALS4, (H) AKR1B10, (I)REG4.
Clinicopathologic and prognostic significance of MUC13, OLFM4, and CDH17 in gastric cancer patients
For the proteins which were expressed in more than 40% of gastric cancers (MUC13, OLFM4, CDH17), we tested the clinicopathologic and prognostic significance of the expression of these proteins in the SNUH-2004-GC TMA (n=450; test set), and subsequently validated them in the SNUH-1996-GC TMA (n=502; validation set).
CDH17 was expressed in a membranous pattern in 61.1% and 65.0% of gastric cancers in the test and the validation set, respectively (Fig 2D). CDH17 expression was significantly higher in intestinal-type cancers than in diffuse-type cancers. There was no significant difference in terms of lymphatic or venous invasion. The expression pattern according to TNM stage was not consistent between the test and the validation set (Table 3). In the test set, the 5-year survival rate was significantly higher in patients with cancers expressing CDH17 (p=0.017, Fig 3A). This survival difference was preserved only in patients with stage I disease (p=0.006, Fig 3C), not in stage II or more (data not shown). Similarly, this survival difference was preserved only in patients with node-negative disease (p=0.007, Fig 3E), not in cases with node-positive disease (data not shown). These prognostic impacts of CDH17 were reproduced in the validation set (Fig 3B, D, F).
Table 3. Expression profile of CDH17, MUC13, and OLFM4 in gastric cancer according to the clinicopathologic characteristics*.
| 1) CDH17 (membranous expression) | |||||
| 2004 (n=440) | p-value | 1996 (n=452) | p-value | ||
| Total | 61.1% (269/440) | 65.0% (294/452) | |||
| Lauren | Intestinal | 68.2% (122/179) | 0.037 | 73.5% (150/204) | 0.002 |
| Diffuse | 54.1% (98/181) | 59.1% (137/232) | |||
| Mixed | 61.3% (49/80) | 40% (6/15) | |||
| TNM | I | 64.2% (124/193) | 0.025 | 68.1% (113/166) | 0.28 |
| II | 69.4% (59/85) | 68.6% (70/102) | |||
| III | 48.1% (39/81) | 62.8% (71/113) | |||
| IV | 58.0% (47/81) | 56.3% (40/71) | |||
| 2) MUC13 (membranous expression) | |||||
| 2004 (n=433) | p-value | 1996 (n=472) | p-value | ||
| Total | 44.1% (191/433) | 44.5% (210/472) | |||
| Lauren | Intestinal | 79.0% (139/176) | <0.001 | 80.0% (160/200) | <0.001 |
| Diffuse | 8.4% (15/179) | 16.9% (43/254) | |||
| Mixed | 47.4% (37/78) | 37.5% (6/16) | |||
| TNM | I | 53.7% (101/188) | 0.003 | 51.8% (88/170) | 0.044 |
| II | 41.7% (35/84) | 45.4% (49/108) | |||
| III | 35.8% (29/81) | 40.5% (49/121) | |||
| IV | 32.5% (26/80 | 33.3% (24/72) | |||
| 3) MUC13 (cytoplasmic expression) | |||||
| 2004 (n=433) | p-value | 1996 (n=472) | p-value | ||
| Total | 30.7% (133/433) | 25.4% (120/472) | |||
| Lauren | Intestinal | 18.2% (32/176) | <0.001 | 23.5% (47/200) | 0.431 |
| Diffuse | 40.8% (73/179) | 27.6% (70/254) | |||
| Mixed | 35.9% (28/78) | 12.5% (2/16) | |||
| TNM | I | 25.0% (47/188) | 0.033 | 22.4% (38/170) | 0.005 |
| II | 27.4% (23/84) | 19.4% (21/108) | |||
| III | 38.3% (31/81) | 24.8% (30/121) | |||
| IV | 40.0% (32/80) | 41.7% (30/72) | |||
| 4) OLFM4 (cytoplasmic expression) | |||||
| 2004 (n=435) | p-value | 1996 (n=476) | p-value | ||
| Total | 26.0% (113/435) | 27.1% (129/476) | |||
| Lauren | Intestinal | 32.4% (57/176) | 0.030 | 32.7% (67/205) | 0.11 |
| Diffuse | 19.4% (35/180) | 23.3% (59/253) | |||
| Mixed | 26.6% (21/79) | 18.8% (3/16) | |||
| TNM | I | 30.7% (58/189) | 0.17 | 28.1% (48/171) | 0.98 |
| II | 22.6% (19/84) | 25.7% (28/109) | |||
| III | 18.5% (15/81) | 27.5% (33/120) | |||
| IV | 25.9% (21/81) | 26.7% (20/75) | |||
Missing cases were resulted from (1) the detachment of section during immunostaining or (2) no cancer cells observed in the section.
Statistically significant p-values (p<0.05) are in boldface.
Fig 3. Disease-specific survival curves of gastric cancer patients according to the expression of CDH17 in a test set and in a validation set.
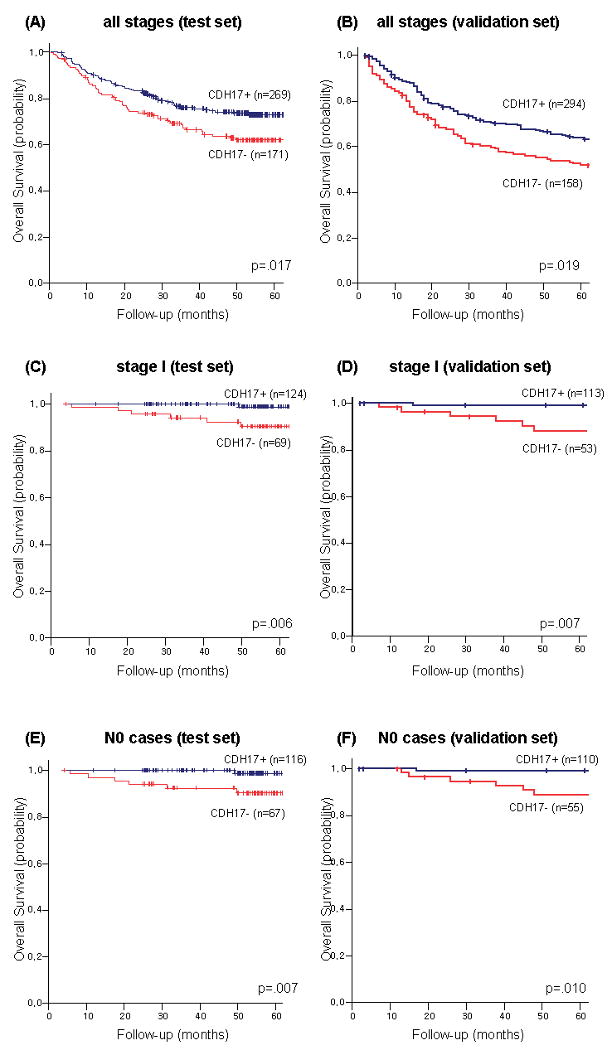
(A) CDH17 in all stages in the test set), (B) CDH17 in all stages in the validation set, (C) CDH17 in curatively resected, stage I cases in the test set, (D) CDH17 in curatively resected, stage I cases in the validation set, (E) CDH17 in curatively resected, node-negative cases in the test set, (F) CDH17 in curatively resected, node-negative cases in the validation set.
Two different expression patterns were observed for MUC13: membranous and diffuse cytoplasmic. The membranous pattern of MUC13 staining was observed in 44.1% of gastric cancers in the test set and in 44.5% of the validation set, respectively (Fig 2A), and its expression was significantly higher in intestinal-type tumors and in earlier TNM stage in both sets. The diffuse cytoplasmic pattern of MUC13 was expressed in 30.7% of the test set cases and in 25.4% of the validation set (Fig 2B). In contrast with the membranous pattern, the cytoplasmic expression was significantly higher in advanced TNM stages (Table 3). Five-year disease-specific survival rate was significantly higher in cases expressing membranous pattern of MUC13 in the test set (p=0.029, Fig 4A) and in the validation set (p<0.001, Fig 4B). In contrast, the prognostic impact of cytoplasmic expression of MUC13 showed a tendency towards decreased survival, although it did not reach statistical significance in either set (Fig. 4C and 4D). These findings support the concept that redistribution of MUC13 off the membrane is related to poorer patient outcome.
Fig 4. Disease-specific survival curves of gastric cancer patients according to the expression of MUC13 in a test set and in a validation set.
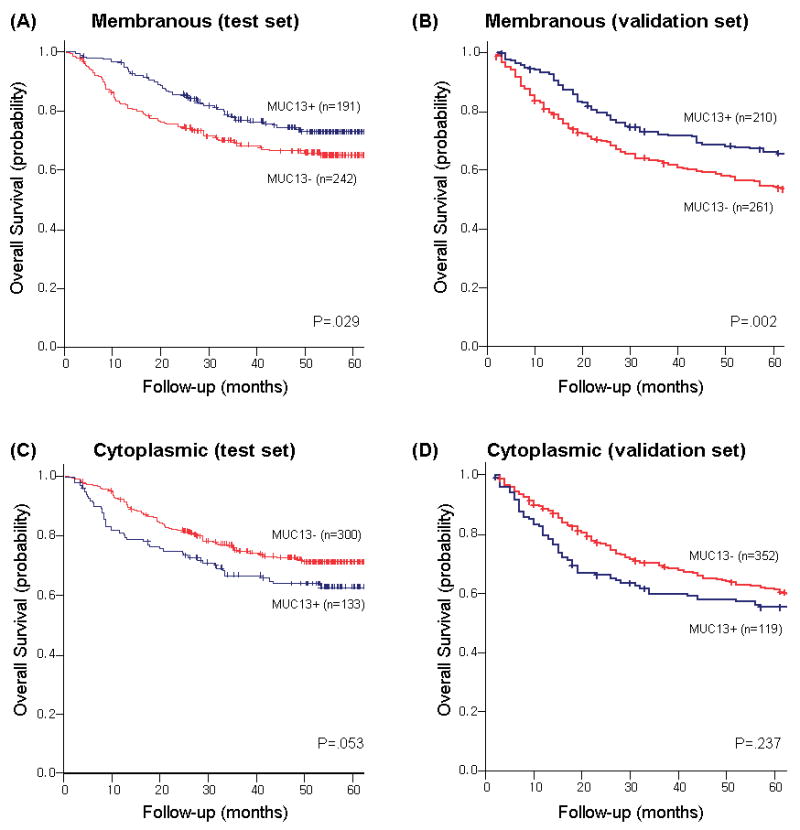
(A) membranous pattern of MUC13 in all stages in the test set, (B) membranous pattern of MUC13 in all stages in the validation set), (C) cytoplasmic pattern of MUC13 in all stages in the test set, (D) cytoplasmic pattern of MUC13 in all stages in the validation set)
OLFM4 was expressed in a diffuse cytoplasmic pattern in 26.0% of the test set cases and in 27.1% of the validation set (Fig 2C). OLFM4 expression showed a tendency towards higher expression in intestinal-type cancers than in diffuse-type cancers. There was no significant difference in relation to TNM stage or lymphatic or venous invasion (Table 3). The prognostic impact of OLFM4 expression was not observed in the entire gastric cancer patient cohort. Although 5-year disease-specific survival rate was significantly lower in OLFM4 positive cases in stage I disease in the test set (p=0.018), this significance was not observed in the validation set (p=0.889).
Multivariate analysis and Subgroup analysis
When we performed a multivariate analysis of all patients, only TNM classifications were revealed as an independent prognostic factor for survival (data not shown). However, in the case of patients with stage I disease, as with TNM stage and venous invasion, the expression of CDH17 was also revealed as an independent prognostic factor for disease-specific survival (Supplementary Table 5). In addition, in the case of patients with node-negative, curatively resected cancers, as with T-classification, the expression of CDH17 was also an independent prognostic factor for disease-specific survival (Supplementary Table 5). These independent prognostic impacts of CDH17 in stage I or in node-negative gastric cancer patients were observed both in the test set and in the validation set, even when analyzed separately (data not shown).
In a subgroup analysis according to the tumor location, the expression of CDH17 and the membranous expression of MUC13 showed a better prognosis only in antral cancers (p=0.006 and p=0.002, respectively), but not in the non-antral cancers. According to Lauren classification, the expression of CDH17 showed a better prognosis only in diffuse type (p=0.014), but not in intestinal type cancers. In contrast, cytoplasmic expression of MUC13 showed worse survival only in intestinal type cancers (p=0.018), not in diffuse type tumors.
Discussion
Perioperative or postoperative chemotherapy is generally recommended for the treatment of advanced gastric cancer.3,29 However, for stage I gastric cancer, which has a 20∼30% 5-year recurrence rate, appropriate criteria for adjuvant chemotherapy have not been available. In contrast, in the early-stage, node-negative breast cancer, a number of prognostic markers are used in the clinical setting to select candidates for adjuvant treatment.30 The results in the present investigation suggest that CDH17, an independent prognostic marker for stage I or node-negative gastric cancer, is a useful biomarker for selection of adjuvant chemotherapy in early-stage gastric cancer patients, although further large-scale prospective studies are required.
To identify genes associated with the early neoplastic processes, we have focused the present investigation on the identification of biomarkers for metaplastic lineages. IM is established as a possible premalignant lineage for gastric cancer, although many questions remain regarding its direct involvement in cancer pathogenesis.10,31 In contrast, the role of SPEM as a preneoplastic process has received attention only recently. Animal studies have suggested that SPEM originates from transdifferentiation of chief cells in fundic glands, and can evolve into dysplasia in the presence of a chronic inflammatory process.11,12 Furthermore, investigations in Mongolian gerbils infected with H. pylori and in amphiregulin knockout mice have supported the concept that SPEM evolves first following loss of parietal cells, while IM develops from SPEM as a secondary metaplasia.17,18 This relationship between SPEM and IM is supported by our present cDNA microarray data of IM and SPEM, where 45 (94%) of 48 probes significantly up-regulated in SPEM were also significantly up-regulated in IM. Indeed, for a number of these genes, we observed a progression of increased expression from chief cells to SPEM and from SPEM to IM. Nevertheless, caution is merited in the interpretation of transcript expression profiles based on microarray. Thus, we also noted prominent elevations in the expression of TFF1 and GKN2 transcripts in SPEM and IM. However, while we have observed protein immunostaining for TFF1 in normal surface cells, in the same sections we saw no staining of either SPEM or IM (data not shown). It is therefore critical to validate that elevations in mRNA expression are reflected in changes in protein expression.
Among the genes identified in metaplasia, we successfully documented an independent prognostic biomarker, CDH17, especially in early-stage gastric cancer. CDH17 (cadherin-17; liver-intestine cadherin) is a structurally unique member of the cadherin superfamily, and acts as a functional Ca2+-dependent homophilic cell adhesion molecule.32 In humans, CDH17 is expressed exclusively on the basolateral surface of hepatocytes and enterocytes, as confirmed in the present study (Fig 1D). After the first report of CDH17 as an IM marker by Grotzinger et al,22 several investigations have evaluated CDH17 expression in gastric cancer. CDH17 was expressed in 60-78% of gastric cancer tissues with intestinal-type predominance, similar to our data here.33,34 However, the relationship between CDH17 expression and cancer stage or patients' survival was inconclusive. Park and colleagues evaluated the CDH17 expression in more than 200 gastric cancer tissue samples, and reported that it was highly expressed in earlier TNM stages.35 However, others reported that its expression was much higher in advanced cancer stages.33,36 As a prognostic factor, the previously available data were limited, but CDH17 expression showed a tendency towards an unfavorable indicator for survival.33,36 In our study, the mRNA expression of CDH17 was increased 156.3-fold in IM and 7.8-fold in SPEM, compared to normal chief cells. Also, CDH17 was expressed in 61-65% of human gastric cancers with no correlation with TNM stage. The favorable impact of CDH17 expression on a prognosis of stage I or node-negative gastric cancer patients, shown in both the test set and the validation set in our study, may reflect the role of this protein in the maintenance of polarity and normal cell-to-cell adhesion.
MUC13 (mucin 13) was also revealed as a novel prognostic marker. MUC13 gene encodes a transmembrane mucin that is specifically expressed in digestive tract tissues.37 Over-expression of MUC13 was reported previously in several cancers including gastric, colorectal, and ovarian cancers.21,38,39 Our results showed that two distinct staining patterns (membranous and cytoplasmic) exist for MUC13 in gastric cancer tissues, a finding similar to the previous report on colorectal cancer tissues.38 The membranous pattern was expressed in gastric cancer with intestinal-type histology, an early stage, and a favorable outcome, while the cytoplasmic pattern correlated with advanced stage. A significant reverse correlation was observed in membranous and cytoplasmic expression patterns of MUC13 in our study (R2= -0.173, p<0.001 in Pearson's correlation). The underlying mechanism of this distinct staining pattern for MUC13 in gastric cancers will require further investigation.
OLFM4 (olfactomedin 4; hGC-1, GW112) is a member of a growing olfactomedin protein family.40 Some studies indicate that OLFM4 may act as an anti-apoptotic protein that promotes tumor growth.41 OLFM4 is normally expressed in small intestine, colon, and prostate, and its mRNA was over-expressed in gastric and colorectal cancers.4,44 Recently, OLFM4 was identified as a stem cell marker in the human intestine where it is co-expressed with Lgr5 which was reported as stem cell marker in the pyloric glands, not in the fundic glands.42,43 Liu et al. first reported the expression of OLFM4 in IM and in 65% of intestinal-type gastric cancer.23 Recently, Oue et al reported the serum ELISA data of OLFM4 in gastric cancer patients as well as its prognostic impact on survival.45 In those studies, OLFM4 was revealed as a favorable prognostic marker in intestinal-type gastric cancer, in contrast with the present study. Our data indicated that OLFM4 mRNA expression was increased 309.7-fold in IM and 102.8-fold in SPEM. Also, OLFM4 immunostaining was detected in 32% of intestinal-type gastric cancers and its prognostic impact was not consistent between the test set and the validation set. Subgroup analysis according to Lauren classification also did not show any prognostic impact of OLFM4 in our study. More studies are needed to validate the clinical implications of OLFM4 in gastric cancer.
In summary, we have identified a number of putative biomarkers for the metaplastic process in the stomach. CDH17 is an independent prognostic factor in patients with stage I or node-negative gastric cancer. Evaluation of CDH17 may allow better stratification of stage I disease patients with poorer prognosis for applying personalized strategies for adjuvant chemotherapy after curative surgery.
Supplementary Material
Acknowledgments
Grant support: These studies were supported by grants to J.R.G. from NIH RO1 DK071590, a pilot project grant from the Vanderbilt SPORE in Gastrointestinal Cancer (P50 CA95103), the AGA Funderburg Award in Gastric Biology Related to Cancer, a Department of Veterans Affairs Merit Review Award and a Discovery Grant from the Vanderbilt-Ingram Cancer Center, and by grants to H.J.L. from the Cancer Research Institute, Seoul National University (CRI-09-3) and the Seoul National University Hospital Research Fund (05-2009-002). The microarray studies were performed in the Vanderbilt Microarray Core Facility supported by the Vanderbilt Ingram Cancer Center (P30 CA68485) and the Vanderbilt Digestive Disease Research Center (DK058404).
Abbreviations
- IM
intestinal metaplasia
- IRB
institutional review board
- LCM
laser capture microdissection
- SNUH
Seoul National University Hospital
- SPEM
spasmolytic polypeptide expressing metaplasia
- TFF2
trefoil factor 2
- TMA
tissue microarray
Footnotes
Disclosure: all authors have no conflict of interest
Publisher's Disclaimer: This is a PDF file of an unedited manuscript that has been accepted for publication. As a service to our customers we are providing this early version of the manuscript. The manuscript will undergo copyediting, typesetting, and review of the resulting proof before it is published in its final citable form. Please note that during the production process errors may be discovered which could affect the content, and all legal disclaimers that apply to the journal pertain.
Author Roles:
Hyuk-Joon Lee: Performed experiments, made figures, wrote manuscript.
Ki Taek Nam: Performed experiments, assisted data analysis, edited manuscript.
Hae Surng Park: Developed tissue microarrays and patient survival data, edited manuscript.
Min A Kim: Evaluated biomarker immunostaining in tissue arrays, edited manuscript.
Bonnie LaFleur: Performed statistical analyses, edited manuscript.
Hirojuki Aburatani: Developed key antibody reagents, assisted in experimental design, edited manuscript.
Woo Ho Kim: Selected cases for microdissection, participated in experimental design, edited manuscript.
Han-Kwang Yang: Participated in experimental design and analysis, edited manuscript.
James R. Goldenring: Devised experimental protocol, supervised analysis, edited manuscript.
References
- 1.Parkin DM, Bray F, Ferlay J, Pisani P. Global cancer statistics, 2002. CA Cancer J Clin. 2005;55:74–108. doi: 10.3322/canjclin.55.2.74. [DOI] [PubMed] [Google Scholar]
- 2.Sasako M, Sano T, Yamamoto S, et al. D2 lymphadenectomy alone or with para-aortic nodal dissection for gastric cancer. N Engl J Med. 2008;359:453–462. doi: 10.1056/NEJMoa0707035. [DOI] [PubMed] [Google Scholar]
- 3.Sakuramoto S, Sasako M, Yamaguchi T, et al. Adjuvant chemotherapy for gastric cancer with S-1, an oral fluoropyrimidine. N Engl J Med. 2007;357:1810–1820. doi: 10.1056/NEJMoa072252. [DOI] [PubMed] [Google Scholar]
- 4.Yasui W, Oue N, Aung PP, et al. Molecular-pathological prognostic factors of gastric cancer: a review. Gastric Cancer. 2005;8:86–94. doi: 10.1007/s10120-005-0320-0. [DOI] [PubMed] [Google Scholar]
- 5.Hasegawa S, Furukawa Y, Li M, et al. Genome-wide analysis of gene expression in intestinal-type gastric cancers using a complementary DNA microarray representing 23,040 genes. Cancer Res. 2002;62:7012–7017. [PubMed] [Google Scholar]
- 6.Leung SY, Chen X, Chu KM, et al. Phospholipase A2 group IIA expression in gastric adenocarcinoma is associated with prolonged survival and less frequent metastasis. Proc Natl Acad Sci U S A. 2002;99:16203–16208. doi: 10.1073/pnas.212646299. [DOI] [PMC free article] [PubMed] [Google Scholar]
- 7.Boussioutas A, Li H, Liu J, et al. Distinctive patterns of gene expression in premalignant gastric mucosa and gastric cancer. Cancer Res. 2003;63:2569–2577. [PubMed] [Google Scholar]
- 8.Oue N, Hamai Y, Mitani Y, et al. Gene expression profile of gastric carcinoma: identification of genes and tags potentially involved in invasion, metastasis, and carcinogenesis by serial analysis of gene expression. Cancer Res. 2004;64:2397–2405. doi: 10.1158/0008-5472.can-03-3514. [DOI] [PubMed] [Google Scholar]
- 9.Vecchi M, Nuciforo P, Romagnoli S, et al. Gene expression analysis of early and advanced gastric cancers. Oncogene. 2007;26:4284–4294. doi: 10.1038/sj.onc.1210208. [DOI] [PubMed] [Google Scholar]
- 10.Gutiérrez-González L, Wright NA. Biology of intestinal metaplasia in 2008: more than a simple phenotypic alteration. Dig Liver Dis. 2008;40:510–522. doi: 10.1016/j.dld.2008.02.029. [DOI] [PubMed] [Google Scholar]
- 11.Wang TC, Goldenring JR, Dangler C, et al. Mice lacking secretory phospholipase A2 show altered apoptosis and differentiation with Helicobacter felis infection. Gastroenterology. 1998;114:675–89. doi: 10.1016/s0016-5085(98)70581-5. [DOI] [PubMed] [Google Scholar]
- 12.Houghton J, Stoicov C, Nomura S, et al. Gastric cancer originating from bone marrow-derived cells. Science. 2004;306:1568–1571. doi: 10.1126/science.1099513. [DOI] [PubMed] [Google Scholar]
- 13.Schmidt PH, Lee JR, Joshi V, et al. Identification of a metaplastic cell lineage associated with human gastric adenocarcinoma. Lab Invest. 1999;79:639–646. [PubMed] [Google Scholar]
- 14.Yamaguchi H, Goldenring JR, Kaminishi M, et al. Identification of spasmolytic polypeptide expressing metaplasia (SPEM) in remnant gastric cancer and surveillance postgastrectomy biopsies. Dig Dis Sci. 2002;47:573–578. doi: 10.1023/a:1017920220149. [DOI] [PubMed] [Google Scholar]
- 15.Nam KT, Varro A, Coffey RJ, et al. Potentiation of oxyntic atrophy-induced gastric metaplasia in amphiregulin-deficient mice. Gastroenterology. 2007;132:1804–1819. doi: 10.1053/j.gastro.2007.03.040. [DOI] [PubMed] [Google Scholar]
- 16.Nozaki K, Ogawa M, Williams JA, et al. A molecular signature of gastric metaplasia arising in response to acute parietal cell loss. Gastroenterology. 2008;134:511–522. doi: 10.1053/j.gastro.2007.11.058. [DOI] [PMC free article] [PubMed] [Google Scholar]
- 17.Nam KT, Lee HJ, Mok H, et al. Amphiregulin-deficient mice develop spasmolytic polypeptide expressing metaplasia and intestinal metaplasia. Gastroenterology. 2009;136:1288–1296. doi: 10.1053/j.gastro.2008.12.037. [DOI] [PMC free article] [PubMed] [Google Scholar]
- 18.Yoshizawa N, Takenaka Y, Yamaguchi H, et al. Emergence of spasmolytic polypeptide-expressing metaplasia in Mongolian gerbils infected with Helicobacter pylori. Lab Invest. 2007;87:1265–1276. doi: 10.1038/labinvest.3700682. [DOI] [PubMed] [Google Scholar]
- 19.Hochberg Y, Benjamini Y. More powerful procedures for multiple significance testing. Stat Med. 1990;9:811–818. doi: 10.1002/sim.4780090710. [DOI] [PubMed] [Google Scholar]
- 20.Leys CM, Nomura S, Rudzinski E, et al. Expression of Pdx-1 in human gastric metaplasia and gastric adenocarcinoma. Hum Pathol. 2006;37:1162–1168. doi: 10.1016/j.humpath.2006.04.011. [DOI] [PubMed] [Google Scholar]
- 21.Shimamura T, Ito H, Shibahara J, Watanabe A, et al. Overexpression of MUC13 is associated with intestinal-type gastric cancer. Cancer Sci. 2005;96:265–273. doi: 10.1111/j.1349-7006.2005.00043.x. [DOI] [PMC free article] [PubMed] [Google Scholar]
- 22.Grötzinger C, Kneifel J, Patschan D, et al. LI-cadherin: a marker of gastric metaplasia and neoplasia. Gut. 2001;49:73–81. doi: 10.1136/gut.49.1.73. [DOI] [PMC free article] [PubMed] [Google Scholar]
- 23.Liu W, Zhu J, Cao L, et al. Expression of hGC-1 is correlated with differentiation of gastric carcinoma. Histopathology. 2007;51:157–165. doi: 10.1111/j.1365-2559.2007.02763.x. [DOI] [PubMed] [Google Scholar]
- 24.Reis CA, David L, Correa P, et al. Intestinal metaplasia of human stomach displays distinct patterns of mucin (MUC1, MUC2, MUC5AC, and MUC6) expression. Cancer Res. 1999;59:1003–1007. [PubMed] [Google Scholar]
- 25.Oue N, Mitani Y, Aung PP, et al. Expression and localization of Reg IV in human neoplastic and non-neoplastic tissues: Reg IV expression is associated with intestinal and neuroendocrine differentiation in gastric adenocarcinoma. J Pathol. 2005;207:185–198. doi: 10.1002/path.1827. [DOI] [PubMed] [Google Scholar]
- 26.Ormsby AH, Vaezi MF, Richter JE, et al. Cytokeratin immunoreactivity patterns in the diagnosis of short-segment Barrett's esophagus. Gastroenterology. 2000;119:683–690. doi: 10.1053/gast.2000.16482. [DOI] [PubMed] [Google Scholar]
- 27.Hashimoto T, Kusakabe T, Watanabe K, et al. Liver-type fatty acid-binding protein is highly expressed in intestinal metaplasia and in a subset of carcinomas of the stomach without association with the fatty acid synthase status in the carcinoma. Pathobiology. 2004;71:115–122. doi: 10.1159/000076465. [DOI] [PubMed] [Google Scholar]
- 28.Ouellette AJ. Paneth cells and innate immunity in the crypt microenvironment. Gastroenterology. 1997;113:1779–1784. doi: 10.1053/gast.1997.v113.pm9352884. [DOI] [PubMed] [Google Scholar]
- 29.Cunningham D, Allum WH, Stenning SP, et al. Perioperative chemotherapy versus surgery alone for resectable gastroesophageal cancer. N Engl J Med. 2006;355:11–20. doi: 10.1056/NEJMoa055531. [DOI] [PubMed] [Google Scholar]
- 30.Mirza AN, Mirza NQ, Vlastos G, et al. Prognostic factors in node-negative breast cancer: a review of studies with sample size more than 200 and follow-up more than 5 years. Ann Surg. 2002;235:10–26. doi: 10.1097/00000658-200201000-00003. [DOI] [PMC free article] [PubMed] [Google Scholar]
- 31.Meining A, Morgner A, Miehlke S, et al. Atrophy-metaplasia-dysplasia-carcinoma sequence in the stomach: a reality or merely a hypothesis? Best Pract Res Clin Gastroenterol. 2001;15:983–998. doi: 10.1053/bega.2001.0253. [DOI] [PubMed] [Google Scholar]
- 32.Gessner R, Tauber R. Intestinal cell adhesion molecules. Liver-intestine cadherin. Ann N Y Acad Sci. 2000;915:136–143. doi: 10.1111/j.1749-6632.2000.tb05236.x. [DOI] [PubMed] [Google Scholar]
- 33.Ito R, Oue N, Yoshida K, Kunimitsu K, et al. Clinicopathological significant and prognostic influence of cadherin-17 expression in gastric cancer. Virchows Arch. 2005;447:717–722. doi: 10.1007/s00428-005-0015-2. [DOI] [PubMed] [Google Scholar]
- 34.Ko S, Chu KM, Luk JM, et al. CDX2 co-localizes with liver-intestine cadherin in intestinal metaplasia and adenocarcinoma of the stomach. J Pathol. 2005;205:615–622. doi: 10.1002/path.1741. [DOI] [PubMed] [Google Scholar]
- 35.Park SS, Kang SH, Park JM, et al. Expression of liver-intestine cadherin and its correlation with lymph node metastasis in gastric cancer: can it predict N stage preoperatively? Ann Surg Oncol. 2007;14:94–99. doi: 10.1245/s10434-006-9114-9. [DOI] [PubMed] [Google Scholar]
- 36.Ge J, Chen Z, Wu S, et al. A clinicopathological study on the expression of cadherin-17 and caudal-related homeobox transcription factor (CDX2) in human gastric carcinoma. Clin Oncol (R Coll Radiol) 2008;20:275–283. doi: 10.1016/j.clon.2008.01.013. [DOI] [PubMed] [Google Scholar]
- 37.Williams SJ, Wreschner DH, Tran M, et al. Muc13, a novel human cell surface mucin expressed by epithelial and hemopoietic cells. J Biol Chem. 2001;276:18327–1836. doi: 10.1074/jbc.M008850200. [DOI] [PubMed] [Google Scholar]
- 38.Walsh MD, Young JP, Leggett BA, et al. The MUC13 cell surface mucin is highly expressed by human colorectal carcinomas. Hum Pathol. 2007;38:883–892. doi: 10.1016/j.humpath.2006.11.020. [DOI] [PubMed] [Google Scholar]
- 39.Chauhan SC, Vannatta K, Ebeling MC, et al. Expression and functions of transmembrane mucin MUC13 in ovarian cancer. Cancer Res. 2009;69:765–774. doi: 10.1158/0008-5472.CAN-08-0587. [DOI] [PubMed] [Google Scholar]
- 40.Zhang J, Liu WL, Tang DC, et al. Identification and characterization of a novel member of olfactomedin-related protein family, hGC-1, expressed during myeloid lineage development. Gene. 2002;283:83–93. doi: 10.1016/s0378-1119(01)00763-6. [DOI] [PubMed] [Google Scholar]
- 41.Zhang X, Huang Q, Yang Z, et al. GW112, a novel antiapoptotic protein that promotes tumor growth. Cancer Res. 2004;64:2474–2481. doi: 10.1158/0008-5472.can-03-3443. [DOI] [PubMed] [Google Scholar]
- 42.van der Flier LG, Haegebarth A, Stange DE, et al. OLFM4 is a robust marker for stem cells in human intestine and marks a subset of colorectal cancer cells. Gastroenterology. 2009;137:15–17. doi: 10.1053/j.gastro.2009.05.035. [DOI] [PubMed] [Google Scholar]
- 43.Barker N, Huch M, Kujala P, et al. Lgr5+ve stem cells drive self-renewal in the stomach and build long-lived gastric units in vitro. Cell Stem Cell. 2010;6:25–36. doi: 10.1016/j.stem.2009.11.013. [DOI] [PubMed] [Google Scholar]
- 44.Koshida S, Kobayashi D, Moriai R, et al. Specific overexpression of OLFM4 (GW112/HGC-1) mRNA in colon, breast and lung cancer tissues detected using quantitative analysis. Cancer Sci. 2007;98:315–320. doi: 10.1111/j.1349-7006.2006.00383.x. [DOI] [PMC free article] [PubMed] [Google Scholar]
- 45.Oue N, Sentani K, Noguchi T, et al. Serum olfactomedin 4 (GW112, hGC-1) in combination with Reg IV is a highly sensitive biomarker for gastric cancer patients. Int J Cancer. 2009;125:2383–2392. doi: 10.1002/ijc.24624. [DOI] [PubMed] [Google Scholar]
- 46.Fukumoto S, Yamauchi N, Moriguchi H, et al. Overexpression of the aldo-keto reductase family protein AKR1B10 is highly correlated with smokers' non-small cell lung carcinomas. Clin Cancer Res. 2005;11:1776–1785. doi: 10.1158/1078-0432.CCR-04-1238. [DOI] [PubMed] [Google Scholar]
Associated Data
This section collects any data citations, data availability statements, or supplementary materials included in this article.