Abstract
Real-time measurement of specific biomolecular interactions is critical to many areas of biological research. A number of label-free techniques for directly monitoring biomolecular binding have been developed, but it is still challenging to measure the binding kinetics of very small molecules, to detect low concentrations of analyte molecules, or to detect low affinity interactions. In this study, we report the development of a highly sensitive photonic crystal biosensor for label-free, real-time biomolecular binding analysis. We characterize the performance of this biosensor using a standard streptavidin-biotin binding system. Optimization of the surface functionalization methods for streptavidin immobilization on the silica sensing surface is presented, and the specific binding of biotinylated analyte molecules ranging over 3 orders of magnitude in molecular weight, including very small molecules (<250 Da), DNA oligonucleotides, proteins, and antibodies (>150 000 Da), are detected in real time with a high signal-to-noise ratio. Finally, we document the sensor efficiency for low mass adsorption, as well as multilayered molecular interactions. By all important metrics for sensitivity, we anticipate this photonic crystal biosensor will provide new capabilities for highly sensitive measurements of biomolecular binding.
Keywords: Optical biosensors, high sensitivity, label free, real time, biomolecular binding, small molecule detection, photonic crystal, total internal reflection
INTRODUCTION
The study of biomolecular binding affinity and kinetics, such as protein-protein binding, the binding of small molecules and drugs to biological targets, or evaluations of DNA hybridization, provides insights into fundamental biological processes and serves as the basis for diagnostic and drug discovery applications.1–3 For measurements of very small molecules (with molecular weights of 500 Da or below) or those at very low concentrations (within the femtomolar to nanomolar range), biomolecular detection usually requires labeling (such as fluorescent tags4); however, the conjugation of these tags may alter or inhibit the functionality of the target molecules. In contrast, label-free-based detection provides more accurate quantitative and kinetic measurements by monitoring the binding of analytes in their natural forms. A number of sensing technologies,5,6 including interferometry,7,8 plasmon sensing,9,10 nanowires,11 waveguides,12,13 microcavity resonators,14,15 and photonic crystals,16–18 have been developed, but the direct detection of small molecule binding still remains challenging.
The most widely used commercial system for label-free binding analysis is the surface Plasmon resonance (SPR)-based biosensor.6,9 It detects the binding of analytes to ligands immobilized on a continuous metal surface in a total-internal-reflection geometry. The excited surface plasmon modes are very sensitive to the influence of bound molecules on the refractive index of the dielectric medium adjacent to the metal film, with a sensitivity exceeding 103 nm per refractive index unit (RIU). However, because of large absorption in the metal film, the SPR resonance mode is broad (a few tens of nm), which restricts the conventional SPR-based sensor’s detection sensitivity and precludes its use for applications that require detection of small molecules (<1000 Da) or low surface coverage (smaller than 1 pg/mm2) of bound molecules.9 Although sophisticated engineering has improved the performance of commercial SPR-based systems for small molecule detection,19 inherently improving the sensor’s sensitivity is still the key to further advances. An example is the recently reported sensor system based on plasmonic nanorod metamaterials;10 it benefits from both an increase in the bulk refractive-index change and the larger sensing area of nanorod metamaterials matrix and achieves an order of magnitude higher sensitivity than conventional SPR sensors. This results in an improved detection limit size of approximately 250 Da (as measured with D-biotin binding), however, this is still not low enough for many biological applications.
One key to obtaining higher sensitivity is to narrow the optical resonance below that exhibited by classical surface plasmon resonances. For example, microtoroid resonators using whispering-gallery-mode (WGM) exhibit ultrahigh Q values (>108) and extremely narrow resonances (<1 pm), enabling very high resolution.14, 15 However, a problem with ultrahigh-Q resonators is that the light is tightly confined by the resonator and only a very small portion of the optical mode interacts with the analyte solution; this leads to a relatively low sensitivity (a few nm/RIU) and thus restricts the detection limit.20 In addition, ultrahigh-Q resonators generally suffer thermal instability21 and difficulties with consistency between experiments arising from coupling light into and out of the resonators.
Given the problems associated with both ultrahigh-Q and ultralow-Q resonators in sensing applications, moderate-Q photonic crystal-based biosensors have been widely studied.5, 16–18. Here, we focus our attention on a simple one-dimensional photonic crystal (1-D PC) structure (i.e., alternating pairs of dielectric layers). In this structure, the Q value can be easily adjusted by varying the number of alternating pairs. The periodicity of the PC structure forms a 1-D photonic bandgap, such that a range of wavelengths are not allowed to propagate within the structure. By introducing “defects” into the PC layer structure at an appropriate position, the electric field can be confined and enhanced in the vicinity of the sensing area where target analytes are adsorbed.
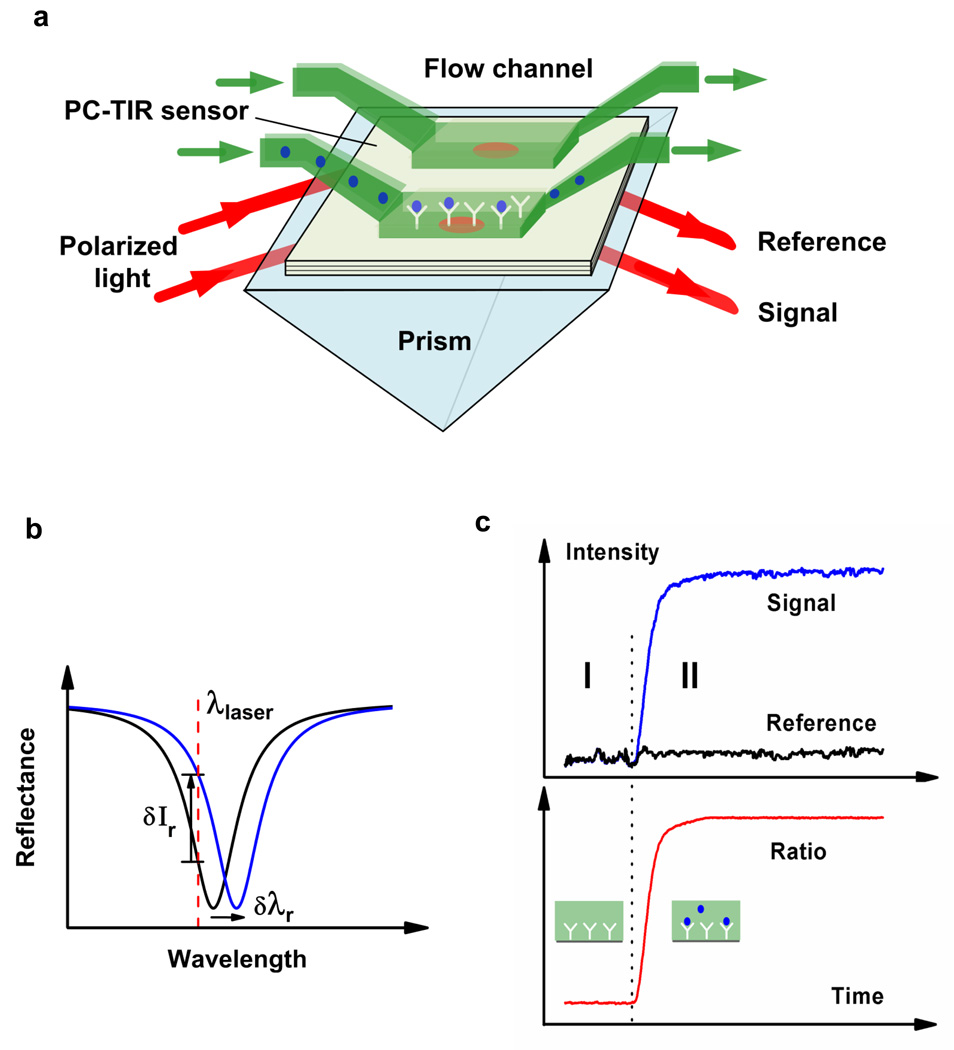
We recently demonstrated a novel optical sensor using a 1-D PC structure in a total-internal-reflection (TIR) geometry (PC-TIR).22 This sensor functions as a Fabry-Pérot resonator with a moderate Q (102~103), yielding a sharp resonance dip (~1 nm) and a large sensitivity (>103 nm/RIU), and yet the analyte binding surface is open to free space and allows real-time, label-free binding detection. Moreover, measuring the normalized reflected intensity with a single wavelength laser (e.g., HeNe laser) tuned to the steepest region (near half-width point) of the resonance mode, maximizes the optical sensitivity to a resonance shift arising from analyte binding to ligand-adsorbed sensing surface (Figure 1). The baseline noise floor of this PC-TIR sensor can reach 8×10⁻⁶, an ultimate resolution corresponding to a resonance wavelength shift 1.6×10⁻⁵ nm (Figure S-1, Supporting Information).
Figure 1.
Concept of PC-TIR sensor measurement. (a) Schematic sensor configuration showing identically polarized beams from the same light source incident on separate signal and reference channels. (b) The resonance mode shift can be monitored by directly observing the reflectance spectrum or by measuring the reflected intensity change at a laser wavelength. (c) Binding kinetics monitored by the reflected signal intensity and by the normalized intensity ratio, where region I is the baseline with ligand on the surface, and region II reflects real-time analyte binding to ligand.
In this study, we explore the capability of the PC-TIR sensor for making highly sensitive measurements of biomolecular interactions. We first characterize the sensor performance for bulk solvent refractive index changes and then use the well-studied biotin-streptavidin system to calibrate the detection limits for molecules of different molecular weights (MWs). Methods for effective immobilization of a binding layer of streptavidin on the silica sensing surface are discussed, and the real-time detection of biotinylated analyte molecules via binding to the sensing surface is presented and discussed. The binding of the smallest molecule investigated, D-biotin with a molecular weight of 244 Da, is experimentally observed with an unprecedented signal to noise ratio, which shows the great potential of the PC-TIR biosensor for sensitive biomolecular detection. We finally demonstrate its capabilities for detection of low mass adsorption and multilayered molecular assemblies.
EXPERIMENTAL SECTION
PC-TIR Sensor Structure
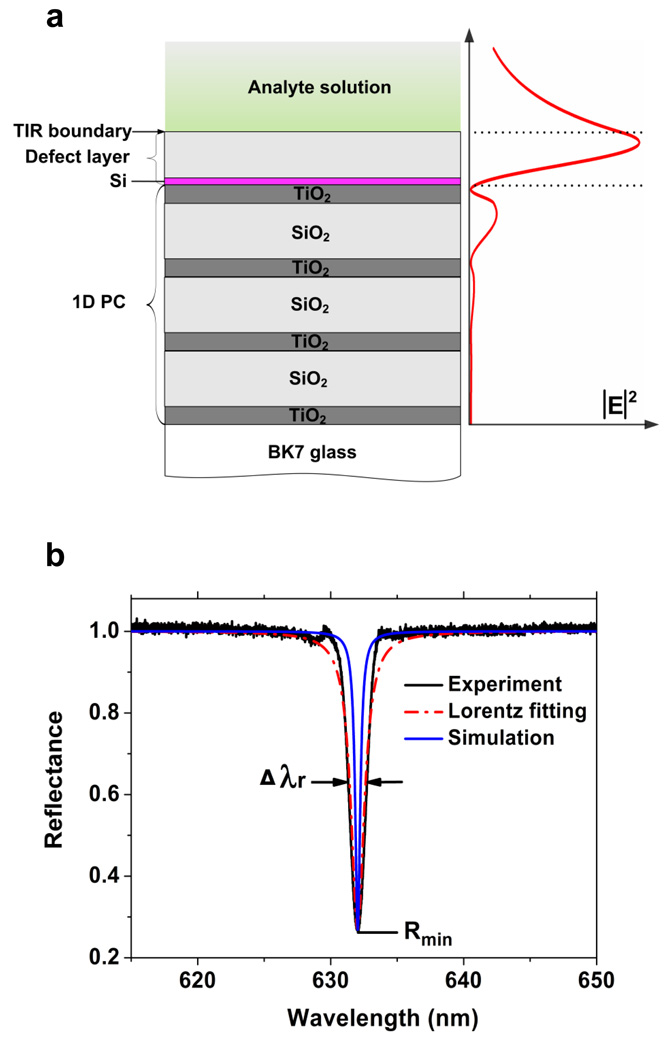
Figure 2a shows the PC-TIR sensor with a layer structure: substrate/H/(L/H)3/X/solvent. The high-index layer H was 107-nm TiO2, and the low-index layer L was 330-nm SiO2. The “defect” layer X was composed of a 6-nm Si thin layer and another 310-nm SiO2 layer on top of the structure. The thicknesses of these layers and the number of the alternating dielectric layers were carefully designed using a transfer matrix method23 to achieve narrow resonance width, small minimum reflectance and large binding sensitivity, all of which were significant factors for the detection sensitivity of the PC-TIR sensor. This sensor can be operated for s- or p- polarized light; the structure in this study was mainly designed for s polarization. All the dielectric layers of the PC-TIR structure were coated by electron-beam physical vapor deposition onto a flat BK-7 glass substrate by Rainbow Research Optics, Inc. (Centennial, CO). The refractive indices (RIs) of the substrate, TiO2, SiO2, Si and de-ionized (DI) water at λ= 632.8 nm, were 1.515, 2.232, 1.451, 2.711 + i0.045, and 1.333, respectively. The RIs at other wavelengths were derived using dispersion data.
Figure 2.
PC-TIR sensor structure and reflectance spectrum. (a) The left part is the schematic structure of the 1-D PC-TIR sensor, and the right shows the electric field distribution when light is resonant with the structure. The dotted lines show the two boundaries of the defect layer. (b) The experimental, Lorentzian fitting, and simulated reflectance spectra of the PC-TIR sensor.
Experimental Setup
We constructed an integrated optical system as reported previously,22 which combined white light spectral measurement and normalized laser intensity measurement. Briefly, for intensity measurements, a collimated s-polarized HeNe laser beam with a wavelength of 632.8 nm was apodized with a 1-mm pinhole to set the size of the probe beam. After that, the laser beam was split into two by a nonpolarized beam splitter, propagating in parallel and hitting two different areas on the surface of the PC-TIR sensor. Using simple optical mounts, the incident angle of these two beams was adjusted until the laser wavelength lied at the steepest portion of the resonance dip. Dual flow channels formed in polydimethylsiloxane (PDMS) were used to isolate the two areas on the sensor surface, so that one area was used for binding of the analytes, while the other contained only flowing buffer to serve as a reference. The intensity of the signal and reference beams were detected with two identical photodiode detectors from Thorlabs (Newton, NJ) and recorded with an 18-bit data acquisition card from National Instruments (Austin, TX). The intensity ratio was obtained by directly normalizing these two reflected intensities of the signal and reference beams at 1-Hz rate. For spectral measurements, a broadband incandescent lamp was used as a white light source. The beam was coupled with an objective lens into a single-mode optical fiber to obtain a good spatial beam profile and was collimated with another objective lens. The collimated white light traveled the same path as the laser beam except that the reflected light was directly detected using a spectrometer (model number iHR 550) from HORIBA Jobin Yvon Inc. (Edison, NJ). These two measurements could be easily switched by moving a mirror, which enabled us to monitor the binding events by measuring the resonance wavelength shift directly with the spectrometer or with high precision using the normalized intensity ratio. The PC-TIR sensor was mounted on a prism (made of BK7 glass) via refractive index matching liquid from Cargille Laboratories (Cedar Grove, NJ) and was stabilized, and the top surface was attached to a microfludics cell with two parallel flow channels made of PDMS; the solutions were introduced by withdrawing syringes through a pump from KD Scientific Inc. (Holliston, MA), and the flow rate could be adjusted over a large range (1 nL/min to 1.00 mL/min).
PC-TIR Sensing Principle
The resonance wavelength of the PC-TIR sensor shifts when some analyte is adsorbed on the sensing surface or the refractive index of the solvent varies, by changing the resonance condition in the defect layer as follows:
| (1) |
Where α represents the Goos Hänchen phase shift, λd is the resonance wavelength, θx, nx, dx are the refraction angle, index, and thickness of the defect layer, respectively. Therefore, by monitoring the resonance shift, we can obtain the solvent index change, the analyte layer’s refractive index, thickness, mass density, or binding affinity constant, etc.
Characterization of PC-TIR Sensor Bulk Refractive Index Sensitivity
The PC-TIR is a refractometric sensor, so it is essential to first characterize its sensitivity to the bulk solvent refractive index change on the sensing surface. As shown in Figure S-2 in the Supporting Information, the PC-TIR sensor was tested by flowing progressively higher concentrations of ethylene glycol solution in DI-water with known refractive indices over the sensing surface (with a rinsing step by DI-water between each new concentration to ensure a clean surface before each measurement). A shift to a longer resonance wavelength in response to an increasing solvent refractive index was observed by both the reflectance spectrum measurement and the real-time normalized intensity measurement, where the first provided a larger detection range and the second achieved much higher detection sensitivity.
Materials
All biochemicals and reagents were purchased from Sigma-Aldrich (except biotinylated proteins) and used as received. DI water (18 MΩ·cm), acetonitrile, morpholinoethanesulfonic acid (MES), and phosphate buffered saline (PBS) (pH ~7.4) were reagents or running buffer. Piranha solution composing of a mixture of sulfuric acid (H2SO4, 98%) and hydrogen peroxide solution (H2O2, 30%) was used to clean and oxidize silica surface. Caution! Piranha solution is extremely corrosive, reactive, and potentially explosive, which should be handled with consideration for safety. (3-Aminopropyl) triethoxysilane (3-APTES) converted an OH-terminated SiO2 surface to an NH2-terminated one. Succinic anhydride further converted amino (−NH2) groups on a silanized silica surface to carboxylic groups (−COOH). A mixture of 1-ethyl-3-(3-dimethylaminopropyl) carbodiimide (EDC) and N-hydroxysuccinimide (NHS) was used to converting carboxylic groups to amine-reactive succinimide esters. Streptavidin (MW ≈ 52 000 Da) has a primary amino group and is a tetrameric protein which can bind up to four biotin (or biotinlyated) molecules. Bovine serum albumin (BSA) was used as the blocking reagent. The free D-biotin (Vitamin H, MW 244 Da) was used for a test of very small molecule binding with streptavidin. Biotinlyated single-strand DNA oligonucleotides with different number of T bases (10T, 20T, and 30T) as well as other oligonucleotides (20A, 20C), were prepared with reverse-phase cartridge (RP1) purification. Biotinylated proteins (Protein A and BSA) were purchased from Vector Laboratories, Inc. (Burlingame, CA). Biotinylated antibody (anti-mouse immunoglobulin G (IgG) produced in goat) and antibody IgG were the largest molecules tested in the study. Detailed information about these biomolecules could be found in Table S-1 in the Supporting Information.
Sensor Response to Analyte Binding
For measuring the ligand-analyte interaction, the analyte binding capacity of the sensing surface depends on the amount of immobilized ligand, or more accurately, the density of available binding sites. The theoretical maximum response Rmax can be calculated using the formula below24
| (2) |
where Manalyte and Mligand are the molecular weights of the analyte and the ligand, respectively; Rads is the sensor response of the ligand adsorbed on the sensing surface; and n is the molar ratio of the binding sites in the ligand (e.g., streptavidin has four biotin-binding sites, so n = 4 for analyte biotin molecules). Obviously, in order to get the large response for binding of biotinylated molecules, the density of free biotin-binding sites on the streptavidin bound to the sensing surface should be large.
Streptavidin Immobilization on Silica Surface
For our first binding measurements, we initially biotinylated the surface and subsequently immobilized streptavidin18 (see Method S-1 in the Supporting Information). However, this approach severely limited the number of available biotin binding sites on the streptavidin molecules as many were tied up by the surface binding (Figure S-3, Supporting Information). To maximize the available biotin-binding sites on the streptavidin bound to the sensing surface (and therefore increase the sensitivity of the sensor), we employed a second method in which streptavidin was coupled to the silica sensing surface covalently through primary amino groups (−NH2).25 The surface treatment was as follows: First, the silica sensing surface was cleaned and oxidized by piranha solution (95% H2SO4 : 30% H2O2 = 3:1) for 10 min; then, it was silanized with 3% 3-APTES solution in methanol/water (1:1) for 20 min. Next, 0.2 M succinic anhydride solution in acetonitrile was slowly flowed (5 μL/min) over the surface for a long time (more than 12 h), and then, fresh 0.4 M EDC and 0.1 M NHS solutions in DI-water were mixed (1:1) and used to activate the surface for a certain time (normally 15 min); finally, 25 μg/mL streptavidin solution was flowed until saturation. After that, a 500-μg/mL high concentration BSA solution in PBS was flowed for sufficient time to block nonspecific binding sites on the surface and produce a stable baseline.
Control Experiments to Check Nonspecific Binding of Biotin Molecules
To quantify the specific binding between biotinylated molecules and streptavidin, it is crucial to check the nonspecific binding between the biotin molecules and the sensing surface. Independent control experiments were performed, where all the surface functionalization procedures were the same as the section above except that streptavidin was replaced by BSA.
Real-Time, Label-Free Detection of Biotin Molecules Binding
After streptavidin was covalently attached to the sensing surface, the biotin-analyte solution was directed through a flow channel to the sensor surface to evaluate the specific interaction between biotin and streptavidin. Before the injection, PBS buffer was flowed over the sensing surface for sufficient time to obtain a stable baseline. This was followed by the biotinylated analyte solution in PBS, which was introduced onto the sensor surface at a rate of 50 μL/min. After equilibrium was achieved, PBS buffer was again used to remove unbound or weakly attached analyte until a new, stable baseline was achieved. The difference between the final baseline and the initial baseline was the amount of the resonance wavelength shift caused by biotin molecules bound to the sensing surface, and the result was compared to an independently performed control experiment. The sensor response to the specific binding between the biotin and the streptavidin was related to the size (molecular weight) of the biotin molecule, the immobilized amount of streptavidin on the sensing surface, and the biotin binding sites occupied by the biotin molecule.
RESULTS AND DISCUSSION
PC-TIR Sensor Reflectance Spectrum and Sensitivity
We prepared the PC-TIR sensor and measured its reflectance spectrum. The white light was incident on the sensor through a coupling prism with an incident angle in the substrate (62.72°) chosen for total internal reflection at the top interface between the higher-index SiO2 layer and the lower-index DI water. An effective Fabry-Pérot resonator was formed in the defect layer by the high-reflecting PC structure and the TIR boundary. For light resonant with the cavity mode, the optical field was greatly enhanced near the top surface of the defect layer (Figure 2a); light outside the resonance mode was reflected from the PC layers and had a reduced field amplitude at the surface. To generate an observable resonance in the PC-TIR reflectance, we employed an energy loss mechanism22 and incorporated a small, controlled amount of absorption (Si layer) in the defect layer as shown above. Only light resonant with the microcavity mode was highly absorbed in this layer, thus the reflectance spectrum of the total PC-TIR structure showed a pronounced dip corresponding to the photonic defect state.
As Figure 2b shows, the reflectance dip is in reasonable agreement with a simulation using a transfer matrix calculation; it has a resonance wavelength λr of 632.80 nm, a width Δλr of 1.23 nm, and a small minimum reflectance Rmin of 0.27. Although the resonance width is slightly larger than the simulated value of 0.60 because of nonuniformity of the deposited thin films and the nonzero divergence of the probe beam, it is much narrower than that of a typical SPR resonance and allows more sensitive detection of resonance shifts. Moreover, the reflectance spectrum near the resonance can be fit reasonably well by a Lorentzian line shape, similar to a Fabry-Pérot mode. In addition, by adjusting the incidence angle, we can tune the resonance mode to the desired wavelength. For the experiments reported here, the incidence angle was adjusted to shift the steepest portion of the resonance dip to the HeNe laser line at 632.80 nm.
The high sensitivity of the PC-TIR sensor was demonstrated with measuring the bulk solvent refractive index change. With a much narrower resonance dip, the sensor still had a high sensitivity up to 1840 nm/RIU obtained by directly measuring the reflectance spectrum shift (Figure S-2a, Supporting Information), close to that of SPR sensors. Further, real-time measurements showed that much higher sensitivity was achieved by normalizing the reflected laser intensity with a detection limit determined to be 1×10⁻⁸ RIU (Figure S-2b, Supporting Information), over 2 orders of magnitude higher than conventional SPR sensors (~10−6 RIU).
PC-TIR Sensor Detection of Biotin Molecules Binding
The molecular pair of streptavidin-biotin has an extremely high binding affinity (Kd ~ 10−15 M) and serves as an excellent model for biomolecular recognition. In order to test the sensitivity of the PC-TIR sensor to different sizes and types of molecules, we measured a series of biotinylated molecules (or free D-biotin alone) binding to streptavidin chemically coupled to the sensing surface. Binding of D-Biotin, biotinylated DNA oligonucleotides 10T, 20T, and 30T (biotin-10T, biotin-20T, and biotin-30T), biotinylated Protein A (biotin-Protein A), biotinylated BSA (biotin-BSA), and biotinylated IgG (biotin-IgG) showed the ability of this system to measure the binding of a wide range of different molecular weight molecules with high affinity interactions.
Streptavidin was immobilized on the silica sensing surface by covalent coupling as discussed above. Through buffer and pH scouting, we determined that a 100-mM morpholinoethanesulfonic acid (MES) buffer at pH 5.0 provided the maximum streptavidin adsorption on the sensing surface, which caused 5.04-nm resonance wavelength shift (Figure S-4, Supporting Information). This represented an effective 4.38-nm layer thickness calculated from the transfer matrix simulation, assuming streptavidin had the same refractive index as silica.
After streptavidin was covalently attached to the sensing surface, the biotin-analyte solution was flowed over the sensor surface to evaluate the specific interaction between biotin and streptavidin. The results of independent control experiments showed that there was no detectable nonspecific binding between the biotin molecules and the sensing surface (Figure S-5, Supporting Information).
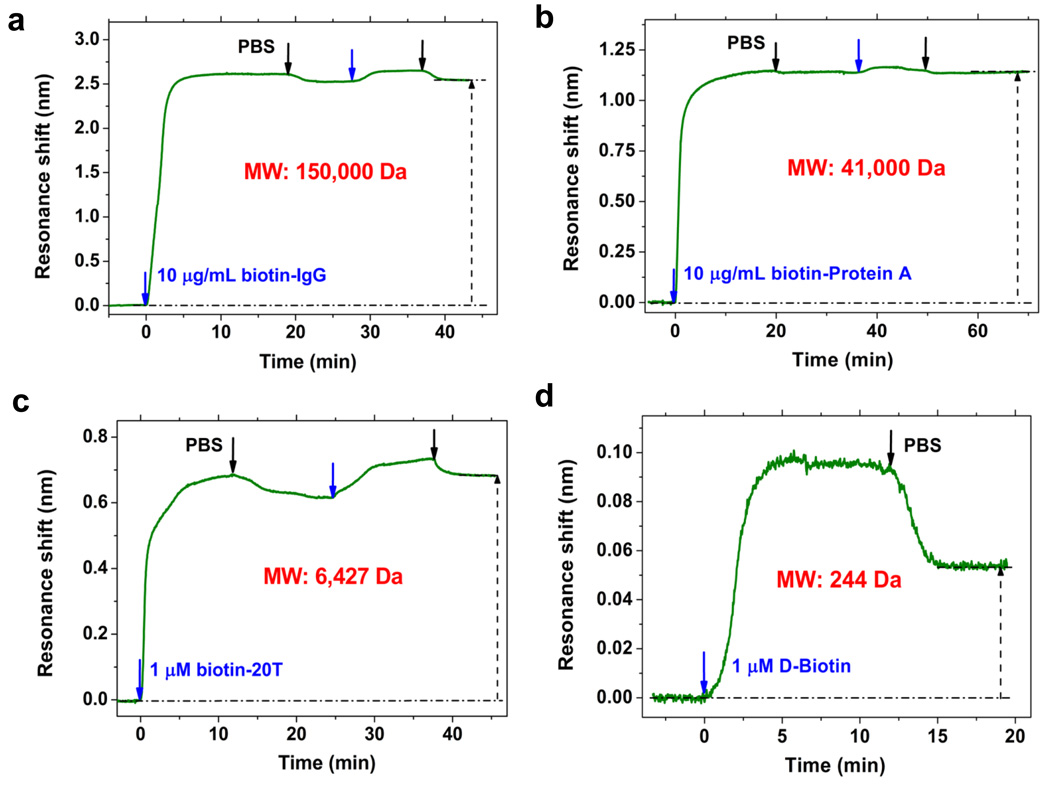
We first analyzed the binding of the largest molecule biotin-IgG (MW ≈ 150 000 Da) determined by flowing a 10 μg/mL solution in PBS twice until the streptavidin-adsorbed surface appeared saturated (Figure 3a). A second biotin-IgG injection showed no further specific binding and demonstrated only small resonance shift because of a bulk solvent refractive index effect. Given that there was no observable nonspecific binding between biotin-IgG and the sensing surface, we concluded that the final 2.54-nm resonance shift was entirely due to specific binding between biotin-IgG and streptavidin. Comparing this data to the results of biotinylated IgG binding to streptavidin immobilized on the silica sensing surface using biotin (Figure S-3, Supporting Information) confirmed that the covalent binding method provided many more available sites for biotin binding.
Figure 3.
Detections of biotin molecules binding by PC-TIR sensor. Real-time biotin molecules binding to streptavidin-adsorbed sensing surface monitored by the PC-TIR sensor. The binding shifts of biotin-IgG, biotin-Protein A, biotin-20T and D-biotin are 2.54, 1.14, 0.68, and 0.053 nm, with the corresponding streptavidin adsorption shifts of 3.45, 2.36, 2.52, and 3.00 nm, respectively. The blue arrow stands for the starting point of injecting analyte solution, and the black arrow for injecting PBS buffer (same for all the following figures).
The covalent streptavidin immobilization method also enhanced the PC-TIR sensor’s capability to detect smaller molecules. This was demonstrated using biotin-Protein A (MW ≈ 41 000 Da) and biotin-20T (MW 6,427 Da). Both of these molecules demonstrated large binding shifts of 1.14 nm and 0.68 nm (Figure 3b and c). Furthermore, binding of D-biotin (MW 244 Da) was evaluated to determine the minimum molecular weight detection limit of the PC-TIR sensor. In this experiment, the immobilization of streptavidin produced a 3.0-nm optical resonance shift. According to eq 2, the maximum theoretical response of D-biotin binding to streptavidin was 0.056 nm, if all the biotin-binding sites in streptavidin (4 per molecule) on the sensing surface were occupied. When 1 μM D-Biotin solution in PBS was flowed over the streptavidin sensing surface, the binding resonance wavelength shift was determined to be 0.053 nm (Figure 3d), which was very close to the maximum theoretical result. Since there was no observable nonspecific binding between D-Biotin and the functionalized surface, this implied that almost all four biotin-binding sites in the streptavidin were occupied by D-Biotin. Taking into account the resolution the current system could achieve, i.e. 1.6×10⁻⁵ nm, the signal to noise ratio for detecting 1 μM D-Biotin was up to 3300, which indicated the great potential of the PC-TIR sensor for the detection of small analytes such as drug compounds, vitamins, hormones, etc.
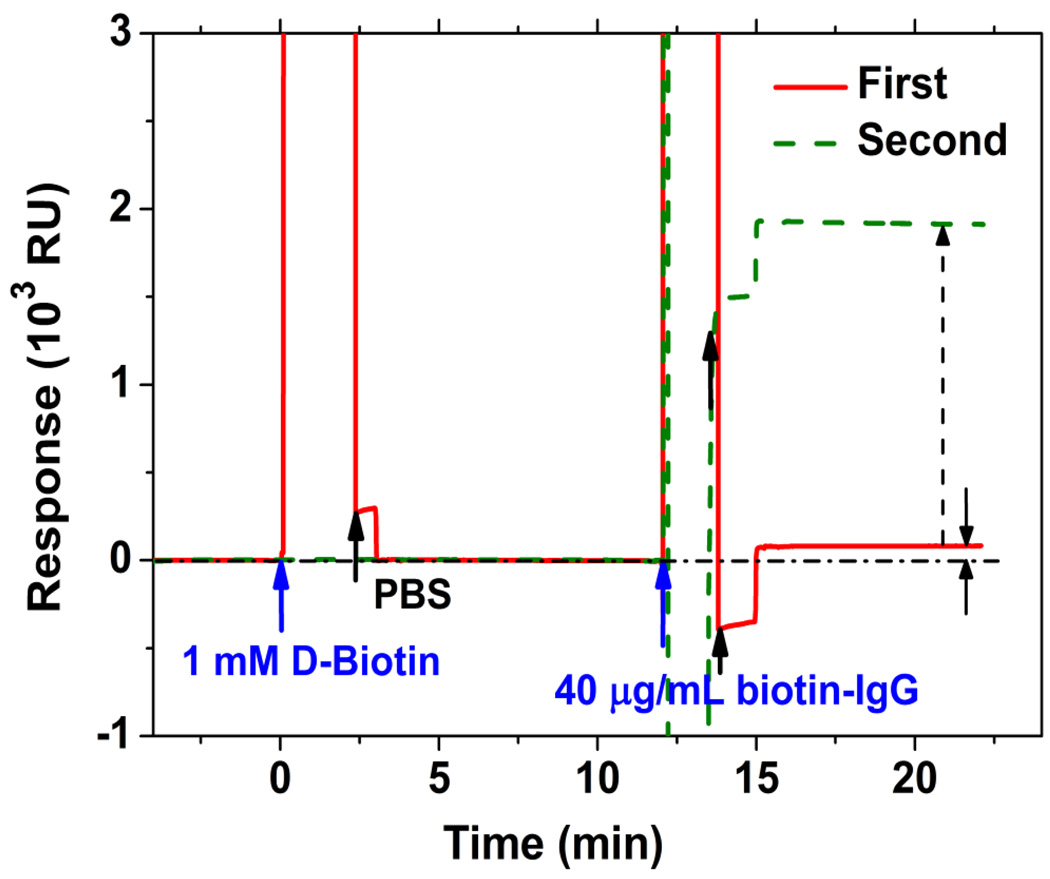
To obtain a direct comparison of the PC-TIR sensor with standard SPR-based measurements, we used a commercial SPR system (Biacore X) to measure D-biotin binding to an SA chip (streptavidin-coated sensing chip) having a high surface density 400–600 ng/cm2 and all four biotin binding sites of the immobilized SA molecules available.26 As Figure 4 shows, 1 mM D-biotin solution in PBS (a concentration was 1000 times larger than that used with our PC-TIR sensor), was first flowed over the SA chip, and no detectable binding was observed. After continuous flowing of 40 μg/mL biotin-IgG solution in PBS over three minutes, an insignificant 85 resonance units (RU) of binding was observed, which was much less than the 1915 RU response obtained by directly flowing the same concentration biotin-IgG solution over a new SA chip. Thus, the D-biotin did bind to the SA chip, but the Biacore X did not have the sensitivity to resolve it. In contrast, the PC-TIR sensor could easily resolve small-molecule binding with high SNR.
Figure 4.
Detections of biotin molecules binding by SPR-based system Biacore X.
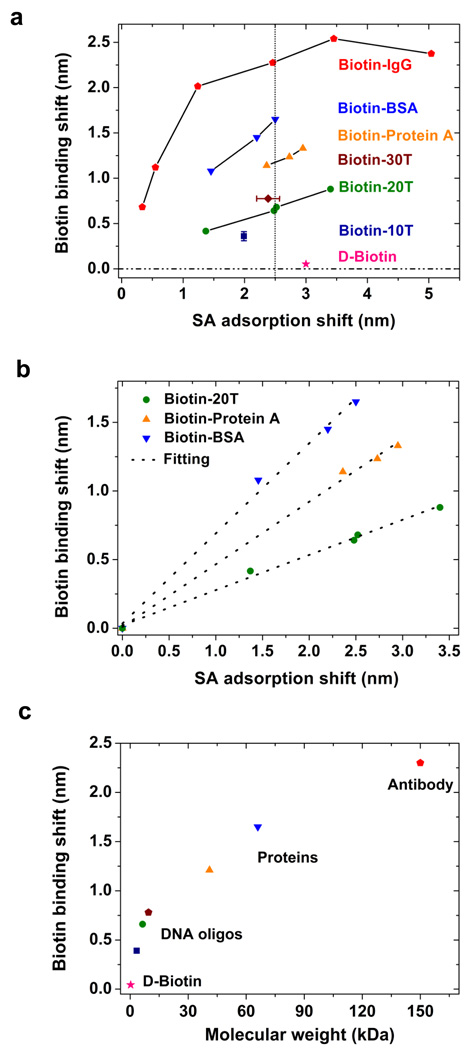
We also evaluated the streptavidin adsorption (i.e., the amount of streptavidin adsorbed on the sensing surface) required to optimize biotin-binding measurements (Figure 5a). Normally the analyte binding response is linearly related to the density of immobilized binding sites, but different sizes of biotinylated molecules may behave differently, especially since the number of biotins per molecule varies. For D-biotin the binding response showed that each streptavidin molecule was bound with almost four biotin molecules. For larger size molecules (biotin-20T, biotin-Protein A and biotin-BSA), the wavelength shift was linearly proportional to the SA surface adsorption (Figure 5b), with the slopes 0.25 ± 0.01, 0.45 ± 0.02, and 0.66 ± 0.04. This indicated that each streptavidin molecule was bound with approximately 2.0 biotin-20T, 0.6 biotin-Protein A, and 0.5 biotin-BSA molecules, respectively. The lower binding ratios observed with larger size molecules could be the result of two possible factors: one was a crowding effect, where larger molecules had difficulty accessing all of the biotin-binding sites; the other was that larger biotinylated molecules (biotin-Protein A and biotin-BSA) had several conjugated biotins (Table S-1), thereby occupying more than one biotin binding sites in streptavidin, which decreased their binding ratios to streptavidin. In addition, the largest molecule (biotin-IgG) demonstrated a binding shift that was almost linear when the SA adsorption was small (below 1.50-nm shift); however, as the adsorption became larger, the biotin-IgG binding saturated and eventually decreased (Figure 5a). This could be explained by a pro-zone effect, where crowding the streptavidin sensing surface prevented additional large molecules from accessing biotin-binding sites.27 When the binding behavior of different size biotin molecules was further at the optimized streptavidin sensing surface concentration (2.50-nm adsorption shift), this PC-TIR sensor performed well and was able to distinguish a wide range of biological molecules, whose response (resonance wavelength shift) was increasing with larger molecule weights (Figure 5c).
Figure 5.
Relationship between biotin binding shift and molecule sizes and/or streptavidin surface adsorption. (a) Response of PC-TIR sensor (resonance wavelength shift) to the binding of different size biotin molecules with different streptavidin adsorption on the sensing surface. (b) Experimental results and linear regression for biotin-BSA, biotin-Protein A and biotin-20T binding to streptavidin-adsorbed sensing surface, respectively. (c) The biotin binding shifts dependence on molecule sizes for the same streptavidin adsorption (2.50-nm shift) on the sensing surface. Each symbol represents one molecule, and the binding shifts for smaller molecules (like biotin-Protein A, biotin-10T and D-biotin) are reasonably derived by linearly relation from the experimental results shown in (a).
Analysis of Low Mass Molecular Binding Events
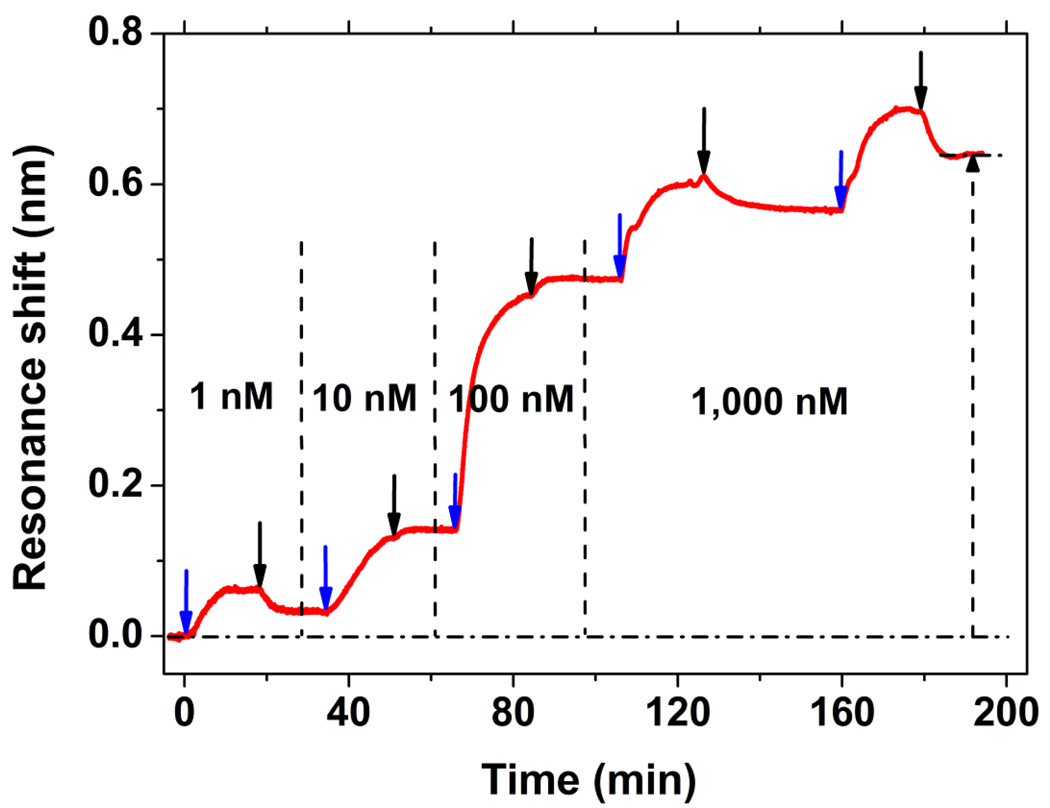
We investigated the ability of the PC-TIR sensor to detect short DNA oligonucleotide binding to protein at low concentrations. As Figure 6 shows, a series of four concentrations (1 nM, 10 nM, 100 nM, and 1 μM) of biotin-20T solution in PBS were flowed over the streptavidin-adsorbed sensing surface, which caused resonance wavelength shifts of 0.033 nm, 0.108 nm, 0.334 nm, and 0.166 nm, respectively. The accumulated shift increased monotonically as more and more biotin-20T molecules became tightly bound to the streptavidin until saturation. The overall resonance shift 0.641 nm was close to the prior result (Figure 3c), confirming the PC-TIR sensor’s reproducibility. Moreover, the lowest injected solution (1-nM biotin-20T) produced a 0.033-nm shift, with a signal-to-noise up to 2000, which indicated that the PC-TIR sensor was able to detect low mass adsorption on the surface with a very high sensitivity.
Figure 6.
Sensorgram of low concentrations biotinylated DNA oligonucleotides (biotin-20T) binding. The streptavidin adsorption shift is 2.480 nm, and the binding shifts of 1-, 10-, 100-, and 1000-nM solutions are 0.033, 0.108, 0.334, and 0.166 nm, respectively.
Detection of Multilayered Biomolecular Interactions
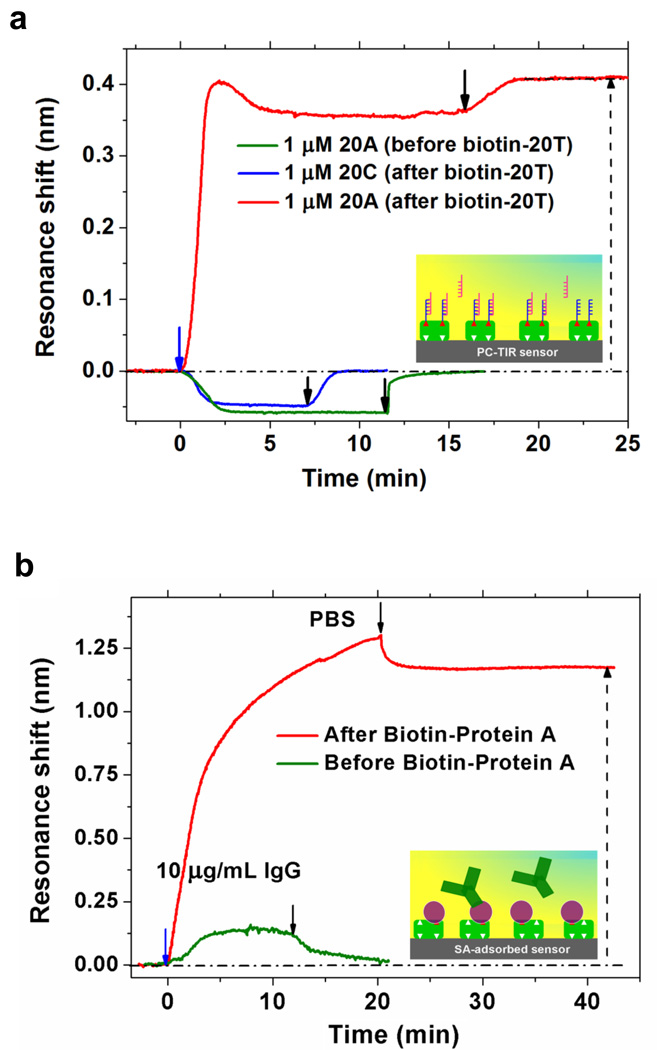
We also demonstrated the capability of the PC-TIR sensor to detect multiple biomolecular interactions (cascade sensing).28 We identified the binding of different base-mismatched DNA oligonucleotides (20A, 20C) hybridizing to biotinylated 20T that had been bound on the SA-adsorbed sensor surface as described above. As shown in Figure 7 (a), a control experiment in which the complementary oligonucleotide 20A was flowed before biotin-20T binding did not display any perceptible shift, while a very large specific binding (0.41-nm shift) was observed for totally matched 20A after biotin-20T was bound on the surface, and the high hybridization efficiency was calculated to be 96%. In contrast, the completely mismatched oligonucleotide 20C displayed no observable binding to the sensing surface.
Figure 7.
Detections of multilayered biomolecular interactions using the PC-TIR sensor. (a) Oligonucleotides base-mismatched detection. The shifts of streptavidin adsorption, biotinylated 20T specific binding and 20A hybridization are 1.45 nm, 0.44 nm, and 0.41 nm, respectively. (b) Multilayered biomolecular interactions between streptavidin, biotinylated Protein A and IgG. The response of the PC-TIR sensor for streptavidin adsorption, biotinylated Protein A binding and IgG binding are 2.95-nm, 1.33-nm, and 1.18-nm resonance shifts, respectively. Inset diagrams show the schematic of the interactions.
Finally, we tested the multilayered binding of streptavidin to biotinylated Protein A, followed by the binding of (nonbiotinylated) goat IgG to protein A, where Protein A binds approximately 25% of the goat IgG subclasses. 10 μg/mL of IgG solution was flowed before and after Protein-A binding to SA-adsorbed sensing surface (Figure 7b). The results showed no observable binding of IgG to the sensing surface, but a large specific interaction between IgG and Protein A. Considering their molecular weights (150 000 Da for IgG and 41 000 Da for Protein A) and amount of biomolecules bound on the sensing surface (1.18-nm and 1.33-nm shifts for IgG and Protein A, respectively), we calculated the binding activity of the Protein A for goat IgG to be 24%, very close to the ideal condition.
CONCLUSION
We have developed a novel optical biosensor based on a one-dimensional photonic crystal structure in a total-internal-reflection geometry. This device incorporates an open sensing surface, controllable Q, and a tunable operation wavelength, together with normalized intensity measurement, to create a unique, highly sensitive optical sensor for biological and chemical research. We measured the binding of a wide range of molecules (molecular weight from 244 to 150 000 Da) with a very high sensitivity. Moreover, we demonstrate that this sensor is useful for detecting the binding of molecules with low mass, and can detect multilayered molecular interactions. It is also important to mention that this sensor allows us to monitor biomolecular interactions in real time and hence resolve kinetic constants.
Further improvements are expected to yield even higher sensitivity; for example, a nanostructured sensing surface could greatly increase the sensing area and give access to a size selectivity option for biomolecular analytes, although, at the expense of a complicated fabrication and long diffusion time.10,29 Additionally, combining the PC-TIR sensor with molecular identification methods, such as mass spectrometry30 and Raman scattering,31 would provide comprehensive information on non-covalent, low affinity biomolecular interactions.
Supplementary Material
ACKNOWLEDGMENT
This project has been funded in whole or in part with Federal funds from the National Cancer Institute, National Institutes of Health, under award 1 R21 RR021893.
Footnotes
SUPPLEMENTARY INFORMATION
Additional information as noted in text. This material is available free of charge via the Internet at http://pubs.acs.org.
REFERENCES
- 1.Wells JA, McClendon CL. Nature. 2007;450:1001–1009. doi: 10.1038/nature06526. [DOI] [PubMed] [Google Scholar]
- 2.Arkin MR, Wells JA. Nat. Rev. Drug Discov. 2004;3:301–317. doi: 10.1038/nrd1343. [DOI] [PubMed] [Google Scholar]
- 3.Cooper MA. Nat. Rev. Drug Discov. 2002;1:515–528. doi: 10.1038/nrd838. [DOI] [PubMed] [Google Scholar]
- 4.Elf J, Li GW, Xie XS. Science. 2007;316:1191–1194. doi: 10.1126/science.1141967. [DOI] [PMC free article] [PubMed] [Google Scholar]
- 5.Fan X, White IM, Shopova SI, Zhu H, Suter JD, Sun Y. Anal. Chim. Acta. 2008;620:8–26. doi: 10.1016/j.aca.2008.05.022. [DOI] [PMC free article] [PubMed] [Google Scholar]
- 6.Rich RL, Myszka DG. J. Mol. Recognit. 2008;21:355–400. doi: 10.1002/jmr.928. [DOI] [PubMed] [Google Scholar]
- 7.Bornhop DJ, Latham JC, Kussrow A, Markov DA, Jones RD, Sorensen HS. Science. 2007;317:1732–1736. doi: 10.1126/science.1146559. [DOI] [PubMed] [Google Scholar]
- 8.Blanco FJ, Agirregabiria M, Berganzo J, Mayora K, Elizalde J, Calle A, Dominguez C, Lechuga LM. J. Micromech. Microeng. 2006;16:1006–1016. [Google Scholar]
- 9.Homola J. Anal. Bioanal. Chem. 2003;377:528–539. doi: 10.1007/s00216-003-2101-0. [DOI] [PubMed] [Google Scholar]
- 10.Kabashin AV, Evans P, Pastkovsky S, Hendren W, Wurtz GA, Atkinson R, Pollard R, Podolskiy VA, Zayats AV. Nat. Mater. 2009;8:867–871. doi: 10.1038/nmat2546. [DOI] [PubMed] [Google Scholar]
- 11.Wang WU, Chen C, Lin KH, Fang Y, Lieber CM. Proc. Natl. Acad. Sci. 2005;102:3208–3212. doi: 10.1073/pnas.0406368102. [DOI] [PMC free article] [PubMed] [Google Scholar]
- 12.Fang Y, Ferrie AM, Fontaine NH, Mauro J, Balakrishnan J. Biophys. J. 2006;91:1925–1940. doi: 10.1529/biophysj.105.077818. [DOI] [PMC free article] [PubMed] [Google Scholar]
- 13.Challener WA, Edwards JD, McGowan RW, Skorjanec J, Yang Z. Sensor Actuat. B-Chem. 2000;71:42–46. [Google Scholar]
- 14.Armani AM, Kulkarni RP, Fraser SE, Flagan RC, Vahala KJ. Science. 2007;317:783–787. doi: 10.1126/science.1145002. [DOI] [PubMed] [Google Scholar]
- 15.Vollmer F, Arnold S. Nat. Meth. 2008;5:591–596. doi: 10.1038/nmeth.1221. [DOI] [PubMed] [Google Scholar]
- 16.Lin B, Qiu J, Gerstenmeier J, Li P, Pien H, Pepper J, Cunningham B. Biosens. Bioelectron. 2002;17:827–834. doi: 10.1016/s0956-5663(02)00077-5. [DOI] [PubMed] [Google Scholar]
- 17.Lee MR, Fauchet PM. Opt. Express. 2007;15:4530–4535. doi: 10.1364/oe.15.004530. [DOI] [PubMed] [Google Scholar]
- 18.Konopsky VN, Alieva EV. Anal. Chem. 2007;79:4729–4735. doi: 10.1021/ac070275y. [DOI] [PubMed] [Google Scholar]
- 19.Myszka DG. Anal. Biochem. 2004;329:316–323. doi: 10.1016/j.ab.2004.03.028. [DOI] [PubMed] [Google Scholar]
- 20.White IM, Fan X. Opt. Express. 2008;16:1020–1028. doi: 10.1364/oe.16.001020. [DOI] [PMC free article] [PubMed] [Google Scholar]
- 21.Ilchenko VS, Gorodetskii ML. Laser Phys. 1992;2:1004–1009. [Google Scholar]
- 22.Guo Y, Divin C, Myc A, Terry FL, Baker JR, Norris TB, Ye JY. Opt. Express. 2008;16:11741–11749. doi: 10.1364/oe.16.011741. [DOI] [PMC free article] [PubMed] [Google Scholar]
- 23.Muriel MA, Carballar A, Azaña J. IEEE J. Quantum Electron. 1999;35:548–558. [Google Scholar]
- 24.Biacore 3000 getting started. Uppsala, Sweden: Biacore AB; 2003. [Google Scholar]
- 25.Schiestel T, Brunner H, Trovar GEM. J. Nanosci. Nanotech. 2004;4:504–511. doi: 10.1166/jnn.2004.079. [DOI] [PubMed] [Google Scholar]
- 26.Yang N, Su X, Tjong V, Knoll W. Biosens. Bioelectron. 2007;22:2700–2706. doi: 10.1016/j.bios.2006.11.012. [DOI] [PubMed] [Google Scholar]
- 27.Jung LS, Nelson KE, Stayton PS, Campbell CT. Langmuir. 2000;16:9421–9432. [Google Scholar]
- 28.Lin VSY, Motesharei K, Dancil KPS, Sailor MJ, Ghadiri MR. Science. 1997;278:840–843. doi: 10.1126/science.278.5339.840. [DOI] [PubMed] [Google Scholar]
- 29.Orosco MM, Pacholski C, Sailor MJ. Nat. Biotechnol. 2009;4:255–258. doi: 10.1038/nnano.2009.11. [DOI] [PMC free article] [PubMed] [Google Scholar]
- 30.Madeira A, Öhman E, Nilsson A, Sjögren B, Andrén PE, Svenningsson P. Nat. Protoc. 2009;4:1023–1037. doi: 10.1038/nprot.2009.84. [DOI] [PubMed] [Google Scholar]
- 31.Freudiger CW, Min W, Saar BG, Lu S, Holtom GR, He C, Tsai JC, Kang JX, Xie XS. Science. 2008;322 doi: 10.1126/science.1165758. 1857-186. [DOI] [PMC free article] [PubMed] [Google Scholar]
Associated Data
This section collects any data citations, data availability statements, or supplementary materials included in this article.


