Abstract
Purpose: The clinical efficacy of breast elastography may be limited when the authors employ the assumption that soft tissues exhibit linear, frequency-independent isotropic mechanical properties during the recovery of shear modulus. Thus, the purpose of this research was to evaluate the degradation in performance incurred when linear-elastic MR reconstruction methods are applied to phantoms that are fabricated using viscoelastic materials.
Methods: To develop phantoms with frequency-dependent mechanical properties, the authors measured the complex modulus of two groups of cylindrical-shaped gelatin samples over a wide frequency range (up to 1 kHz) with the established principles of time-temperature superposition (TTS). In one group of samples, the authors added varying amounts of agar (1%–4%); in the other group, the authors added varying amounts of sucrose (2.5%–20%). To study how viscosity affected the performance of the linear-elastic reconstruction method, the authors constructed an elastically heterogeneous MR phantom to simulate the case where small viscoelastic lesions were surrounded by relatively nonviscous breast tissue. The breast phantom contained four linear, viscoelastic spherical inclusions (10 mm diameter) that were embedded in normal gelatin. The authors imaged the breast phantom with a clinical prototype of a MRE system and recovered the shear-modulus distribution using the overlapping-subzone-linear-elastic image-reconstruction method. The authors compared the recovered shear modulus to that measured using the TTS method.
Results: The authors demonstrated that viscoelastic phantoms could be fabricated by including sucrose in the gelation process and that small viscoelastic inclusions were visible in MR elastograms recovered using a linear-elastic MR reconstruction process; however, artifacts that degraded contrast and spatial resolution were more prominent in highly viscoelastic inclusions. The authors also established that the accuracy of the MR elastograms depended on the degree of viscosity that the inclusion exhibited.
Conclusions: The results demonstrated that reconstructing shear modulus from other constitutive laws, such as viscosity, should improve both the accuracy and quality of MR elastograms of the breast.
Keywords: breast imaging, magnetic resonance elastography, mechanical testing, mechanical properties, phantoms, time-temperature superposition
INTRODUCTION
Neither x-ray mammography nor breast self-examination (SE) can accurately diagnose all breast cancers in young women. In the United States, breast cancer kills nearly 50 000 women annually and in 2006, there were more than 200 000 new cases of the disease.1 Screening mammography detects cancer with high sensitivity and specificity, but it performs poorly in women with dense breast tissue, which is typical of many younger women (less than 50 yr of age). Younger women usually detect breast cancer themselves during SE, but self examination (SE) cannot discern subtle changes that occur in the breast during the early stages of neoplastic development; consequently, SE frequently detects tumors that are late-stage, metastatic, and treatable only by employing the most aggressive therapies.2
Magnetic resonance elastography (MRE)3, 4, 5, 6, 7 could improve the early detection of breast cancer in younger women, but MRE may perform suboptimally in the clinic because shear-modulus images are typically reconstructed from simplistic assumptions about the mechanical behavior of breast tissues. Shear modulus can be recovered from MR-measured internal tissue displacements via either a direct or an iterative inversion scheme.6, 8, 9, 10, 11, 12, 13 The direct approach is appealing because it is linear, efficient, and can be localized by assuming piecewise homogeneity in the mechanical properties. However, the direct approach to image reconstruction can be sensitive to measurement noise. The iterative inversion approach is generally more robust to measurement noise, but it requires more computational overhead to solve the three-dimensional inverse elastography problem on a highly resolved, finite-element mesh (i.e., N≥104, where N is the number of nodes). Despite these differences, in both approaches, soft tissues are assumed to exhibit linear isotropic frequency-independent elastic behavior, which is certainly an approximation in breast tissues8 and could reduce the quality and accuracy of the clinical MR elastograms.
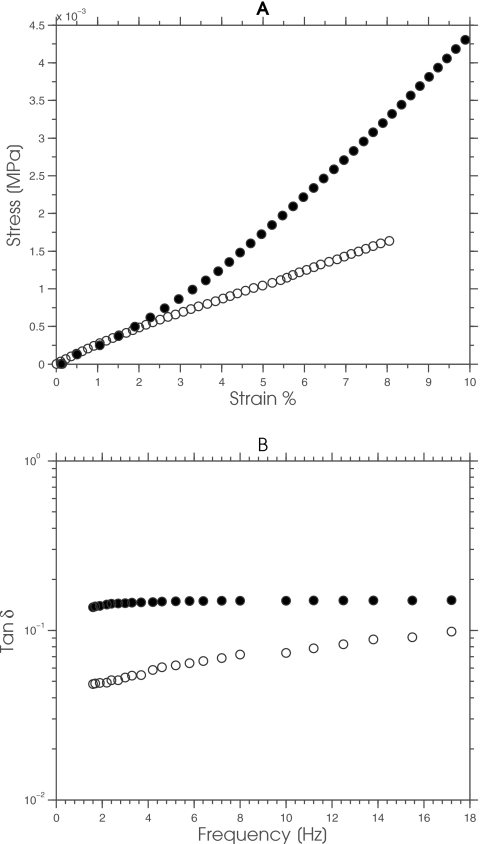
To characterize and optimize the performance of MRE objectively, we need fabrication methods for constructing test objects that display the range of complex mechanical behavior observed in soft tissues. We frequently use phantoms to characterize and optimize the performance of diagnostic imaging systems, including elastography. Consequently, several groups, including our own, have described methods for fabricating phantoms from gelatin and∕or agar gels with realistic imaging (i.e., acoustic and MR relaxation times) and shear-modulus properties.9, 10, 11, 12, 13 Gelatin displays a linearly elastic response, with relatively low viscosity and frequency dependency, while agar displays a slightly nonlinear-elastic signature that is more viscous (see Fig. 1). The gelatin response implies that studies with gelatin phantoms may yield excessively optimistic results, since the mechanical behavior of gelatin is more consistent with the assumptions made during linear-elastic image reconstruction than those presented by soft tissues. Conversely, performance studies conducted with agar phantoms should yield more representative results, albeit that the phantom will be more fragile and the degree of nonlinearity and viscosity may be less than those observed in soft tissues.
Figure 1.
(a) The static and (b) dynamic mechanical behavior of a typical gelatin (open circles) and agar (solid circles) sample.
The goal of this study was to corroborate the hypothesis that MR elastograms will perform suboptimally when the shear modulus of viscoelastic tissues is reconstructed using a linear-elastic image-reconstruction process. To simplify the discussion, we focused on a specific goal: To assess the ability of the linear-elastic reconstruction method to recover the shear-modulus distribution of small viscoelastic spherical inclusions that were embedded in a nonviscous background in a phantom that we designed specifically for this study.
To facilitate this investigation, i.e., to select suitable materials for fabricating linear-elastic viscoelastic gelatin-based phantoms, we doped gelatin with either sucrose or agar and studied the resulting impact on the dynamic mechanical behavior of the gelatin. The rationale was to select suitable materials for fabricating linear, elastic, viscoelastic gelatin-based phantoms. Specifically, we measured the dynamic mechanical behavior of two groups of gelatin samples at frequencies currently employed in MRE (1–1000 Hz) using the established principle of time-temperature superposition (TTS). One group of gelatin samples contained varying amounts of agar and the other group was manufactured from gelatin and varying amounts of sucrose. Based on the results of these simple mechanical tests, we constructed a 10 cm (height) by 4 cm (width) cylindrical phantom that contained four 10 mm diameter viscoelastic inclusions. We used the clinical prototype system of MR elastography described in Ref. 7 to image the elasticity phantom and reconstructed all modulus elastograms using the linear-elastic shear-modulus recovery process described in Refs. 10, 14. We assessed the performance of the resulting images using two metrics: (1) We measured accuracy by comparing the mean shear modulus recovered from the surrounding gel and the spherical inclusions, relative to that which was measured independently using the time-temperature superposition; and (2) we measured the quality of the recovered elastograms by employing the elastographic contrast-to-noise ratio (CNRe) performance metric.
MATERIALS AND METHODS
Initial mechanical testing and MR measurements
To manufacture linear-viscoelastic phantoms (in this case, with inclusions), we studied the individual effect of agar and sucrose on the dynamic mechanical and MR properties of gelatin. Specifically, we measured the complex modulus of gelatin samples that contained different amounts of agar and sucrose over the frequency range used in MR elastography (up to 1 kHz) and their MR properties (i.e., their T1 and T2 relaxation times).
Preparation of samples
We manufactured two groups of cylindrical-shaped samples (7 mm height×37 mm diameter) in a controlled and repeatable manner from Type A porcine skin gelatin (300 bloom, Sigma-Aldrich, St. Louis, MO); ultra-high-purity water (18 M); agar (Sigma-Aldrich, St. Louis, MO); and sucrose (Sigma-Aldrich, St. Louis, MO). Table 1 gives the proportion of each material that we used to fabricate the samples within each group. For convenience, we modified the sample-preparation method described in Ref. 10, i.e., we prepared gelatin-sucrose samples from a stock solution of solution of 40% sucrose rather than adding the desired proportion of sucrose directly to the gelatin solution.
Table 1.
Proportion of materials used to fabricate gelatin samples.
| Group number | Batch number | Gelatin (%) | Agar (%) | Sucrose (%) | 18 MΩ water (%) |
|---|---|---|---|---|---|
| 1 | 1 | 15 | 0 | 0 | 85 |
| 1 | 2 | 15 | 1 | 0 | 84 |
| 1 | 3 | 15 | 2 | 0 | 83 |
| 1 | 4 | 15 | 3 | 0 | 82 |
| 1 | 5 | 15 | 4 | 0 | 81 |
| 2 | 6 | 15 | 0 | 2.5 | 85 |
| 2 | 7 | 15 | 0 | 5 | 85 |
| 2 | 8 | 15 | 0 | 10 | 85 |
| 2 | 9 | 15 | 0 | 20 | 85 |
Independent mechanical testing
We measured the mechanical properties of all samples using the principle of TTS,15, 16 which states that the complex modulus of a viscoelastic material, measured over a short time scale at a given temperature, is related to the properties measured over a longer time scale at a lower temperature, although the measured properties will be shifted logarithmically in time. Using this principle, we constructed master curves of the storage (G′) and loss modulus (G″) over a large frequency range (up to 1 kHz). All master curves were constructed using shift factors (aT) that were computed using the empirical WLF equation described in Ref. 16 (see Eq. 1 below)
| (1) |
where c1 and c2 are constants and T0 is a reference temperature. We measured the complex modulus of all samples using the dynamic mechanical analyzer, which was configured to vibrate the sample under investigation sinusoidally with a maximum amplitude of 15 μm (peak-to-peak) and the total applied stress of 0.01 N. The measurement protocol that we employed can be summarized in six steps.
-
(1)
Lower the temperature of the sample under investigation to 10 °C.
-
(2)
Measure the complex modulus over a small range of frequencies (i.e., between 1 and 20 Hz) where inertial effects are negligible.
-
(3)
Increase the temperature of the sample by 2.5 °C.
-
(4)
Repeat steps (2) and (3) until the temperature of the sample exceeds 25 °C.
-
(5)
Compute the shift factors by applying Eq. 1 to the complex modulus measured at different temperatures. In this study, the shift factors were computed by fitting the WLS model to the isothermal in a least-squares sense. All curve fitting was performed using the rheology advantage data analysis software package (v5.3.1, TA Instruments, Inc., New Castle, Delaware).
-
(6)
Construct storage and loss modulus master curves by shifting the values obtained at different temperatures along the frequency axis to the corresponding values at the reference temperature.
Estimating T1 and T2 relaxation time
We manufactured two (10 cm diameter) circular gelatin phantoms, each of which contained four (30 mm diameter) spherical gelatin inclusions, with varying amounts of either agar or sucrose (see Table 1) to determine the effect that sucrose and agar had on the MR properties of gelatin. The inclusions were arranged along a circular path, with decreasing sugar or agar concentration moving from 12 o’clock to 9 o’clock in a clockwise manner, in 20%-by-weight molten gelatin. For each phantom, we calculated images of the T1 and T2 relaxation times from MR images that were acquired with the combined MR sequence described in Ref. 17. We performed MR imaging on both phantoms using a Philips 3T Achieva X-series scanner (Philips Medical, Best, Netherlands) in a sense quadrature head coil over a 110 mm2 field of view (FOV). Nine slices (each 2 mm thick) were acquired from each phantom, using repetition times (TRs) of 920 and 2300 ms and echo times (TEs) of 30 and 100 ms, respectively.
Phantom study
Linear shear-modulus reconstruction method
We computed the shear-modulus distribution within phantoms or breast tissues by employing a combination of the finite-element method and the Newton–Raphson iterative scheme. We have described the principles of this reconstruction approach previously;10, 14, 18, 19 therefore, only a brief overview of the method will be provided here. The objective criterion Φ that is employed has the general form
| (2) |
which is expandable as a sum over subzones comprising the solution domain
| (3) |
where Uz(μz,λz) represents the three-dimensional internal displacements on the zth subzone computed from the shear modulus (μz) and lambda modulus (λz) estimates, and represents the corresponding three-dimensional MRE-measured internal tissue displacements. Minimizing the sum in Eq. 3 is assumed to be equivalent to the sum of minimizations of the individual subzones, i.e.,
| (4) |
This involves setting the derivatives of the computed displacements with respect to the subzone moduli to zero and solving the resulting set of nonlinear equations with Newton’s iterative method. The ensuing matrix solution at iteration (k+1) has the form20
| (5) |
where is the n×m Jacobian or sensitivity matrix, λk is a positive number that is employed to improve the condition of the Hessian matrix [i.e., ] before inversion, and I is an identity matrix. Local fluctuation in the reconstructed parameters is suppressed by spatially filtering the updated modulus values as follows
| (6) |
where the superscripts old and new represent the unfiltered and filtered modulus values, respectively, and [F] is the sparse filtering matrix that is computed at the start of the reconstruction as described in Ref. 21. This spatial filtering technique is analogous to a forward difference regularization method.22, 23
Elasticity phantom fabrication
We fabricated an elastically heterogeneous phantom (10 cm long×5 cm diameter) from a suspension consisting of porcine skin gelatin (Type A, approximately 175 bloom, Sigma-Aldrich, St. Louis, MO) ; de-ionized water (18 MΩ); and sucrose (Sigma-Adrich, St. Louis, MO). The phantom contained four, single, 10 mm diameter spherical inclusions that were manufactured from 15%-by-weight gelatin and sucrose, with respective concentrations of 5%, 10%, 15%, 20%, and 30% to simulate focal inclusions with varying levels of frequency dependency. The surrounding background gel was manufactured from 8%-by-weight gelatin, and to deter bacterial growth, we added 0.25%-by-weight ethylenediamine tetra-acetic acid (Sigma-Aldrich, St. Louis, MO) to both the inclusions and the surrounding background gel.
MRE data acquisition
We performed MR elastographic imaging using a clinical prototype system. To induce motion in the phantom, we drove the piezoelectric actuator at 100 Hz (40 μm surface displacement) using a sinusoidal voltage (150 V). We monitored the resultant time-varying harmonic tissue displacements under steady-state conditions using a motion-sensitive gradient-echo MR pulse sequence.7 The MR scanner (3 T whole-body imager, Philips Achieva X-series) was configured to operate with an TE of 15.6 ms, a TR of 20.6 ms, and a flip angle of 30°. Forty-two (2 mm thick) coronal slices were acquired from a 16 cm FOV in each coordinate direction. Eight relative phase images (256×256 matrix resolution) were obtained in phase-cycling mode from each slice. We estimated the three-dimensional steady-state displacement fields by applying the least-squares fitting procedure described in Ref. 7 to the relative phase images.
Shear-modulus estimation
A finite-element mesh was constructed by applying the grid-generation techniques described in Ref. 24 to MR magnitude images which had been segmented manually using the ANALYZE software package [V.5 (b1), Mayo Foundation, 1998]. The time-harmonic displacements were projected on the finite-element meshes using a cubic interpolation function (MATLAB, The MathWorks, Inc., Natick, MA). We reconstructed the modulus elastograms based on an initial estimate that the tissue and phantoms under investigation were elastically homogeneous (μ=2 kPa, λ=100 kPa), and this process was terminated after 90 iterations; we observed that the reconstruction technique typically converges within 85–90 global iterations when it is applied to noisy displacement estimates (i.e., <15% measurement noise).
RESULTS AND DISCUSSION
Initial mechanical testing and MR measurements
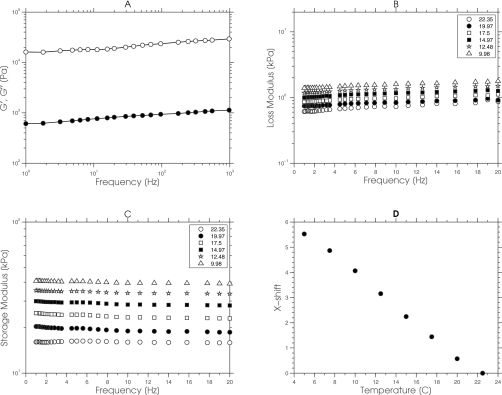
Figure 2 shows a representative example of the data obtained from a typical gelatin sample using our mechanical measurement protocol that was used to computed master curves [see Fig. 2a]. First, we acquired the real (G′) and imaginary (G″) components of the complex modulus at different temperatures for a small range of frequencies (1–20 Hz) as shown in Figs. 2b, 2c. Second, we computed the shift factors by applying the WLS model [Eq. 1] to the data presented in Figs. 2b, 2c. The computed shift factors, plotted as a function of temperature, are shown in Fig. 2d. Third, we constructed master curves [see Fig. 2a] by shifting the data presented in Figs. 2b, 2c to room temperature (25 °C) using the shift factors shown in Fig. 2d. Evidently, the temperature superposition reduced the inertial effects incurred when tissue-like samples were measured at high frequencies. Although the application of the TTS method to measure the complex mechanical behavior of soft tissues (or gelatin samples) is not particularly novel,25, 26 to our knowledge, this is the first reported study that demonstrates its utility in elastographic imaging. Specifically, this study demonstrated that the TTS method could measure the complex mechanical behavior of tissue-like samples over the wide range of frequencies (i.e., between 1 and 1000 Hz) currently employed in MRE, a task that none of the methods that have been proposed for obtaining reliable biomechanical data from soft tissues can accomplish. Indentation methods27, 28, 29 have provided reliable estimates of the biomechanical properties of ex vivo tissue samples, but they are not suitable for MRE validation studies because of differences in the measurement conditions. More specifically, indentation methods measure the biomechanical properties of soft tissues under quasistatic conditions, whereas MRE measures the biomechanical properties of soft tissues under dynamic conditions. Dynamic mechanical indentation has been used to measure the complex modulus of soft tissues,30, 31, 32 but the frequency range employed (0.006–20 Hz) is not congruent with that employed in MRE. Madsen et al.33 proposed a system for measuring the complex modulus of soft tissues over a wider frequency range (10–400 Hz); however, the proposed system is not available commercially. The technique we describe here can be carried out relatively easily with any commercially available, dynamic mechanical analyzer. Although computing the temperature-dependent shift factor aT, using the WLS empirical model, gave reasonable results, we plan to assess the differences in competing models to see which is most suitable for breast tissues. During TTS analysis, care must be exercised when selecting the temperature range because the method will fail when the morphology of the sample changes over the temperature range of interest.38
Figure 2.
(a) Master curves of the real (closed circles) and imaginary component (open circles) of the complex modulus that was computed by shifting the data shown in (b) and (c) along the frequency axis using the shift factors shown in (d). The real and imaginary components of the complex modulus that were measured over a small range of frequencies (i.e., 0–20 Hz) for a range of temperatures (i.e., from 9.98 to 22.35 °C) are shown in (b) and (c), respectively. (d) The horizontal shift factors that were computed by applying the WLS empirical model to the data acquired in (b) and (c).
Effect of agar on the complex modulus of gelatin
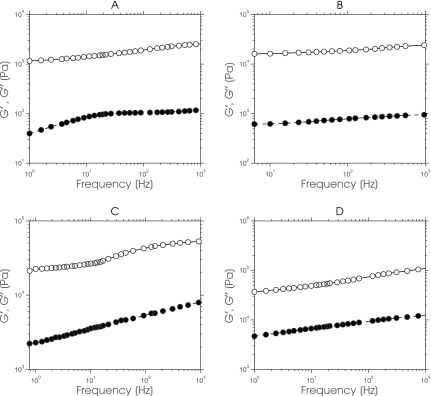
Figure 3 shows a montage of master curves (G′ and G″) obtained from gelatin samples that contained agar with concentrations ranging from 1% to 4%. Both components of complex modulus displayed marginal frequency dependency, and the magnitude of G′ was considerably larger than that of G″; a typical behavior of marginally viscoelastic materials.9, 10, 12 Linear regression analysis [i.e., the ln(G′;G″) vs ln (frequency)] revealed two important observations. First, the y-intercept of the ln(G′) master curves increased noticeably with increasing agar concentration. Second, the ln(G″) master curves increased only slightly. These observations demonstrated that phantoms with a small loss modulus and a relatively large dynamic range of storage modulus can be fabricated by doping gelatin with agar, which is consistent with previously reported results.9, 12
Figure 3.
Storage (closed circles) and loss (open circles) master curves obtained from a gelatin sample that contained (a) 0% agar, (b) 1% agar, (c) 3% agar, and (d) 4% agar.
Effect of sucrose on the complex modulus of gelatin
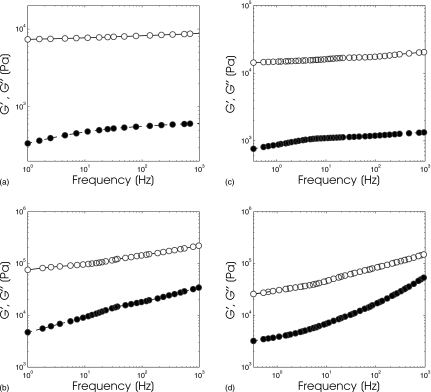
Figure 4 shows a montage of master curves (G′ and G″) that was obtained from gelatin samples containing sucrose with concentrations ranging from 2.5% to 20%. Compared to the mechanical properties of the gelatin-agar samples shown in Fig. 3, the magnitude of G′ and G″ of the gelatin-sucrose samples both increased noticeably with increasing frequency; but evidently the magnitude of G″ depends on sucrose concentration, which is not surprising, since increasing sucrose concentration will increase the viscosity of the continuous phase of gelatin and slow down the movement of protein aggregates.34 Changing the pH of the gelatin should yield a similar effect, as discussed in Ref. 35, although one that is more difficult to standardize. We have demonstrated for the first time the feasibility of constructing viscoelastic elasticity phantoms from gelatin-sucrose composite as a practical benchmark for evaluating the degree of degradation incurred when linear-elastic MRE reconstruction methods are applied to such mediums.
Figure 4.
Storage (closed circles) and loss (open circles) master curves obtained from a gelatin sample that contained (a) 2.5% sucrose, (b) 5% sucrose, (c) 10% sucrose, and (d) 20% sucrose.
Effect of agar and sucrose on the MR properties of gelatin
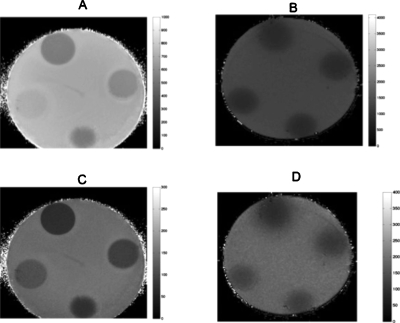
Figure 5 shows representative examples of quantitative MR images recovered from phantoms that contained cylindrical-shaped gelatin-agar and gelatin-sucrose inclusions. These images were computed by applying the nonlinear least-squares estimation technique described in Ref. 17 to sequences of MR images that were acquired on a 3 T whole-body magnetron. In both phantoms, dropout artifacts were visible in areas (i.e., the gel-air interface) where the NMR model was invalid. However, evidently, sucrose shortened the gelatin’s spin-spin (T1) and spin-lattice (T2) relaxation times, whereas agar influenced the gelatin’s NMR relaxation times marginally. The relaxation times of all inclusions were within a range acceptable for representing human tissues.36
Figure 5.
[(a) and (b)] T1 and [(c) and (d)] T2 quantitative MR images obtained from phantoms that contained gelatin-agar inclusions (left) and gelatin-sucrose inclusions (right) with increasing concentrations from 12 o’clock in a clockwise direction.
The effect of frequency-dependent mechanical properties on the quality and accuracy of MR elastograms
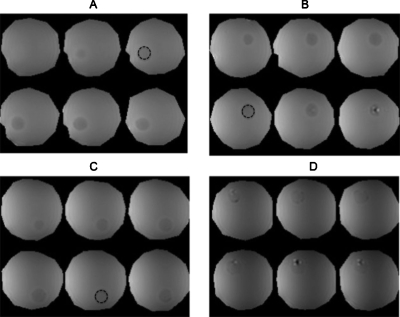
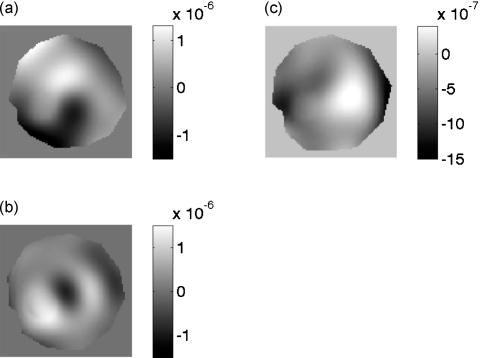
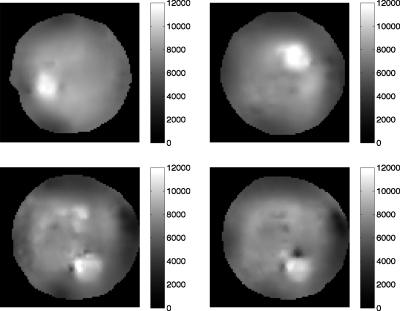
Figure 6 shows a montage of magnitude MR images that we obtained from the elasticity phantom that contained focal lesions with varying levels of viscosity. The tumor-like inclusions are visible in the MR image due to the presence of copper sulfate, a MR contrast agent that was added to identify the location, size, and extent of each inclusion. Figures 7a, 7b, 7c show a representative example of the steady-state MR-displacement estimates that was obtained from a typical inclusion. The results indicate that it is difficult to pinpoint the location, size, and extent of the inclusions from the displacement images, which we anticipated given the complexity of the displacement patterns. Figure 8 shows a montage of MR elastograms corresponding to the largest cross-section of each group of inclusions shown in Fig. 6. Apparently, artifacts incurred in the elastograms were highly dependent on the viscosity of the inclusions. More specifically, the inclusion with the least amount of sucrose (i.e., the least viscous) had relatively no artifacts (CNRe=40.46), whereas noticeable artifacts were apparent in the most viscous inclusion (CNRe=11.02). This suggests that reconstructing the shear modulus of viscous materials with a linear reconstruction method will compromise the spatial and contrast resolution of the resulting elastograms. CNR was defined in this work as
| (7) |
where γL and γB represent the mean mechanical properties in the inclusion and the background tissues, respectively, and σ2L and σ2B represents the variances in the respective mechanical properties. We conducted independent mechanical tests on representative, elastically homogeneous, cylindrical-shaped samples (40 mm diameter by 35 mm height) using the time-temperature superposition principle to determine the influence of viscosity on the accuracy of the reconstructed elastograms. We assessed the accuracy (i.e., bias) by comparing the mean shear modulus recovered from the inclusions and surrounding background gel (i.e., the control) relative to that measured at 100 Hz using the TTS method. The mean shear modulus in each inclusion was assessed over the area denoted by the dotted lines in Fig. 6. Table 2 summarizes the mean shear modulus measured with the TTS and that recovered using the linear-elastic MR reconstruction method. The reconstructed values were within 15% of the true values for marginally viscoelastic inclusions, but this bias increased almost linearly with increasing viscosity (we could only reconstruct within 42% of the actual shear modulus for the most viscous inclusion). The results demonstrate that the reconstruction error was dominated more by model-data discrepancy than by displacement-measurement noise when the shear modulus of viscoelastic materials was recovered using a linear-elastic reconstruction method. We expect that the errors will be larger in practice, especially since, in addition to viscosity, breast tissues exhibit nonlinearity and some degree of anisotropy, both of which are typically not taken into account during shear-modulus image reconstruction. This could be one of the reasons why there are such wide variations in the shear-modulus values of breast tissue reported by different research groups.37
Figure 6.
Montage of magnitude MR images obtained from an elasticity phantom that contained 10 mm diameter gelatin inclusion that were manufactured from 15%-by-weight gelatin and sucrose, with respective concentrations of (a) 5%, (b) 10%, (c) 20%, and (d) 30%. The inclusions are discernible in the MR images due to the presence of a contrast agent. The dashed lines denote the ROI along which the mean shear moduli shown in Table 2 were computed.
Figure 7.
Harmonic displacement estimates displayed in units of [m] corresponding to the largest cross-section of the inclusion MR magnitude images shown in Fig. 6a. These images were obtained from a slice containing on inclusion. Image obtained using the (a) X, (b) Y, and (c) Z motion encoding gradient.
Figure 8.
Shear-modulus elastograms obtained from the largest cross-section of each inclusion in the elastically heterogeneous phantom as determined from the magnitude MR images (i.e., Fig. 6).
Table 2.
A summary of the mean shear modulus computed in the shear modulus elastograms shown in Fig. 8 over the region denoted in Fig. 6, and that measured from 5 representative samples using the established principle of time-temperature superposition.
| Material | Recovered shear modulus (Pa) | Shear modulus measured using TTS method (Pa) | Absolute difference (%) |
|---|---|---|---|
| Inclusion 1 | 10 300±794 | 8812±791.45 | 14.45 |
| Inclusion 2 | 10 890±1263 | 9180±516.32 | 15.70 |
| Inclusion 3 | 9690±1110 | 12 700±343.23 | 31.063 |
| Inclusion 4 | 11 370±697 | 16 200.3±412.2 | 42.483 |
| Background | 5030±778 | 4198±238.02 | 16.54 |
CONCLUSIONS
Soft tissues display a complex array of mechanical properties that includes nonlinearity, anisotropy, and viscoelasticity;8 however, they are generally assumed to exhibit simple linear isotropic elastic behavior during MRE image reconstructions. Although these assumptions have simplified the image-reconstruction process, by reducing the number of parameters required to characterize the mechanical behavior, such assumptions are typically not valid in practice and thus will degrade the clinical performance of MRE. This point is important for clinicians to know, since the majority of proposed MRE breast-imaging systems are either undergoing preclinical testing or clinical trials. In this work, we have demonstrated that although linear-elastic MRE reconstruction methods can detect viscoelastic inclusions as small as 10 mm in diameter, artifacts that degrade spatial and contrast resolution will be incurred when viscoelastic materials such as breast tissues are reconstructed using linear-elastic reconstruction methods.
A number of important issues that were not addressed in this study will be the focus of future studies. We would like to examine how much degradation in image quality (i.e., ability to detect and characterize lesions) will be incurred when we image linear viscoelastic inclusions that are embedded in a viscoelastic background. This would be relevant to breast imaging, since it could tell us how effective MRE would be in detecting and characterizing lesions that are surrounded by fatty breast tissues. Perhaps even more importantly, we would like to investigate the improvement in performance that might be gained by employing other constitutive laws (e.g., viscoelasticity, poroelasticity, etc.) when reconstructing the mechanical properties of more complex phantoms, i.e., phantoms that display viscous and poroelastic mechanical behavior. Although the answers to these questions are beyond the work described in this article, it is clear that more advanced image-reconstruction techniques should improve the performance of current MR elastograms.
ACKNOWLEDGMENTS
This work was supported by the National Cancer Institute Program Project Grant No. P01CA80139.
References
- Jemal A., Siegel R., Ward E., Hao Y., Xu J., Murray T., and Thun M. J.“Cancer statistics, 2008,” Ca-Cancer J. Clin. 58, 71–96 (2008). 10.3322/CA.2007.0010 [DOI] [PubMed] [Google Scholar]
- Keith L., Oleszczuk J., and Laguens M., “Are mammography and palpation sufficient for breast cancer screening? A dissenting opinion,” J. Womens Health & Gender-Based Medicine 11(1), 17–25 (2002). 10.1089/152460902753473417 [DOI] [PubMed] [Google Scholar]
- Fowlkes J. et al. , “Magnetic-resonance imaging techniques for detection of elasticity variation,” Med. Phys. 22, 1771–1778 (1995). 10.1118/1.597633 [DOI] [PubMed] [Google Scholar]
- Muthupillai R., Lomas D. J., Rossman P. J., Greenleaf J. F., Manduca A., and Ehman R. L., “Magnetic resonance elastography by direct visualization of propagating acoustic strain waves,” Science 269(5232), 1854–1857 (1995). 10.1126/science.7569924 [DOI] [PubMed] [Google Scholar]
- Plewes D., Betty I., Urchuk S. et al. , “Visualizing tissue compliance with MR imaging,” J. Magn. Reson Imaging 5(6), 733–738 (1995). 10.1002/jmri.1880050620 [DOI] [PubMed] [Google Scholar]
- Sinkus R., Lorenzen J., Schrader D. et al. , “High-resolution tensor MR elastography for breast tumour detection,” Phys. Med. Biol. 45(6), 1649–1664 (2000). 10.1088/0031-9155/45/6/317 [DOI] [PubMed] [Google Scholar]
- Weaver J. et al. , “Magnetic resonance elastography using 3D gradient echo measurements of steady-state motion,” Med. Phys. 28(8), 1620–1628 (2001). 10.1118/1.1386776 [DOI] [PubMed] [Google Scholar]
- Fung Y., Biomechanical Properties of Living Tissues (Springer-Verlag, New York, 1981). [Google Scholar]
- de Korte C. et al. , “Elastic and acoustic properties of vessel mimicking material for elasticity imaging,” Ultrason. Imaging 19(2), 112–126 (1997). [DOI] [PubMed] [Google Scholar]
- Doyley M., Weaver J., Houten E. V. et al. , “Thresholds for detecting and characterizing focal lesions using steady-state MR elastography,” Med. Phys. 30(4), 495–504 (2003). 10.1118/1.1556607 [DOI] [PubMed] [Google Scholar]
- Madsen E. L. et al. , “Tissue-mimicking oil-in-gelatin dispersions for use in heterogeneous elastography phantoms,” Ultrason. Imaging 25(1), 17–38 (2003). [DOI] [PubMed] [Google Scholar]
- Hall T. et al. , “Phantom materials for elastography,” IEEE Trans. Ultrason. Ferroelectr. Freq. Control 44(6), 1355–1365 (1997). 10.1109/58.656639 [DOI] [Google Scholar]
- Madsen E. L. et al. , “Tissue-mimicking agar/gelatin materials for use in heterogeneous elastography phantoms,” Phys. Med. Biol. 50(23), 5597–5618 (2005). 10.1088/0031-9155/50/23/013 [DOI] [PMC free article] [PubMed] [Google Scholar]
- Houten E. V., Paulsen K., Miga M. et al. , “An overlapping subzone technique for MR-based elastic property reconstruction,” Magn. Reson. Med. 42, 779–786 (1999). [DOI] [PubMed] [Google Scholar]
- Olsen N., Christensen T., and Dyre J., “Time-temperature superposition in viscous liquids,” Phys. Rev. Lett. 86, 1271–1274 (2001). 10.1103/PhysRevLett.86.1271 [DOI] [PubMed] [Google Scholar]
- Williams M., Landel R., and Ferry J., “The temperature dependence of relaxation mechanisms in amorphous polymers and other glass-forming liquids,” J. Am. Chem. Soc. 77, 3701–3707 (1955). 10.1021/ja01619a008 [DOI] [Google Scholar]
- in den Kleef J. J. and Cuppen J. J., “RLSQ: T1, T2 and ρ calculations, combining ratios and least squares,” Magn. Reson. Med. 5, 513–524 (1987). 10.1002/mrm.1910050602 [DOI] [PubMed] [Google Scholar]
- Doyley M. M. et al. , “Shear modulus estimation using parallelized partial volume reconstruction,” IEEE Trans. Med. Imaging 23(11), 1404–1416 (2004). 10.1109/TMI.2004.834624 [DOI] [PubMed] [Google Scholar]
- Van Houten E. E. et al. , “Three-dimensional subzone-based reconstruction algorithm for MR elastography,” Magn. Reson. Med. 45(5), 827–837 (2001). 10.1002/mrm.1111 [DOI] [PubMed] [Google Scholar]
- Marquardt D. W., “An algorithm for least-squares estimation of nonlinear parameters,” J. Soc. Ind. Appl. Math. 11, 431–441 (1963). 10.1137/0111030 [DOI] [Google Scholar]
- Doyley M. M., Meaney P. M., and Bamber J. C., “Evaluation of an iterative reconstruction method for quantitative elastography,” Phys. Med. Biol. 45(6), 1521–1540 (2000). 10.1088/0031-9155/45/6/309 [DOI] [PubMed] [Google Scholar]
- Press W. H.et al. , Numerical Recipes in C: The Art of Scientific Computing (Cambridge University Press, Cambridge, 1988). [Google Scholar]
- Semenov S. Y. et al. , “Microwave tomography: Two-dimensional system for biological imaging,” IEEE Trans. Biomed. Eng. 43(9), 869–877 (1996). 10.1109/10.532121 [DOI] [PubMed] [Google Scholar]
- Paulsen K. D., Jia X., and Sullivan J. M., “Finite element computations of specific absorption rates in anatomically-conforming full-body models for hyperthermia treatment analysis,” IEEE Trans. Biomed. Eng. 40(9), 933–945 (1993). 10.1109/10.245615 [DOI] [PubMed] [Google Scholar]
- Chan R. W., “Estimation of viscoelastic shear properties of vocal-fold tissues based on time-temperature superposition,” J. Acoust. Soc. Am. 110(3), 1548–1561 (2001). 10.1121/1.1387094 [DOI] [PubMed] [Google Scholar]
- Geerligs M. et al. , “Linear viscoelastic behavior of subcutaneous adipose tissue,” Biorheology 45(6), 677–688 (2008). [PubMed] [Google Scholar]
- Samani A., Zubovits J., and Plewes D., “Elastic moduli of normal and pathological human breast tissues: An inversion-technique-based investigation of 169 samples,” Phys. Med. Biol. 52(6), 1565–1576 (2007). 10.1088/0031-9155/52/6/002 [DOI] [PubMed] [Google Scholar]
- Samani A. and Plewes D., “An inverse problem solution for measuring the elastic modulus of intact ex vivo breast tissue tumors,” Phys. Med. Biol. 52(5), 1247–1260 (2007). 10.1088/0031-9155/52/5/003 [DOI] [PubMed] [Google Scholar]
- Erkamp R. et al. , “Measuring the nonlinear elastic properties of tissue-like phantoms,” IEEE Trans. Ultrason. Ferroelectr. Freq. Control 51, 410–419 (2004). 10.1109/TUFFC.2004.1295426 [DOI] [PubMed] [Google Scholar]
- Krouskop T., Wheeler T., Kallel F. et al. , “Elastic moduli of breast and prostate tissues under compression,” Ultrason. Imaging 20(4), 260–274 (1998). [DOI] [PubMed] [Google Scholar]
- Lu Z. and Bilston L., “On the viscoelastic character of liver tissue: Experiments and modeling of the linear behaviour,” Biorheology 37(3), 191–201 (2000). [PubMed] [Google Scholar]
- Kiss M., Varghese T., and Hall T., “Viscoelastic characterization of in vitro canine tissue,” Phys. Med. Biol. 49, 4207–4218 (2004). 10.1088/0031-9155/49/18/002 [DOI] [PMC free article] [PubMed] [Google Scholar]
- Madsen E. L. et al. , “Instrument for determining the complex shear modulus of soft-tissue-like materials from 10 to 300 Hz,” Phys. Med. Biol. 53(19), 5313–5342 (2008). 10.1088/0031-9155/53/19/004 [DOI] [PMC free article] [PubMed] [Google Scholar]
- Kasapis S. et al. , “State diagram of temperature vs date solids obtained from the mature fruit,” J. Agric. Food Chem. 48(9), 3779–3784 (2000). 10.1021/jf9913615 [DOI] [PubMed] [Google Scholar]
- Choi Y., Lim S., and Yoo B., “Measurement of dynamic rheology during ageing of gelatine-sugar composites,” International Journal of Food & Science Technology 39(9), 935–945 (2004). 10.1111/j.1365-2621.2004.00871.x [DOI] [Google Scholar]
- Kornaat P., Koo S., Andriacchi T et al. , “Comparison of quantitative cartilage measurements acquired on two 3.0 T MRI systems from different manufactors,” J. Magn. Reson Imaging 23(5), 770–773 (2006). 10.1002/jmri.20561 [DOI] [PubMed] [Google Scholar]
- Houten E. V., Doyley M., Kennedy F. et al. , “Initial in vivo experience with steady-state subzone-based MR elastography of the human breast,” J. Magn. Reson Imaging 17, 72–85 (2003). 10.1002/jmri.10232 [DOI] [PubMed] [Google Scholar]
- Han C. and Kim K., “On the use of time-temperature superposition in multicomponent/multiphase polymer systems,” Polymer 34(12), 2533–2539 (1993). 10.1016/0032-3861(93)90585-X [DOI] [Google Scholar]


