Abstract
Abnormal microvascular physiology and function is common in many diseases. Numerous pathologies include hypervascularity, aberrant angiogenesis, or abnormal vascular remodeling among the characteristic features of the disease, and quantitative imaging and measurement of microvessel function can be important to increase understanding of these diseases. Several optical techniques are useful for direct imaging of microvascular function. Spectral imaging is one such technique that can be used to assess microvascular oxygen transport function with high spatial and temporal resolution in microvessel networks through measurements of hemoglobin saturation. We highlight novel observation made with our intravital microscopy spectral imaging system employed with mouse dorsal skin-fold window chambers for imaging hemoglobin saturation in microvessel networks. Specifically, we image acute oxygenation fluctuations in a tumor microvessel network, the development of arteriovenous malformations in a mouse model of hereditary hemorrhagic telangiectasia, and the formation of spontaneous and induced microvascular thromboses and occlusions.
Keywords: arteriovenous, hemoglobin, in vivo, microscopy, oxygen, tumor
Introduction
Imaging and measurement of microvessel function can be important to increase understanding of various diseases. Numerous pathologies include hypervascularity, aberrant angiogenesis, or abnormal vascular remodeling among the characteristic features of the disease.1, 2, 3 For example, the microvasculature of solid tumors is structurally and functionally abnormal,4, 5 foot ulcerations can occur in diabetes mellitus patients due to impaired angiogenesis and poor vascularization,6, 7 angiogenesis that forms abnormal microvasculature can sustain chronic inflammation in rheumatoid arthritis,8, 9 and epidermal hyperplasia is a characteristic of psoriatic skin lesions.10 Many ophthalmic diseases, such as diabetic retinopathy and sensile vascular degeneration, also have an underlying microvascular component.11, 12
Several optical techniques are useful for direct imaging of microvascular morphology and function either clinically or in preclinical animal models. Intravascular fluorescence contrast agents can be used for imaging of microvessel morphology in some tissues with wide-field fluorescence imaging (e.g., retinal angiography with sodium fluorescein13) or multiphoton microscopy using dyes or quantum dots.14 Multiphoton microscopy can also be used to measure microvessel blood velocity,15 permeability,16 and relative oxygenation17 in animal models. Relative microvessel profusion can be measured with laser Doppler and speckle contrast techniques.18, 19 Photoacoustic tomography and microscopy can be used to measure microvascular morphology and relative vessel oxygenation.20, 21, 22 Optical coherence tomography (OCT) can be a particularly versatile optical modality for microvasculature imaging and measurements. Blood velocity can be measured23, 24, 25 with Doppler OCT, relative microvessel oxygenation can be measured with spectroscopic OCT methods,26, 27, 28, 29 microvessel hematocrit can be measured from scattering attenuation by red blood cells,30 and speckle variance processing can provide contrast for microvessel morphology imaging.31
Spectral imaging can be used to assess microvascular oxygen transport function in microvessel networks through measurements of hemoglobin saturation. Spectral imaging of microvessels with high resolution is limited to superficial tissue microvessels and the best results are often obtained invasively with animal models; thus, the utility of spectral imaging measurements of microvascular function may potentially be applied best in the preclinical setting. Depending on instrument capabilities and the animal model used, correlations in hemoglobin saturation can be obtained throughout a microvessel network with high spatial and temporal resolution. Several researchers have used spectral imaging in preclinical models to measure microvascular hemoglobin saturation in mesentery tissue,32 cremaster muscle,33 rodent dorsal skin-fold window chambers,32, 33, 34, 35, 36 and cerebrum.19, 37 In this paper, we highlight novel observations made with our intravital microscopy spectral imaging system used with mouse dorsal skin-fold window chambers for imaging hemoglobin saturation in microvessel networks. Specifically, we image acute oxygenation fluctuations in a tumor microvessel network, the formation of arteriovenous anastomoses in a mouse model of hereditary hemorrhagic telangiectasia, and the formation of spontaneous and induced microvascular thromboses and occlusions.
Materials and Methods
Detailed descriptions of the imaging system, spectral imaging calibration, and the window chamber model can also be found in previous publications.34, 35 All in vivo experiments were conducted under protocols approved by the University of Florida Institutional Animal Care and Use Committee.
Imaging System
For intravital microscopy spectral imaging, a Zeiss AxioImager microscope (Carl Zeiss, Inc., Thornwood, New York) serves as the imaging platform. The window chamber is transilluminated by a 100-W tungsten halogen lamp. Spectral imaging datasets are acquired with a 1388-×1024-pixel CCD camera (DVC Company, Austin, Texas) with 12-bit dynamic range. The camera is thermoelectrically cooled to −20 °C. The microscope objectives (Carl Zeiss, Inc., Thornwood, New York) have a long working distance (WD) as follows: 2.5× [numerical aperture (NA)=0.12, WD=6.3 mm] and 5× (NA=0.25, WD=12.5 mm) Fluars, and a 10× (NA=0.3, WD=5.5 mm) Plan-NeoFluar. A C-mounted liquid crystal tunable filter (LCTF) with a 400- to 720-nm transmission range and 10-nm nominal bandwidth (CRI, Inc., Woburn, Massachusetts) placed in front of the CCD camera is used for band-limited optical filtering for spectral imaging. Images acquired with the CCD camera are saved as 16-bit TIF (tagged image format) files.
Image Acquisition
Software created with LabVIEW (National Instruments Corp., Austin, Texas) was used to control the LCTF tuning and CCD camera operation. The software enables automated image acquisition with user-specified camera exposure times and gains for each filter wavelength. For each hemoglobin saturation (HbSat) measurement data set, 16 images were acquired from 500 to 575 nm in 5-nm intervals. The transmission of the LCTFs was lower at shorter wavelengths and higher at longer wavelengths, therefore the image acquisition time was adjusted a priori for each wavelength such that the full dynamic range of the camera was used. The minimum exposure time used was 300 ms to average out fluctuations in the signal due to random red blood cell motion.35 A typical data set was acquired in about 13 s, which included image acquisition, filter tuning, image transfer, and saving of the images to the computer hard drive.
In Vivo Surgery and Imaging
A titanium window chamber was surgically implanted under anesthesia [ketamine 100 mg∕kg IP (intraperitoneal) and xylazine 10 mg∕kg IP] on the back of mice. In this window chamber model, one piece of skin was removed completely and replaced with a 12-mm-diam #2 round glass coverslip (Erie Scientific, Portsmouth, New Hampshire). For experiments with tumors, a window chamber tumor was established during chamber implantation by injecting 10 μL of a single cell suspension of tumor cells. In survival experiments, animals were housed in an environmental chamber with free access to food and water and standard 12-h light∕dark cycles.
For imaging, animals were placed on a heating pad attached to the microscope stage during the imaging session. A custom-built window chamber holder stably secured the window chamber under the microscope objective. The holder was fastened to the microscope stage in a manner that enabled the window chamber to be positioned under the microscope objective using the standard manual controls on the microscope stage. Anesthesia for immobilization during imaging is provided by isoflurane (1 to 1.5%) in air.
Image and Data Processing
Image processing was performed using software developed with MATLAB (The Mathworks, Inc., Natick, Massachusetts). Images were converted into double-precision arrays for mathematical processing. Raw pixel values were converted to absorbance values after manually selecting avascular reference regions in the images as estimates of unattenuated light. Calibration spectra of oxy- and deoxyhemoglobin obtained with the imaging system were used to calculate pixel HbSat values by linear least-squares regression of the data in a linear mixing model according to the method of Shonat et al.37 as described previously.35 Briefly, the following model equation was used to process each image pixel:
| (1) |
where Aλ is the absorbance at wavelength λ; I is the pixel value; I0 is a reference light pixel value; and are the extinction coefficients for oxy- and deoxyhemoglobin, respectively, at wavelength λ; [HbO2] and [Hb-R] are the concentrations of oxy- and deoxyhemoglobin, respectively; L is the pathlength; and S is a pathlength-dependent scattering term, where scattering was assumed to be constant in the wavelength range used. The scattering term in the model equation in practice actually functions like a constant additive error term. The pixel values were converted to absorbance values by manually selecting avascular regions in the images to use as an estimate of I0. Pixels that have regression fits of R2<0.90 were rejected.
Tumor Experiments
We used 4TO7 mouse mammary adenocarcinoma cells that are nonmetastaic subclones of the 4T1 cell line with athymic female nude (nu∕nu) mice. The tumor cells were a gift from Mark W. Dewhirst, Duke University, Durham, North Carolina. The tumor cells were cultured as a monolayer in Dulbecco modified Eagle medium (DMEM; Mediatech, Manassas, Virginia) with 10% fetal bovine serum (Mediatech, Manassas, Virginia) prior to implantation. Cultures were used after one or two passages from frozen stocks to ensure recovery from the thermal shock and a normal growth rate. The cells were enzymatically dissociated from the flasks (BD Bioscience, San Jose, California) using 0.05% trypsin∕EDTA (Mediatech, Manassas, Virginia) and counted on a hemacytometer to determine the cell concentration to prepare single-cell suspensions for implantation. The 4TO7 tumors were established at the time of window chamber surgery from a 10-μL single cell suspension of 5×10³ to 10×103 cells injected into the subcutaneous tissue immediately prior to placing a 12-mm round glass coverslip over the exposed area of the skin.
Arteriovenous Anastomosis Experiments
Imaging of pathological anastomoses formation in the form of arteriovenous malformations was performed using a mouse model of hereditary hemorrhagic telangiectasia (HHT). In this mouse model, the activin-receptor-like kinase 1 (Alk1) gene is designed to be deleted by administration of tamoxifen. Details about the generation of the Alk1 conditional knockout mice were described previously.38 Conditional Alk1 knockout (Alk12f∕−) mice were intercrossed with ROSA26CreER∕+ mice that ubiquitously produce CreER that is a fusion protein of Cre recombinase and a mutated form of the estrogen receptor that can be activated by tamoxifen. The experimental group included mice with ROSA26CreER∕+;∕Alk12f∕2f and ROSA26CreER∕+;Alk12f∕− genotypes while the control groups were ROSA26+∕+;Alk12f∕2f and ROSA26+∕+;Alk12f∕− mice. Window chambers were surgically installed as already described, and a wound was created in an avascular area between vessel branches in the center of the window chamber using a 16-gauge needle during surgery. Oil-based tamoxifen (Sigma-Aldrich, St. Louis, Missouri) was administered intraperitoneally at 2.5 mg∕25 g bodyweight to control and knockout mice immediately prior to window chamber installation. Mice were imaged as already described almost every day for up to 11 days after surgery.
Blood flow through suspected arteriovenous malformations (AVMs) from arterioles to venules was confirmed by tracking fluorescently labeled red blood cells (RBCs). Blood from a donor mouse was labeled with the carbocyanine dye 1,1′-dioctadecyl-3,3,3′,3′-tetramethylindodicarbocyanine, 4-chlorobenzenesulfonate salt (DiD solid, Invitrogen, D-7757) similar to the procedure used by Unthank et al.39 A 50-μL bolus of packed labeled RBCs in saline solution (30% v∕v) was administered by tail vein injection 1 to 2 days prior to imaging. It was determined from previous experiments that for the fraction of labeled cells achieved in vivo with this protocol (∼1 to 3%), there was negligible absorption interference of the dye with the spectral data obtained for hemoglobin saturation in the wavelength range employed 40 (500 to 575 nm).
Thrombosis Experiments
Imaging of thrombus formation was performed as part of experiments to test the antithrombotic activity of an angiotensin-converting enzyme 2 (ACE2) activator compounds to stimulate purported antithrombotic activity of the ACE2∕angiotensin-(1-7)∕Mas axis.41, 42 Vascular injury and thrombus formation were artificially induced to demonstrate the effect of the compounds by visualizing platelet adhesion and thrombus formation in real time.
Dorsal skin-fold window chambers were surgically implanted on male athymic nude mice (nu∕nu) of 9 to 10 weeks of age (Harlan Sprague Dawley, Indianapolis, Indiana) as previously described except that a coverslip was not installed for these terminal experiments. The jugular vein was cannulated for intravenous access. The exposed subdermal skin of the window chamber was maintained under warm saline (37 °C) throughout the experiment. A bolus of 300 μL of carboxyfluorescein diacetate succinimidyl ester (Invitrogen, Carlsbad, California) was injected via the cannulated jugular vein to visualize platelets. The nonfluorescent precursor is taken up by platelets and somewhat by leukocytes where it forms the stable and highly fluorescent fluorophore carboxyfluorescein succinimidyl ester (CFSE) in the cells by intracellular cleavage of the acetate groups. The approximate excitation and emission peaks of CFSE are 492 and 517 nm, respectively.
A vessel of interest with a 70- to 200-μm diameter was selected on the basis of unrestricted blood flow and location in the vessel network. Thrombus formation was induced using a protocol similar to Katayama et al.43 via topical application for 2 min of 5% FeCl3-soaked paper (3×3 mm) placed on the exposed subdermal skin region containing the vessel of interest. The piece of paper was removed after 2 min and the window was washed twice with warm saline. Thrombus formation was monitored in real time by fluorescence and spectral imaging. Fluorescence video images were acquired every minute for 20 s at a 30-frames∕s rate with an electron-multiplying CCD camera (Andor Technology, South Windsor, Connecticut) and a spectral imaging data set for hemoglobin saturation measurements was acquired once every minute, as described previously. Imaging sessions lasted for 20 to 25 min.
Results
Tumor Microvascular Acute Oxygenation Fluctuations
Abnormal tumor microvasculature with compromised oxygen transport is known to be a major cause of hypoxia in tumors.5, 44, 45 The biology of tumor cells may be different depending on whether they are exposed to chronic hypoxia or acute hypoxia with subsequent reoxygenation.46 Acute fluctuations in blood flow and oxygen supply that are significant enough to cause hypoxia are becoming more appreciated for their effects on tumor biology and therapy as even relatively short hypoxic episodes can have a potentially profound effect.47, 48 For example, it has been recently reported that tumor metastases have a higher fraction of acutely hypoxic cells than chronically hypoxic cells, implying that acutely hypoxic cells have a higher metastatic potential and greater probability of impact on therapeutic response.49
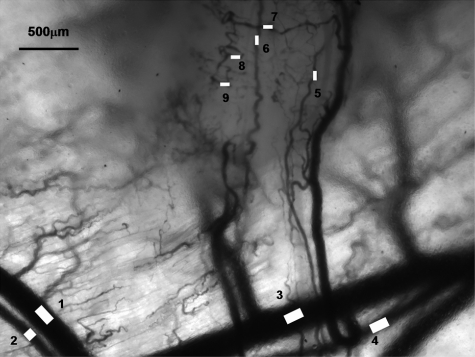
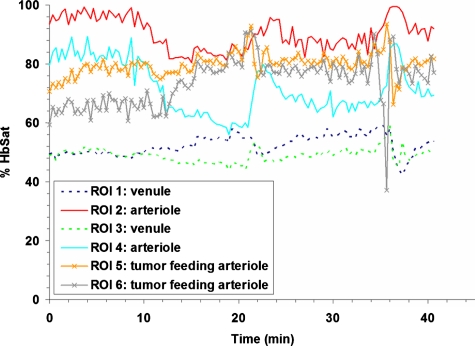
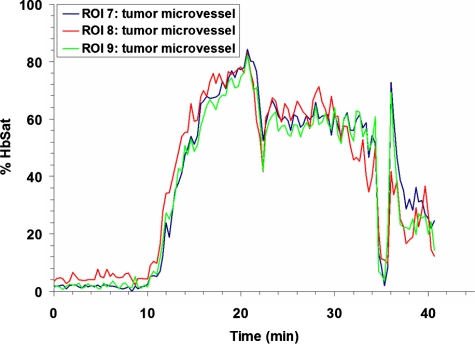
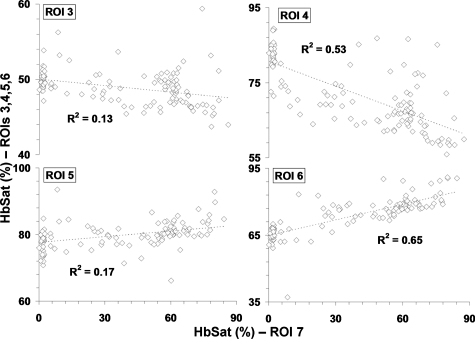
Research to characterize acute fluctuations in tumor microvessel oxygenation and perfusion requires advanced imaging techniques with microvessel resolution.50 Spectral imaging of tumor microvessel oxygenation may be a useful tool in this effort. We previously showed that spectral imaging could be used to measure acute fluctuations in tumor microvessel oxygenation.34 We further demonstrate here how spectral imaging can document extreme acute fluctuations in tumor microvessel oxygenation and reveal an apparent sensitivity in a tumor microvessel network to supply vessel oxygenation fluctuations. Figure 1 shows a 4TO7 tumor with a diameter of 1.5 to 2.0 mm 9 days after implantation of cells. The regions of interest (ROIs) chosen for HbSat measurement are indicated in the figures by numbered white squares. ROIs 2 and 4 are nearby arterioles and ROIs 1 and 3 are on nearby venules. ROIs 5 and 6 are located on tumor feeding arterioles, while ROIs 7 to 9 connected to a tumor draining venule that is a branch of the venule marked with ROI 3. HbSat for the ROIs, measured every 20 s for 43 min, is shown in Figs. 23. The data points are connected by straight line segments with the data points omitted for clarity. We can see in Fig. 2 that the arterioles adjacent to ROIs 2 and 4 have slow relatively large magnitude fluctuations that appear to be temporally correlated. The venules adjacent to ROIs 1 and 3 have smaller fluctuations and a lower and relatively stable oxygenation compared to the arterioles. The tumor-feeding arteriole marked ROI 6 had an abrupt deoxygenation episode that occurred around the 35-min observation time. In Fig. 3, extreme oxygenation fluctuations are seen in the vessels marked with ROIs 7 to 9. At ROI 7, for example, the HbSat over the observation period ranges from less than 1 to about 84%. The abrupt deoxygenation episode seen in the tumor-feeding arteriole with ROI 6 is also reflected in ROIs 7 to 9, which may indicate a connection somewhere in the tumor between these microvessels. Using the vessel with ROI 7 as representative of the group of vessels with ROIs 7 to 9, a pairwise comparison of the HbSat measurements at the various time points was made to vessels with ROIs 3 to 6, as shown in Fig. 4. A line was fit to the data in each comparison to gauge the correlation in the measurements. As we can see in the figures, the strongest correlations occurred with the tumor-feeding arteriole ROI 6 vessel (R2=0.65) and the nearby adjacent arteriole ROI 4 (R2=0.53), although the correlations were in opposite directions (positive with the ROI 6 tumor-feeding arteriole, negative with the ROI 4 adjacent arteriole). The correlation of the fluctuations with the other vessels (ROIs 3 and 4) was relatively weak (R2<0.2). The arteriole feeding branch ROI 6 is closest to the tumor microvessels marked ROIs 7 to 9, therefore it may be expected to have the strongest influence on these vessels and consequently the strongest correlation. The inverse correlation between the tumor microvessels ROIs 7 to 9 and the arteriole ROI 3 that supplies the tumor-feeding arteriole ROI 6 was possibly due to dynamic changes in the distribution of blood flow from the main arteriole ROI 3 to the tumor-feeding branch ROI 6, as more blood was diverted to the tumor feeding branch ROI 6, less was available in the arteriole ROI 3, and the respective vessel oxygenations changed accordingly. These results demonstrate that fluctuations in microvessel oxygenation with the potential to cause hypoxia can occur in tumors of a relatively small size. The results also suggest that a potential source of instability in tumor microvessel oxygenation may be due to an exaggerated response in the tumor vessels to oxygenation fluctuations in the tumor supply vessels. Gaustad et al. showed that tumor-feeding vessels can have a significant influence on local perfusion of tumor microvessel network regions,51 thus, some correlation between tumor supply vessels and regions of tumor microvessel networks could be expected. In previous publications, we showed that in tumors there could be direct connections between well and poorly oxygenated microvessels.34, 52 If these connections were present in the tumors used in this study, then it is possible that dynamic changes in blood flow through these connections contributed to the large swings in microvessel oxygenation.
Figure 1.
Transmitted light image of a 4TO7 tumor and adjacent normal tissue. ROIs for HbSat measurements in Figs. 234 are marked with the image. ROI 1, venule; ROI 2, arteriole; ROI 3, venule; ROI 4, arteriole; ROI 5, tumor feeding arteriole; ROI 6, tumor feeding arteriole; ROIs 7 to 9, tumor microvessels.
Figure 2.
HbSat in ROIs 1 to 6 in Fig. 1. Measurements were acquired every 20 seconds for 43 minutes. Data points are omitted for clarity.
Figure 3.
HbSat in ROIs 7 9 in Fig. 1. Measurements were acquired every 20 s for 43 min. Data points are omitted for clarity.
Figure 4.
Plot of vessel with ROI 7 HbSat measurements (abscissas) versus vessels with ROIs 3 to 6 (ordinates) in Fig. 1 for the time points over the 43-min imaging session with data sets acquired every 20 s. The specific ROI being compared to ROI 7 is indicated in each graph. A line was fit to the data to gauge the correlation between the oxygenation in the vessels and R2 values of the linear fit are indicated in the figure.
Arteriovenous Malformations
Arteriovenous (AV) anastomoses are direct connections between the arterial and venous circulation without an intervening capillary bed. These connections can be created surgically in larger vessels for a therapeutic purpose such as assistance in the treatment of hemodialysis patients.53 AV anastomoses are naturally present in the microcirculation of some normal tissues with highly variable blood flow, such as skin54 and nasal mucosa,55 but they can also arise pathologically as part of a disease process. Tumor microvasculature can develop a substantial number of pathological AV anastomoses.56 A high percentage of HHT patients can develop AVMs in the brain, lungs, liver, and gastrointestinal tract that can potentially rupture with devastating consequences.57, 58 In addition to these visceral AVMs, a majority of HHT patients develop telangiectases in mucocutaneous areas, such as the nasal cavity, that result in spontaneous nose bleeding.59
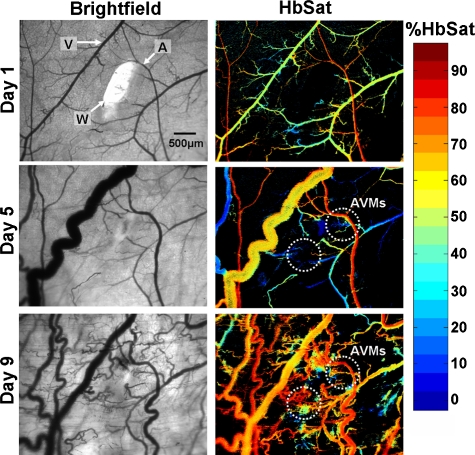
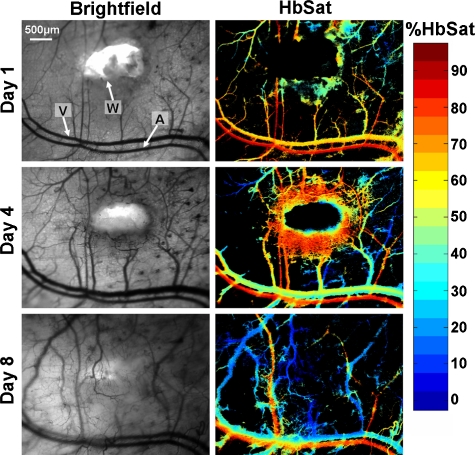
To study the development of skin AVMs, we developed a mouse model using the Alk1 gene by intercrossing ROSA26CreER∕+ mice with Alk1-conditional knockout (Alk12f∕−) mice.38 We have shown that a wound can induce de novo AVMs in its surroundings in adult ROSA26CreER∕+;Alk12f∕− mice (Alk1 mutants hereafter) administered with tamoxifen. Figure 5 shows AVM development at selected time points stimulated by wound healing in the Alk1 mutants. The regions where two AVMs form are indicated in the figure. Venules near the wound had increased oxygenation and diameters after surgery due to AVM formation. Veins and venules, the most distensible of the blood vessels, are sensitive to pressure changes and can markedly dilate with small increases in pressure.60 The increase in venule oxygenation was observed prior to the appearance of a clearly identifiable AVM with brightfield or spectral imaging. Confirmation of a direct connection between arterioles and venules through AVMs was obtained by tracking the flow of fluorescently labeled RBCs administered via tail vein injection after spectral imaging. Tracking fluorescently labeled RBCs also enabled visualization of the earliest connections between arterioles and venules through sprouting vessels that eventually formed AVMs, suggesting that the vascular changes seen in the brightfield and spectral images were induced by these connections. In the Alk1 mutants, relatively few nascent sprouts developed at the perimeter of the wound. There was extensive formation of stable AVMs that resulted in significant changes in the microvasculature adjacent to the wound, including major arterioles and venules, that persisted after the wound had healed. Wound healing occurred within the same time frame as control animals. Figure 6 shows wound healing at selected time points in control animals with functional Alk-1. Extensive formation of nascent sprouts occurred around the periphery of wounds in control animals during wound healing, but they subsided after the wound was healed. There were minor changes in the oxygenation and morphology of major vessels and after wound healing the microvasculature returned to a more normal state. In contrast to the Alk-1 deletion mice, no AVMs formed in control mice and venule oxygenation in control mice was less than in Alk-1 deletion animals. This point is illustrated in Table 1. Arteriole and venule ROIs were evaluated on different days (n=9 for Alk-1 deletion, n=7 for control). The ROIs were located in areas near the arrow heads identifying the different vessels in Figs. 56. For the mice in the figures, the arterioles had similar average saturations throughout the observation period but the Alk-1 deletion mice had statistically higher venule saturation (see Table 1).
Figure 5.
AVM development in a conditional Alk1 deletion mouse (ROSA26CreER∕Alk12f∕−) stimulated by a wound, where A, arteriole; V, venule; and W, wound. The left column shows transmitted light images and the right column shows HbSat images. Region where AVMs formed is indicated in the day 5 and day 9 images. At day 5, the AVM connections were not obvious but clear changes in venule oxygenation could be seen due to the AVMs. The arrowheads indicating the arteriole and venule also indicate regions of interest where HbSat measurements were obtained.
Figure 6.
Wound healing in a control mouse: A, arteriole; V, venule; and W, wound. The left column shows transmitted light brightfield images and the right column shows HbSat images. The arrowheads indicating the arteriole and venule also indicate regions of interest where HbSat measurements were obtained. Unlike the conditional Alk1 deletion mouse in Fig. 5, no AVMs formed during wound healing.
Table 1.
Comparison of arteriole and venule average saturation in a mouse model of HHT during wound healing.
Mean±st dev
Not statistically significant
Statistically significant (t test, p<0.005)
Thromboses and Microvascular Occlusions
Blood vessel occlusions due to thrombus formation can occur in disease and pathophysiological processes. In cardiovascular disease, the eruption of an atherosclerotic plaque can initiate arterial thrombus formation leading to myocardial infarction.61 There can be a risk of deep vein thrombosis formation after some types of surgery or trauma, or in patients with various disorders of the coagulation system.62 Imaging of microvasculature in preclinical models can potentially be useful for testing and evaluation of new thrombolytic drugs to dissolve thrombi or thromboprophylaxis agents aimed at preventing thrombus formation.
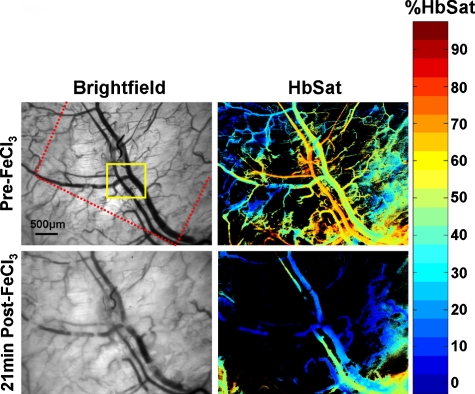
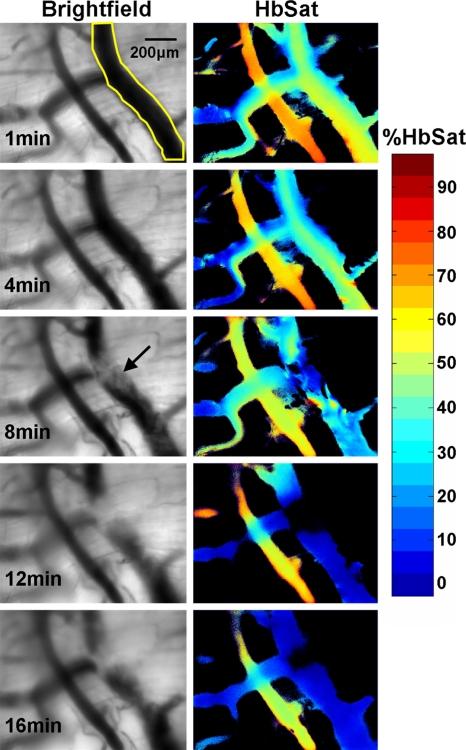
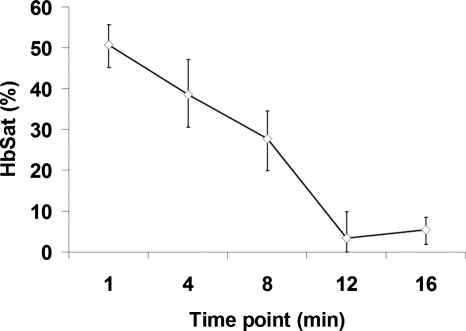
Dorsal skin-fold window chambers were used with spectral imaging as part of an investigation into the antithrombotic activity of a novel ACE2 activating agent.63 Figure 7 shows brightfield and HbSat images of a region of tissue in a mouse immediately prior to and 21 min after thrombus formation initiated by topical application of FeCl3. The FeCl3 was applied to the tissue with a piece of paper soaked with the solution (dotted outline in Fig. 7). Venous thrombi gradually formed over approximately 20 min, resulting in a decreased oxygenation in the venules due to restricted and occluded blood flow. Figure 8 shows time series images of the region outlined by the small box in Fig. 7, showing the gradual decrease in oxygenation of the venule as thrombi form over time. The HbSat values of the indicated region in Fig. 8 at several time points are shown in Fig. 9. Thrombus formation was independently confirmed by the accumulation of fluorescently labeled platelets throughout the venules. Spectral imaging revealed the microvessel network oxygenation changes due to thrombi formation in the venules.
Figure 7.
Brightfield and HbSat images are shown before and 21 minutes after topical application of FeCl3 to induce thrombus formation. The red dotted line in the top left image indicates where the border of the paper soaked with FeCl3 was relative to the image area. The yellow box indicates the region shown in the images in Fig. 8 at higher magnification. (Color online only.)
Figure 8.
Brightfield and HbSat time sequence images of thrombus development for the region indicated by the yellow box in Fig. 7. The yellow outlined area on the venule in the top left image indicates the ROI used for the HbSat measurements shown in Fig. 9. The arrow in the brightfield image at the 8-min time point indicates a forming thrombus. (Color online only.)
Figure 9.
Plot of the HbSat in the ROI indicated in Fig. 8 at various time points during thrombus development. The data points in the figure are given as the median±interquartile range for the ROI.
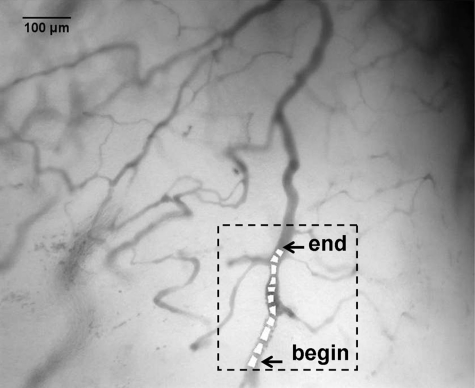
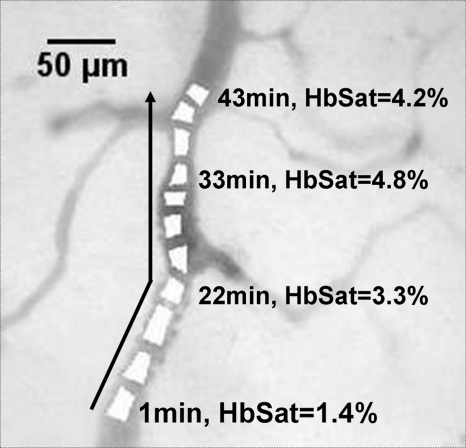
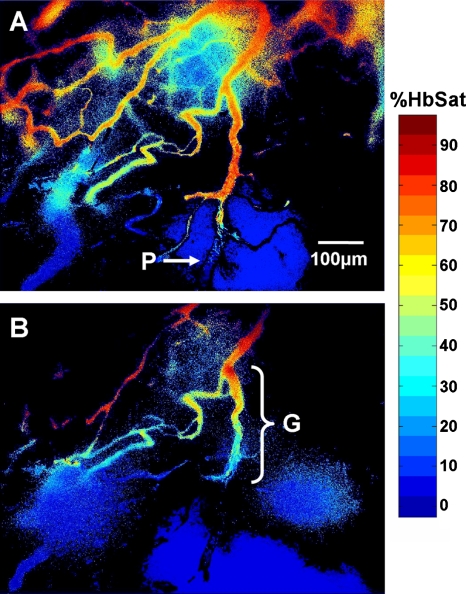
Complete cessation of blood flow in a vessel is an extreme example of intermittent blood flow that can occur in tumors. While changes in blood flow without complete cessation of flow are probably more common and important causes of fluctuating tumor oxygenation and hypoxia than complete vascular stasis,47, 64, 65 total cessation of blood flow in tumor vessels does occur. Spontaneous occlusions in tumor microvessels can be dynamic structures that grow within the occluded vessel and affect blood flow to surrounding vessels and regions, as demonstrated in Figs. 101112. In Fig. 10 is a vessel network from a 4TO7 tumor in which a spontaneous occlusion formed due to a plug of RBCs. Simultaneous imaging of exogenously administered fluorescently labeled RBCs in this mouse confirmed the existence of the occlusion due to stoppage of RBC flux. Changes in the occlusion and the subsequent effect on the vessel network were observed for 1 h with spectral imaging hemoglobin saturation data sets acquired every minute. The RBC plug that formed in the indicated vessel in Fig. 10 was a dynamic structure that expanded during the observation period and grew along the main occluded vessel in a direction counter to the blood flow direction in the vessel. Dynamic growth and expansion of the plug was differentiated from movement and propagation of the plug because the plug front advanced against the direction of blood flow rather than moving along with it. Also, observation of fluorescently labeled RBCs indicated a gradual accumulation of the flowing cells at the plug front, resulting in expansion of the front against the direction of blood flow as RBCs impinged on the plug. The movement of the plug front is shown in more detail in Fig. 11. There was a sharp gradient in HbSat along the vessel in the region of the RBC plug with the lowest HbSat in and beyond the plug region. The plug front border was chosen by identifying an area within the gradient where the HbSat first decreased to a level less than 5%. Figure 12 shows HbSat images of the network at 5 and 60 min into the observation period. A steep hemoglobin saturation gradient can be seen in the occluded vessel in the vicinity of the plug in the figure (G in Fig. 12). The plug front advanced about 200 μm during the observation period. The growth of the occlusion had consequences for side branches of the main vessel. At the beginning of the observation period, the side branches were functional, but eventually expansion of the plug obstructed these vessels, cutting off blood flow. The oxygenation of the branching vessels steadily decreased over the observation period. The vessel in which the RBC plug formed appeared to be a major supply vessel for the local region with several different branches supplying adjacent networks on either side of the main vessel. The global decrease in HbSat in the field of view may have been the result of the expanding plug cutting off blood flow to some of these side branches that supplied adjacent networks, and a lack of redundant microvessels to perfuse the immediate region from other feeding vessels. These results demonstrate how spontaneous microvascular RBC occlusions that occur in tumors can impact not only the distal network vessels supplied by the occluded vessel but also proximal side branches due to the dynamic nature of the occlusion.
Figure 10.
Tumor microvessel network in which a spontaneous RBC occlusion formed during imaging. Within the highlighted region is the vessel with the occlusion. The vessel is marked with several ROIs that were used to determine the apparent location of the occlusion front as it moved during the imaging session. The location of the occlusion front at the beginning and end of the imaging session are indicated in the figure. The highlighted region with the occluded vessel is shown in more detail in Fig. 11.
Figure 11.
Detail of highlighted region in Fig. 10 showing the progression of the RBC occlusion front during the imaging session (arrow). The RBC occlusion front progressed counter to the direction of blood flow in the vessel. The occlusion front was chosen by identifying an area within the HbSat gradient in the occlusion vicinity where the HbSat decreased to a level less than 5%. The HbSat values of several ROIs on the apparent occlusion front at different time points are indicated in the figure.
Figure 12.
Hemoglobin saturation maps of the tumor microvessel network in Fig. 10 at two different time points. The images were taken at (a) 5 and (b) 60 min into the imaging session. The plug (P) is indicated in (a). Note the sharp change in vessel oxygenation at the plug relative the perfused region upstream of the occlusion. A steep vessel oxygenation gradient (G) is seen in near the plug as the plug advances in the vessel in (b).
Discussion
A number of optical techniques, some with 3-D imaging capabilities, can be used to measure some aspect of microvascular function. Two-photon microscopy (TPM) can be used with fluorescent and phosphorescent dyes to measure microvascular oxygen tension66 (pO2) and blood velocity.15 Laser Doppler and laser speckle contrast imaging can provide wide-field relative measurements of microvessel perfusion.18, 67, 68 OCT can provide absolute blood velocity and volume flow measurements,23, 24, 69 as well as microvessel hematocrit measurements30 and relative saturation.29 Photoacoustic tomography can be used to image microvasculature and measure HbSat to depths of up to 3 mm in tissue.22, 70
Spectral imaging has some advantages and limitations for measuring microvessel oxygenation compared to other optical imaging techniques. Phosphorescence lifetime imaging methods require use of exogenous dyes that can have physiological side effects or measurement artifacts,71 while spectral imaging makes use of endogenous hemoglobin absorption. Photoacoustic imaging methods require physical contact with the specimen to be imaged, which may not be possible or appropriate in some cases, while spectral imaging is noncontact. Unlike spectral imaging, current OCT measurements of HbSat cannot be related to an absolute scale of saturation. A limitation of spectral imaging is that primarily it is a superficial imaging technique. Binzoni et al.72 used a Monte Carlo multilayered skin photon propagation model with water, hemoglobin, melanin, and fat as absorbers to estimate depth limitations of spectral imaging in the wavelength range of 600 to 1000 nm. Other optical properties were assumed constant except for the hypodermis layer in which a published model of wavelength-dependent scattering was used. The results of the model indicated that while the presence of certain objects may be detected to depths of several hundred micrometers or more, practical, direct, high-resolution imaging of imbedded objects is limited to a depth on the order of tens of micrometers at best. Thus, only relatively superficial microvessels can be expected to be imaged accurately, which may restrict in vivo spectral imaging of microvessel HbSat to window models or other specific cases. Besides dorsal skin-fold windows, spectral imaging of microvasculature has been applied to brain windows37 and can potentially be applied to other windows, such as mammary windows,73 or situations where microvasculature can be directly imaged, such as exteriorized mesentery tissue.32 Another limitation of spectral imaging is that it is not well suited for imaging very rapid dynamic events. The area to be imaged must be relatively stable during the spectral imaging data acquisition time as most spectral imaging systems and instruments require spatial, spectral, or temporal scanning to acquire a complete data set. Thus, spectral imaging of dynamic events with temporal resolution on the order of milliseconds is beyond the capabilities of most common spectral imaging instruments. A number of different strategies have been investigated to perform spectral imaging of rapidly changing dynamic events. These strategies include filtered subarray imaging,74 computed tomographic imaging spectrometer data capture and processing,75 and compressive spectral imaging with a binary coded aperture.76, 77 Each of these techniques has its own advantages and limitations.
One of the major functions of the microvasculature is the transport and delivery of oxygen to tissues with oxygen exchange occurring in capillaries,78 precapillary arterioles,79 and postcapillary venules.80 Spectral imaging can be useful for assessment of microvessel oxygenation from hemoglobin absorption spectra for measurement of percent hemoglobin saturation. In this paper, we demonstrate how the relatively simple optical technique of spectral imaging of hemoglobin saturation can be a useful tool to provide novel insights into microvessel oxygen transport function in various preclinical model systems.
Acute episodes of hypoxia activate numerous tumor cell pathways, in particular those controlled by the hypoxia-inducible factor 1 (HIF-1) promoter, and these pathways enhance tumor cell survivability and treatment resistance.81 Constantly fluctuating tumor oxygenation appears to be a defining characteristic of the tumor microenvironment82 that may have important clinical ramifications in terms of patient prognosis and tumor metastatic potential.49 Acute oxygen fluctuations are caused in large measure by a variety factors related to abnormal tumor microvasculature structure and function.81 Recent data suggests that cyclic fluctuations in regional tumor oxygenation are more important than classically described chronic hypoxia in terms of tumor biology and therapy.49, 83 The data presented in this paper in Figs. 1234 demonstrate the extremes in acute oxygenation changes that a group of microvessels can undergo, and the apparent sensitivity of the fluctuations to nearby supply vessels. Using a novel optical imaging technique to measure perfusion variations in terms of “blood supply time” in tumors referenced to tumor feeding arteries,84 Gaustad et al.51 demonstrated that the morphology of the tumor-feeding arteries had a large and measurable effect on the tumor blood supply in local tumor microvessel regions. Spectral imaging combined with this technique may help measure how these tumor-feeding vessel perfusion effects also influence the oxygenation of local tumor microvessel networks.
Spectral imaging in a mouse model of HHT in Figs. 56 and Table 1 document the consequences of AVM development in real time. Microvessel oxygenation changes during AVM development indicated that AVM formation occurred at early time points following angiogenesis stimulation by wound creation, and suggested that the formation of the AVM induced changes in microvascular morphology and function, particularly in the venules. Venules connected to arterioles through AVMs rapidly became dilated and hyperoxygenated compared to normal venules. The changes in venule oxygenation were frequently apparent prior to the appearance of a clearly identifiable AVM. This is important because previous histologic examination of tissue specimens suggested85, 86 that the opposite was the case—that dilation of microvessels initiated or at least preceded development of AVMs. A clearer understanding of the causes and consequences of AVM formation and tracking the timing of AVM formation may aid in the development of therapies to better treat diseases that exhibit this pathology. Our imaging technique may aid in understanding the causes of AVM formation and other vascular pathologies at the molecular and genetic level using genetically altered mouse models such as the one employed in this study. A more detailed description of the animal model and characterization experiments with this model can be found in a paper by Park et al.87
Dangerous and debilitating thrombus formation can be caused by pathological conditions such as diabetes, hypertension, and atherosclerosis.88 Thrombi induced from these and similar pathological conditions can result in strokes, pulmonary emboli, and deep venous thrombi among other conditions.88 Spectral imaging of hemoglobin saturation showed the gradual formation of chemically induced thrombi and the effects of the thrombi on microcirculation oxygenation in Figs. 789. The time for thrombus formation and complete microvessel occlusion could be measured from these experiments, and these data may provide additional information besides systemic physiological measurements with which to assess local microvessel physiology during a thrombotic event. Real-time imaging of thrombus formation and changes in microvascular oxygenation can aid in the development and comparison of new therapeutic agents designed to treat pathological thrombi by revealing subtle differences in the timing and magnitude of drug action on the microvessel physiological response and thrombus formation.
Changes in tumor microvascular blood flow without complete cessation of flow are probably more common and important causes of fluctuating tumor oxygenation and hypoxia than complete vascular stasis.47, 64, 65 However, complete cessation of blood flow in a vessel is an extreme example of intermittent blood flow. In this paper, we demonstrated that spontaneous occlusions in tumor microvessels can be dynamic structures that grow within the occluded vessel to affect blood flow to surrounding vessels and regions. The RBC plug shown in Figs. 101112 grew against the direction of blood flow in the vessel for a length of at least 200 μm during the observation period. Blood flow to surrounding regions was eventually diminished and cut off as the plug passed the branching vessels that supplied these areas, and a steep microvessel oxygenation gradient was observed in the immediate vicinity of the RBC plug. Hypoxia can increase mechanical stiffness of RBCs, thus increasing blood viscosity,81 and this process may help create RBC plugs that cause intermittent cessation of local tumor blood flow.
While spectral imaging can be used as a single imaging modality to obtain microvascular oxygenation information, it can also be employed as a component of a multimodality imaging system in combination with other optical techniques to obtain more detailed microvessel functional information. Spectral imaging has been combined with laser speckle contrast imaging for measurement of dynamic changes in rat cerebral blood flow and oxygenation to identify local regions of activation in response to an external stimulus.19 Spectral imaging has been combined with OCT to enable correlations between microvessel oxygenation and blood flow36 (velocity, volume, and shear rate). Microvessel convective oxygen mass transport is a function of several hemodynamic parameters including hemoglobin oxygen carrying capacity, percent saturation, and RBC flux in a vessel.89, 90 In a previous study, we combined spectral imaging with fluorescence video measurements of RBC flux to obtain microvessel convective oxygen mass transport measurements.40
In conclusion, spectral imaging of microvasculature in preclinical models can yield measurements of microvessel hemoglobin saturation that can provide novel insights in a variety of model systems. While useful as a single imaging modality, spectral imaging is also being combined with other modalities to provide even more detailed measurements of microvessel function. Such combinations may provide new insights into various diseases processes and measurements of the effects of new therapies to treat them.
Acknowledgments
Funding for this work was provided in part by the National Institutes of Health (NIH) Grant No. HL64024 to SPO.
References
- Perry B. N. and Arbiser J. L., “The duality of angiogenesis: implications for therapy of human disease,” J. Invest. Dermatol. 126, 2160–2166 (2006). 10.1038/sj.jid.5700462 [DOI] [PubMed] [Google Scholar]
- Otrock Z. K., Mahfouz R. A. R., Makarem J. A., and Shamseddine A. I., “Understanding the biology of angiogenesis: review of the most important molecular mechanisms,” Blood Cells Mol. Dis. 39, 212–220 (2007). 10.1016/j.bcmd.2007.04.001 [DOI] [PubMed] [Google Scholar]
- Carmeliet P. and Jain R. K., “Angiogenesis in cancer and other diseases,” Nature 407, 249–257 (2000). 10.1038/35025220 [DOI] [PubMed] [Google Scholar]
- Dewhirst M. W., “Angiogenesis and blood flow in solid tumors,” in Drug Resistance in Oncology, Teicher B. A., Ed., pp. 3–23, Marcel Dekker, New York: (1993). [Google Scholar]
- Warren B. A., “The vascular morphology of tumors,” in Tumor Blood Circulation: Angiogenesis, Vascular Morphology and Blood Flow of Experimental and Human Tumors, Peterson H.-I., Ed., pp. 1–47, CRC Press, Inc., Boca Raton, FL: (1979). [Google Scholar]
- Simons M., “Angiogenesis, arteriogenesis, and diabetes—paradigm reassessed?” J. Am. Coll. Cardiol. 46, 835–837 (2005). 10.1016/j.jacc.2005.06.008 [DOI] [PubMed] [Google Scholar]
- Martin A., Komada M. R., and Sane D. C., “Abnormal angiogenesis in diabetes mellitus,” Med. Res. Rev. 23, 117–145 (2003). 10.1002/med.10024 [DOI] [PubMed] [Google Scholar]
- Carvalho J. F., Blank M., and Shoenfeld Y., “Vascular endothelial growth factor (VEGF) in autoimmune diseases,” J. Clin. Immunol. 27, 246–256 (2007). 10.1007/s10875-007-9083-1 [DOI] [PubMed] [Google Scholar]
- Bainbridge J., Sivakumar B., and Paleolog E., “Angiogenesis as a therapeutic target in arthritis: lessons from oncology,” Curr. Pharm. Des. 12, 2631–2644 (2006). 10.2174/138161206777698747 [DOI] [PubMed] [Google Scholar]
- Azfar R. S. and Gelfand J. M., “Psoriasis and metabolic disease: epidemiology and pathophysiology,” Curr. Opin. Rheumatol. 20, 416–422 (2008). 10.1097/BOR.0b013e3283031c99 [DOI] [PMC free article] [PubMed] [Google Scholar]
- Gargiulo P., Giusti C., Pietrobono D., La Torre D., Diacono D., and Tamburrano G., “Diabetes mellitus and retinopathy,” Dig. Liver Dis. 36(Suppl. 1), S101–S105 (2004). 10.1016/j.dld.2003.11.016 [DOI] [PubMed] [Google Scholar]
- Wegewitz U., Göhring I., and Spranger J., “Novel approaches in the treatment of angiogenic eye disease,” Curr. Pharm. Des. 11, 2311–2330 (2005). 10.2174/1381612054367292 [DOI] [PubMed] [Google Scholar]
- O’goshi K.-I. and Serup J., “Safety of sodium fluorescein for in vivo study of skin,” Skin Res. Technol. 12, 155–161 (2006). 10.1111/j.0909-752X.2006.00147.x [DOI] [PubMed] [Google Scholar]
- Werkmeister E., Kerdjoudj H., Marchal L., Stoltz J. F., and Dumas D., “Multiphoton microscopy for blood vessel imaging: new non-invasive tools (Spectral, SHG, FLIM),” Clin. Hemorheol Microcirc 37, 77–88 (2007). [PubMed] [Google Scholar]
- Schaffer C. B., Friedman B., Nishimura N., Schroeder L. F., Tsai P. S., Ebner F. F., Lyden P. D., and Kleinfeld D., “Two-photon imaging of cortical surface microvessels reveals a robust redistribution in blood flow after vascular occlusion,” PLoS Biol. 4, e22 (2006). 10.1371/journal.pbio.0040022 [DOI] [PMC free article] [PubMed] [Google Scholar]
- Reyes-Aldasoro C. C., Wilson I., Prise V. E., Barber P. R., Ameer-Beg M., Vojnovic B., Cunningham V. J., and Tozer G. M., “Estimation of apparent tumor vascular permeability from multiphoton fluorescence microscopic images of P22 rat sarcomas in vivo,” Microcirculation (N.Y.) 15, 65–79 (2008). 10.1080/10739680701436350 [DOI] [PubMed] [Google Scholar]
- Fu D., Matthews T. E., Ye T., Piletic I. R., and Warren W. S., “Label-free in vivo optical imaging of microvasculature and oxygenation level,” J. Biomed. Opt. 13, 040503 (2008). 10.1117/1.2968260 [DOI] [PubMed] [Google Scholar]
- Choi B., Kang N. M., and Nelson J. S., “Laser speckle imaging for monitoring blood flow dynamics in the in vivo rodent dorsal skin fold model,” Microvasc. Res. 68, 143–146 (2004). 10.1016/j.mvr.2004.04.003 [DOI] [PubMed] [Google Scholar]
- Dunn A. K., Devor A., Bolay H., Andermann M. L., Moskowitz M. A., Dale A. M., and Boas D. A., “Simultaneous imaging of total cerebral hemoglobin concentration, oxygenation, and blood flow during functional activation,” Opt. Lett. 28, 28–30 (2003). 10.1364/OL.28.000028 [DOI] [PubMed] [Google Scholar]
- Kolkman R. G. M., Klaessens J. H. G. M., Hondebrink E., Hopman J. C. W., de Mul F. F. M., Steenbergen W., Thijssen J. M., and van Leeuwen T. G., “Photoacoustic determination of blood vessel diameter,” Phys. Med. Biol. 49, 4745–4756 (2004). 10.1088/0031-9155/49/20/006 [DOI] [PubMed] [Google Scholar]
- Wang X., Ku G., Wegiel M. A., Bornhop D. J., Stoica G., and Wang L. V., “Noninvasive photoacoustic angiography of animal brains in vivo with near-infrared light and an optical contrast agent,” Opt. Lett. 29, 730–732 (2004). 10.1364/OL.29.000730 [DOI] [PubMed] [Google Scholar]
- Wang X., Xie X., Ku G., Wang L. V., and Stoica G., “Noninvasive imaging of hemoglobin concentration and oxygenation in the rat brain using high-resolution photoacoustic tomography,” J. Biomed. Opt. 11, 024015 (2006). 10.1117/1.2192804 [DOI] [PubMed] [Google Scholar]
- Hitzenberger C. K., Trost P., Lo P.-W., and Zhou Q., “Three-dimensional imaging of the human retina by high-speed optical coherence tomography,” Opt. Express 11, 2753–2761 (2003). [DOI] [PubMed] [Google Scholar]
- Izatt J. A., Kulkarni M. D., Yazdanfar S., Barton J. K., and Welch A. J., “In vivo bidirectional color Doppler flow imaging of picoliter blood volumes using optical coherence tomography,” Opt. Lett. 22, 1439–1441 (1997). 10.1364/OL.22.001439 [DOI] [PubMed] [Google Scholar]
- Michaely R., Bachmann A. H., Villiger M. L., Blatter C., Lasser T., and Leitgeb R. A., “Vectorial reconstruction of retinal blood flow in three dimensions measured with high resolution resonant Doppler Fourier domain optical coherence tomography,” J. Biomed. Opt. 12, 041213 (2007). 10.1117/1.2771553 [DOI] [PubMed] [Google Scholar]
- Faber D. J., Mick E. G., Aalders M. C. G., and van Leeuwen T. G., “Toward assessment of blood oxygen saturation by spectroscopic optical coherence tomography,” Opt. Lett. 30, 1015–1017 (2005). 10.1364/OL.30.001015 [DOI] [PubMed] [Google Scholar]
- Faber D. J., Mik E. G., Aalders M. C. G., and van Leeuwen T. G., “Light absorption of (oxy)-hemoglobin assessed by spectroscopic optical coherence tomography,” Opt. Lett. 28, 1436–1438 (2003). 10.1364/OL.28.001436 [DOI] [PubMed] [Google Scholar]
- Lu C.-W., Lee C.-K., Tsai M.-T., Wang Y.-M., and Yang C. C., “Measurement of the hemoglobin oxygen saturation level with spectroscopic spectral-domain optical coherence tomography,” Opt. Lett. 33, 416–418 (2008). 10.1364/OL.33.000416 [DOI] [PubMed] [Google Scholar]
- Kagemann L., Wollstein G., Wojtkowski M., Ishikawa H., Townsend K. A., Gabriele M. L., Srinivasan V. J., Fujimoto J. G., and Schuman J. S., “Spectral oximetry assessed with high-speed ultra-high resolution optical coherence tomography,” J. Biomed. Opt. 12, 041212 (2007). 10.1117/1.2772655 [DOI] [PMC free article] [PubMed] [Google Scholar]
- Iftimia N. V., Hammer D. X., Bigelow C. E., Rosen D. I., Ustun T., Ferrante A. A., Vu D., and Ferguson R. D., “Toward noninvasive measurement of blood hematocrit using spectral domain low coherence interferometry and retinal tracking,” Opt. Express 14, 3377–3388 (2006). 10.1364/OE.14.003377 [DOI] [PubMed] [Google Scholar]
- Mariampillai A., Standish B. A., Moriyama E. H., Khurana M., Munce N. R., Leung M. K. K., Jiang J., Cable A., Wilson B. C., Vitkin A., and Yang V. X. D., “Speckle variance detection of microvasculature using swept-source optical coherence tomography,” Opt. Lett. 33, 1530–1532 (2008). 10.1364/OL.33.001530 [DOI] [PubMed] [Google Scholar]
- Styp-Rekowska B., Disassa N. M., Reglin B., Ulm L., Kuppe H., Secomb T. W., and Pries A. R., “An imaging spectroscopy approach for measurement of oxygen saturation and hematocrit during intravital microscopy,” Microcirculation (N.Y.) 14, 207–221 (2007). 10.1080/10739680601139302 [DOI] [PubMed] [Google Scholar]
- Kobayashi H. and Takizawa N., “Imaging of oxygen transfer among microvessels of rat cremaster muscle,” Circulation 105, 1713–1719 (2002). 10.1161/01.CIR.0000013783.63773.8F [DOI] [PubMed] [Google Scholar]
- Sorg B. S., Hardee M. E., Agarwal N., Moeller B. J., and Dewhirst M. W., “Spectral imaging facilitates visualization and measurements of unstable and abnormal microvascular oxygen transport in tumors,” J. Biomed. Opt. 13, 014026 (2008). 10.1117/1.2837439 [DOI] [PubMed] [Google Scholar]
- Sorg B. S., Moeller B. J., Donovan O., Cao Y., and Dewhirst M. W., “Hyperspectral imaging of hemoglobin saturation in tumor microvasculature and tumor hypoxia development,” J. Biomed. Opt. 10, 044004 (2005). 10.1117/1.2003369 [DOI] [PubMed] [Google Scholar]
- Skala M. C., Fontanella A., Hendargo H., Dewhirst M. W., and Izatt J. A., “Combined hyperspectral and spectral domain optical coherence tomography microscope for noninvasive hemodynamic imaging,” Opt. Lett. 34, 289–291 (2009). 10.1364/OL.34.000289 [DOI] [PMC free article] [PubMed] [Google Scholar]
- Shonat R. D., Wachman E. S., Niu W.-H., Koretsky A. P., and Farkas D. L., “Near-simultaneous hemoglobin saturation and oxygen tension maps in mouse brain using an AOTF microscope,” Biophys. J. 73, 1223–1231 (1997). 10.1016/S0006-3495(97)78155-4 [DOI] [PMC free article] [PubMed] [Google Scholar]
- Park S. O., Lee Y. J., Seki T., Hong K.-H., Fliess N., Jiang Z., Park A., Wu X., Kaartinen V., Roman B. L., and Oh S. P., “ALK5- and TGFBR2-independent role of ALK1 in the pathogenesis of hereditary hemorrhagic telangiectasia type 2,” Blood 111, 633–642 (2008). 10.1182/blood-2007-08-107359 [DOI] [PMC free article] [PubMed] [Google Scholar]
- Unthank J. L., Lash J. M., Nixon J. C., Sidner R. A., and Bohlen H. G., “Evaluation of carbocyanine-labeled erythrocytes for microvascular measurements,” Microvasc. Res. 45, 193–210 (1993). 10.1006/mvre.1993.1018 [DOI] [PubMed] [Google Scholar]
- deDeugd C., Wankhede M., and Sorg B. S., “Multimodal optical imaging of microvessel network convective oxygen transport dynamics,” Appl. Opt. 48, D187–D197 (2009). 10.1364/AO.48.00D187 [DOI] [PubMed] [Google Scholar]
- Ferreira A. J. and Raizada M. K., “Genomic and proteomic approaches for targeting of angiotensin-converting enzyme2 for cardiovascular diseases,” Curr. Opin. Cardiol. 23, 364–369 (2008). 10.1097/HCO.0b013e328303b79b [DOI] [PubMed] [Google Scholar]
- Santos R. A., Ferreira A. J., Simões E., and Silva A. C., “Recent advances in the angiotensin-converting enzyme 2-angiotensin(1-7)-Mas axis,” Exp. Physiol. 93, 519–527 (2008). 10.1113/expphysiol.2008.042002 [DOI] [PubMed] [Google Scholar]
- Katayama T., Ikeda Y., Handa M., Tamatani T., Sakamoto S., Ito M., Ishimura Y., and Suematsu M., “Immunoneutralization of glycoprotein Ibα attenuates endotoxin-induced interactions of platelets and leukocytes with rat venular endothelium in vivo,” Circ. Res. 86, 1031–1037 (2000). [DOI] [PubMed] [Google Scholar]
- Vaupel P., Kallinowski F., and Okunieff P., “Blood flow, oxygen and nutrient supply, and metabolic microenvironment of human tumors: a review,” Cancer Res. 49, 6449–6465 (1989). [PubMed] [Google Scholar]
- Folkman J., “Tumor angiogenesis: therapeutic implications,” N. Engl. J. Med. 285, 1182–1186 (1971). [DOI] [PubMed] [Google Scholar]
- Bristow R. G. and Hill R. P., “Hypoxia, DNA repair and genetic instability,” Nat. Rev. Cancer 8, 180–192 (2008). 10.1038/nrc2344 [DOI] [PubMed] [Google Scholar]
- Durand R. E. and Aquino-Parsons C., “Non-constant tumour blood flow—implications for therapy,” Acta Oncol. 40, 862–869 (2001). 10.1080/02841860152703508 [DOI] [PubMed] [Google Scholar]
- Durand R. E. and Aquino-Parsons C., “Clinical relevance of intermittent tumour blood flow,” Acta Oncol. 40, 929–936 (2001). 10.1080/02841860152708206 [DOI] [PubMed] [Google Scholar]
- Rofstad E. K., Galappathi K., Mathiesen B., and Ruud E.-B. M., “Fluctuating and diffusion-limited hypoxia in hypoxia-induced metastasis,” Clin. Cancer Res. 13, 1971–1978 (2007). 10.1158/1078-0432.CCR-06-1967 [DOI] [PubMed] [Google Scholar]
- Brurberg K. G., Gaustad J.-V., Mollatt C. S., and Rofstad E. K., “Temporal heterogeneity in blood supply in human tumor xenografts,” Neoplasia 10, 727–735 (2008). [DOI] [PMC free article] [PubMed] [Google Scholar]
- Gaustad J.-V., Simonsen T. G., Brurberg K. G., Huuse E. M., and Rofstad E. K., “Blood supply in melanoma xenografts is governed by the morphology of the supplying arteries,” Neoplasia 11, 277–285 (2009). [DOI] [PMC free article] [PubMed] [Google Scholar]
- Hardee M. E., Dewhirst M. W., Agarwal N., and Sorg B. S., “Novel imaging provides new insights into mechanisms of oxygen transport in tumors,” Curr. Mol. Med.9, 435–441 (2009). [DOI] [PMC free article] [PubMed]
- Konner K., “The initial creation of native arteriovenous fistulas: surgical aspects and their impact on the practice of nephrology,” Semin. Dial. 16, 291–298 (2003). 10.1046/j.1525-139X.2003.16064.x [DOI] [PubMed] [Google Scholar]
- Jain R. K., “Determinents of tumor blood flow: a review,” Cancer Res. 48, 2641–2658 (1988). [PubMed] [Google Scholar]
- Widdicombe J., “Microvascular anatomy of the nose,” Allergy 52(Suppl. 1), 7–11 (1997). 10.1111/j.1398-9995.1997.tb04877.x [DOI] [PubMed] [Google Scholar]
- Zakrzewicz A., Secomb T. W., and Pries A. R., “Angioadaptation: keeping the vascular system in shape,” News Physiol. Sci. 17, 197–201 (2002). [DOI] [PubMed] [Google Scholar]
- Sharathkumar A. A. and Shapiro A., “Hereditary haemorrhagic telangiectasia,” Haemophilia 14, 1269–1280 (2008). [DOI] [PubMed] [Google Scholar]
- Berg J., Porteous M., Reinhardt D., Gallione C., Holloway S., Umasunthar T., Lux A., McKinnon W., Marchuk D., and Guttmacher A., “Hereditary haemorrhagic telangiectasia: a questionnaire based study to delineate the different phenotypes caused by endoglin and ALK1 mutations,” J. Med. Genet. 40, 585–590 (2003). 10.1136/jmg.40.8.585 [DOI] [PMC free article] [PubMed] [Google Scholar]
- Sadick H., Sadick M., Götte K., Naim R., Riedel F., Bran G., and Hörmann K., “Hereditary hemorrhagic telangiectasia: an update on clinical manifestations and diagnostic measures,” Wien. Klin. Wochenschr. 118, 72–80 (2006). 10.1007/s00508-006-0561-x [DOI] [PubMed] [Google Scholar]
- Guyton A. C., Textbook of Medical Physiology, W. B. Saunders Company, Philadelphia: (1991). [Google Scholar]
- Fitzgerald D. J., “Vascular biology of thrombosis: the role of platelet–vessel wall adhesion,” Neurology 57(Suppl. 2), S1–S4 (2001). [DOI] [PubMed] [Google Scholar]
- Kyrle P. A. and Eichinger S., “Deep vein thrombosis,” Lancet 365, 1163–1174 (2005). 10.1016/S0140-6736(05)71880-8 [DOI] [PubMed] [Google Scholar]
- Fraga-Silva R. A., Sorg B. S., Wankhede M., deDeugd C., Jun J. Y., Baker M. B., Li Y., Castellano R. K., Katovich M. J., Raizada M. K., and Ferreira A. J., “ACE2 activation promotes anti-thrombotic activity,” Mol. Med. (in press). [DOI] [PMC free article] [PubMed]
- Dewhirst M. W., “Intermittent hypoxia furthers the rationale for hypoxia-inducible factor-1 targeting,” Cancer Res. 67, 854–855 (2007). 10.1158/0008-5472.CAN-06-4744 [DOI] [PubMed] [Google Scholar]
- Lanzen J., Braun R. D., Klitzman B., Brizel D., Secomb T. W., and Dewhirst M. W., “Direct demonstration of instabilities in oxygen concentrations within the extravascular compartment of an experimental tumor,” Cancer Res. 66, 2219–2223 (2006). 10.1158/0008-5472.CAN-03-2958 [DOI] [PubMed] [Google Scholar]
- Estrada A. D., Ponticorvo A., Ford T. N., and Dunn A. K., “Microvascular oxygen quantification using two-photon microscopy,” Opt. Lett. 33, 1038–1040 (2008). 10.1364/OL.33.001038 [DOI] [PubMed] [Google Scholar]
- Briers J. D., “Laser Doppler, speckle and related techniques for blood perfusion mapping and imaging,” Physiol. Meas 22, R35–R66 (2001). 10.1088/0967-3334/22/4/201 [DOI] [PubMed] [Google Scholar]
- Yu-Chih Huang Y.-C., Ringold T. L., Nelson J. S., and Choi B., “Noninvasive blood flow imaging for real-time feedback during laser therapy of port wine stain birthmarks,” Lasers Surg. Med. 40, 167–173 (2008). 10.1002/lsm.20619 [DOI] [PMC free article] [PubMed] [Google Scholar]
- Wang Y., Bower B. A., Izatt J. A., Tan O., and Huang D., “In vivo total retinal blood flow measurement by Fourier domain Doppler optical coherence tomography,” J. Biomed. Opt. 12, 041215 (2007). 10.1117/1.2772871 [DOI] [PubMed] [Google Scholar]
- Sivaramakrishnan M., Maslov K., Zhang H. F., Stoica G., and Wang L. V., “Limitations of quantitative photoacoustic measurements of blood oxygenation in small vessels,” Phys. Med. Biol. 52, 1349–1361 (2007). 10.1088/0031-9155/52/5/010 [DOI] [PubMed] [Google Scholar]
- Kerger H., Groth G., Kalenka K., Vajkoczy P., Tsai A. G., and Intaglietta M., “pO2 measurements by phosphorescence quenching: characteristics and applications of an automated system,” Microvasc. Res. 65, 32–38 (2003). 10.1016/S0026-2862(02)00027-4 [DOI] [PubMed] [Google Scholar]
- Binzoni T., Vogel A., Gandjbakhche A. H., and Marchesini R., “Detection limits of multi-spectral optical imaging under the skin surface,” Phys. Med. Biol. 53, 617–636 (2008). 10.1088/0031-9155/53/3/008 [DOI] [PubMed] [Google Scholar]
- Shan S., Sorg B. S., and Dewhirst M. W., “A novel rodent mammary window of orthotopic breast cancer for intravital microscopy,” Microvasc. Res. 65, 109–117 (2003). 10.1016/S0026-2862(02)00017-1 [DOI] [PubMed] [Google Scholar]
- Ramella-Roman J. C., Mathews S. A., Kandimalla H., Nabili A., Duncan D. D., D’Anna S. A., Shah S. M., and Nguyen Q. D., “Measurement of oxygen saturation in the retina with a spectroscopic sensitive multi aperture camera,” Opt. Express 16, 6170–6182 (2008). 10.1364/OE.16.006170 [DOI] [PubMed] [Google Scholar]
- Johnson W. R., Wilson D. W., Fink W., Humayun M., and Bearman G., “Snapshot hyperspectral imaging in ophthalmology,” J. Biomed. Opt. 12, 014036 (2007). 10.1117/1.2434950 [DOI] [PubMed] [Google Scholar]
- Gehm M. E., John R., Brady D. J., Willett R. M., and Schulz T. J., “Single-shot compressive spectral imaging with a dual-disperser architecture,” Opt. Express 15, 14013–14027 (2007). 10.1364/OE.15.014013 [DOI] [PubMed] [Google Scholar]
- Wagadarikar A. A., Pitsianis N. P., Sun X., and Brady D. J., “Video rate spectral imaging using a coded aperture snapshot spectral imager,” Opt. Express 17, 6368–6388 (2009). 10.1364/OE.17.006368 [DOI] [PubMed] [Google Scholar]
- Duling B. R. and Berne R. M., “Longitudinal gradients in periarteriolar oxygen tension,” Circ. Res. 27, 669–678 (1970). [DOI] [PubMed] [Google Scholar]
- Duling B. R., “Microvascular responses to alterations in oxygen tension,” Circ. Res. 31, 481–489 (1972). [DOI] [PubMed] [Google Scholar]
- Shonat R. D. and Johnson P. C., “Oxygen tension gradients and heterogeneity in venous microcirculation: a phosphorescence quenching study,” Am. J. Physiol. Heart Circ. Physiol. 272, H2233–H2240 (1997). [DOI] [PubMed] [Google Scholar]
- Dewhirst M. W., Cao Y., and Moeller B. J., “Cycling hypoxia and free radicals regulate angiogenesis and radiotherapy response,” Nat. Rev. Cancer 8, 425–437 (2008). 10.1038/nrc2397 [DOI] [PMC free article] [PubMed] [Google Scholar]
- Cardenas-Navia L. I., Mace D., Richardson R. A., Wilson D. F., Shan S., and Dewhirst M. W., “The pervasive presence of fluctuating oxygenation in tumors,” Cancer Res. 68, 5812–5819 (2008). 10.1158/0008-5472.CAN-07-6387 [DOI] [PubMed] [Google Scholar]
- Martinive P., Defresne F., Bouzin C., Saliez J., Lair F., Grégoire V., Michiels C., Dessy C., and Feron O., “Preconditioning of the tumor vasculature and tumor cells by intermittent hypoxia: implications for anticancer therapies,” Cancer Res. 66, 11736–11744 (2006). 10.1158/0008-5472.CAN-06-2056 [DOI] [PubMed] [Google Scholar]
- Øye K. S., Gulati G., Graff B. A., Gaustad J.-V., Brurberg K. G., and Rofstad E. K., “A novel method for mapping the heterogeneity in blood supply to normal and malignant tissues in the mouse dorsal window chamber,” Microvasc. Res. 75, 179–187 (2008). 10.1016/j.mvr.2007.06.009 [DOI] [PubMed] [Google Scholar]
- Braverman I. M., Keh A., and Jacobson B. S., “Ultrastructure and three-dimensional organization of the telangiectases of hereditary hemorrhagic telangiectasia,” J. Invest. Dermatol. 95, 422–427 (1990). 10.1111/1523-1747.ep12555569 [DOI] [PubMed] [Google Scholar]
- Murphy P. A., Lam M. T. Y., Wu X., Kim T. N., Vartanian S. M., Bollen A. W., Carlson T. R., and Wang R. A., “Endothelial Notch4 signaling induces hallmarks of brain arteriovenous malformations in mice,” Proc. Natl. Acad. Sci. U.S.A. 105, 10901–10906 (2008). 10.1073/pnas.0802743105 [DOI] [PMC free article] [PubMed] [Google Scholar]
- Park S. O., Wankhede M., Lee Y. J., Choi E.-J., Fliess N., Choe S., Oh S.-H., Walter G., Raizada M. K., Sorg B. S., and Oh S. P., “Real-time imaging of de novo arteriovenous malformation in a mouse model of hereditary hemorrhagic telangiectasia,” J. Clin. Invest. 119, 3487–3496 (2009). [DOI] [PMC free article] [PubMed] [Google Scholar]
- Willoughby S., Holmes A., and Loscalzo J., “Platelets and cardiovascular disease,” Eur. J. Cardiovasc. Nurs. 1, 273–288 (2002). 10.1016/S1474-5151(02)00038-5 [DOI] [PubMed] [Google Scholar]
- Pittman R. N., “Oxygen transport and exchange in the microcirculation,” Microcirculation (N.Y.) 12, 59–70 (2005). 10.1080/10739680590895064 [DOI] [PubMed] [Google Scholar]
- Secomb T. W., Hsu R., Park E. Y. H., and Dewhirst M. W., “Green’s function methods for analysis of oxygen delivery to tissue by microvascular networks,” Ann. Biomed. Eng. 32, 1519–1529 (2004). 10.1114/B:ABME.0000049036.08817.44 [DOI] [PubMed] [Google Scholar]


