Abstract
Elasmobranchs are the most commonly used experimental models among the jawed, cartilaginous fish (Chondrichthyes). Previously we developed cell lines from embryos of two elasmobranchs, Squalus acanthias the spiny dogfish shark (SAE line), and Leucoraja erinacea the little skate (LEE-1 line). From these lines cDNA libraries were derived and expressed sequence tags (ESTs) generated. From the SAE cell line 4303 unique transcripts were identified, with 1848 of these representing unknown sequences (showing no BLASTX identification). From the LEE-1 cell line, 3660 unique transcripts were identified, and unknown, unique sequences totaled 1333. Gene Ontology (GO) annotation showed that GO assignments for the two cell lines were in general similar. These results suggest that the procedures used to derive the cell lines led to isolation of cell types of the same general embryonic origin from both species. The LEE-1 transcripts included GO categories “envelope” and “oxidoreductase activity” but the SAE transcripts did not. GO analysis of SAE transcripts identified the category “anatomical structure formation” that was not present in LEE-1 cells. Increased organelle compartments may exist within LEE-1 cells compared to SAE cells, and the higher oxidoreductase activity in LEE-1 cells may indicate a role for these cells in responses associated with innate immunity or in steroidogenesis. These EST libraries from elasmobranch cell lines provide information for assembly of genomic sequences and are useful in revealing gene diversity, new genes and molecular markers, as well as in providing means for elucidation of full-length cDNAs and probes for gene array analyses. This is the first study of this type with members of the Chondrichthyes.
Keywords: Elasmobranch, EST, Gene ontology, Squalus acanthias, SAE cell line, Leucoraja erinacea, LEE-1 cell line
1. Introduction
Among the jawed, cartilaginous fish (Chondrichthyes), the most numerous and commonly used experimental models are the elasmobranchs (sharks, rays and skates). Significant research in physiology, pharmacology, toxicology, immunology, evolutionary and developmental biology has been carried out with the spiny dogfish shark, Squalus acanthias, and the little skate, Leucoraja erinacea (Mattingly et al., 2004). The little skate has been targeted by the National Institutes of Health Human Genome Research Institute as a species designated for full genome sequencing (http://www.genome.gov/Pages/Research/Sequencing/SeqProposals/SharkSkateSeq.pdf; http://www.sciencedaily.com/releases/2005/03/050307100237.htm). To develop additional tools for cellular, molecular and genomic studies of cartilaginous fish, we derived cell lines from embryos of S. acanthias and L. erinacia (Parton et al., 2007; Forest et al., 2007; Kobayashi et al., 2007; Hwang et al., 2008). We refer to these as the SAE cell line from the dogfish shark and LEE-1 cell line from the little skate.
As a first step toward determining the transcriptomes from these cell lines and identifying their tissue origins and cell types, cDNA libraries were constructed and expressed sequence tags (ESTs) generated. This comparative genomic approach provides information that will assist in the assembly of genomic sequences and in expression profiling, and is also useful in identification of gene diversity, new genes and molecular markers. ESTs from these organisms additionally provide means for elucidation of full-length cDNA and for the design of probes for gene array analyses. With the EST sequences, we carried out gene ontology (GO) classification analysis as a means to discover relationships among expressed genes. For this work we used a data mining tool for non-model species (Conesa et al., 2005; www.Blast2GO.de), and obtained information on comparative genomics that is useful for both EST and microarray analysis. BLASTX gene names are mapped to GO terms followed by user-defined annotation to produce GO categories in a hierarchical order that can be further analyzed to shed light on biological processes, molecular functions and cellular components. This is the first study of this type with members of the Chondrichthyes.
2. Materials and methods
2.1 Cell culture
The basal nutrient medium for both cell lines was LDF (Helmrich and Barnes 1999), a mixture of 50% Dulbecco-modified Eagle’s medium (Gibco), 35% L-15 (Sigma), and 15% Ham's F-12 (Gibco), containing sodium bicarbonate (0.18 mg/mL) and 15 mM HEPES. Additional supplements added to the basal nutrient medium for both cell lines were: insulin (10 µg/mL, Sigma), transferrin (10 µg/mL, Sigma), selenous acid (10 nM, Sigma), human recombinant epidermal growth factor (25 ng/mL, R and D), basic fibroblast growth factor (10 ng/mL, R and D), L-glutamine (0.2 mM, Gibco), chemically defined lipids (1:1000, Gibco), non-essential and essential amino acids (1:1000, Gibco), and heat-inactivated fetal bovine serum (2%, Hyclone). Antibiotics were also added: penicillin G (200 units/mL, Sigma), streptomycin sulfate (200 µg/mL, Sigma), and ampicillin (25 µg/mL, Sigma). Osmolarity of the medium was 318 mOsm. The pH of LDF for SAE was adjusted to 8.0 using 1.0 N NaOH. The pH of medium for LEE-1 cells was 7.2. For the LEE-1 cell line, 4% sea water also was added. LDF medium as described contains a bicarbonate concentration that allows culture at ambient carbon dioxide levels. Cells were maintained at 18 °C.
The SAE cell line was derived from a pooled group of small embryos each of which was at a developmental stage prior to eye pigmentation (Parton et al., 2007). The LEE-1 cell line was initiated from a single, stage 28 skate embryo (Hwang et al., 2008). Cultures were initiated and grown for 7–10 passages on collagen-coated cell culture vessels. After this time the cell lines were adapted to growth without collagen. Cells were passaged with TryplE Express (Invitrogen).
2.2. Library construction and EST sequencing
Library construction was carried out by Invitrogen. RNA from 5×10⁷ SAE cells at passages 10 through 14 was extracted using TRIzol reagent (phenol chloroform extraction) (Chomzynski et al., 1987). Reverse transcription of mRNA transcripts was carried out with SuperScript III reverse transcriptase using oligo-dT priming. The library was constructed by normalization through subtractive hybridization at Cot values 7.5 and 15, and directional cloning into the pUC-derived plasmid pCMV Sport 6.1 in DH10B ton™ A E. coli cells. Average insert size and number of clones containing inserts was determined by survey of 23 randomly picked clones. For derivation of the LEE-1 cDNA library, RNA from 108 cells at passages 10 through 14 was extracted and the library constructed as described above, using DH10B™ T1 cells. EST sequencing from the 5’ end was carried out commercially (Rexagen/High-Throughput Sequencing Solutions; University of Washington High-Throughput Genomics Unit, Department of Genome Sciences, Seattle, Washington) using the M13 site (forward primer GTAAAACGACGGCCAGT).
2.3. Contig assembly and BLAST parameters for SAE ESTs
Contig assembly was performed with the Sequencher Sofware suite version 4 (http://www.genecodes.com/). FASTA files (5,216) from 5’ ESTS previously deposited in Genbank were imported into the Sequencher software and a contig alignment was performed using the following default parameter settings: Dirty Data with ReAligner 3’gap placement; minimal overlap, 50 bp; minimal match, 95%. The “dirty” alignment option allows for occasional misreads that may be generated by automatic base calling. A total of 602 contigs were identified. Contigs and singletons were combined for Blast2GO analysis (Conesa et al., 2005; www.Blast2GO.de). BLAST was performed using the following settings: blast DB: nr; number of blast hits, 20; blast E cutoff 1.0×e−5; blast program BLASTX; blast mode QBlast-NCBI; high-scoring segment pair (HSP) length cutoff, 33; low complexity filter, on. A total of 4,303 sequences (602 contigs + 3,701 singletons) were imported into Blast2GO for BLAST analysis.
2.4. Annotation parameters and graphing for SAE ESTs
Annotation was performed with an E-value hit filter of 1×e−6, annotation cut-off of 55, GO weight of 5 and HSP Hit coverage of 30. Classification graphing was carried out with a sequence filter of 100 and a node score filter of 5. Graphs shown are level two for Biological Process and Cellular Component and level three for Molecular Function. The Molecular Function classification at level two was not sufficiently differentiated into individual categories to provide meaningful information.
2.5. Analysis of LEE-1 ESTs
Contig assembly was as described for SAE ESTs. A total of 799 contigs were identified. BLAST was carried out as described above. A total of 3660 sequences (contigs plus singletons) were imported into Blast2GO as described above. Graphs shown are level two except for Molecular Function which, as with the SAE analysis, was not sufficiently differentiated into individual categories to provide meaningful information, and is shown at level three. Available LEE-1 and SAE EST clones will be supplied to investigators upon request. Contact David Barnes, Ph.D., Senior Scientist, Mount Desert Island Biological Laboratory, PO Box 35, Salisbury Cove, Maine 04672, USA; E-mail: dbarnes@mdibl.org.
3. Results
3.1. SAE cell line EST analysis
The SAE cell line has been maintained in a continuously proliferative state for more than four years (Parton et al., 2007). Cells are cultured at 18°C in a basal nutrient medium modified for fish cells with supplements as described in Materials and methods and Parton et al. (2007). The cells have been cryopreserved and can be transfected with plasmids to express exogenously derived genes. Population doubling time is approximately two weeks.
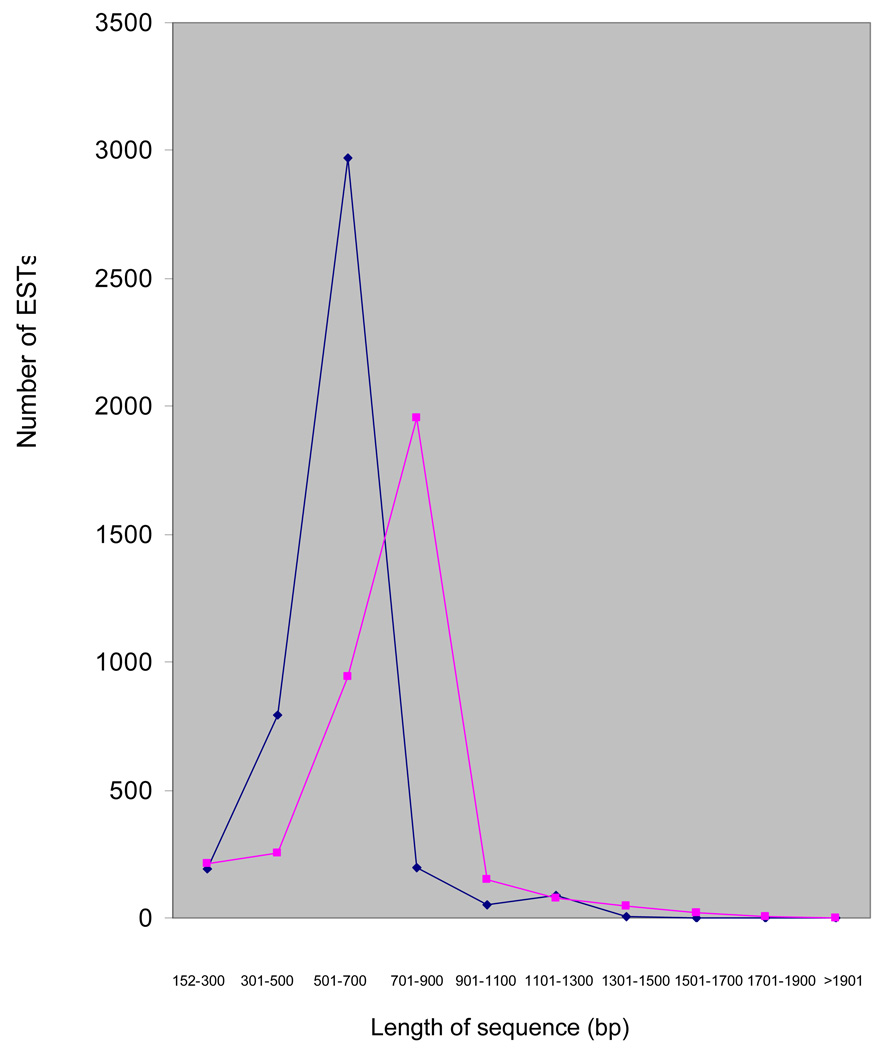
Derivation of the SAE cDNA library was as described in Materials and methods. Normalization resulted in a decrease in beta-actin abundance from 1.4% to 0.005%, representing a 280-fold reduction. Average insert size was 2.0 kb, with 100% of the clones containing inserts. Total number of colony-forming units was 3.1 × 10⁷. For generation of the EST library, clones were single-pass sequenced from the 5’ end. For submission to dbEST of GenBank, sequence chromatographic trace base-calling using the phred protocol, and removal of vector or other contaminant sequences with cross-match screens were performed on high quality sequence traces (phred score ≥20, sequencing error rate of <1%), using trace2dbest software (Ewing and Green, 1998a; 1998b; Parkinson et al., 2004). Minimum acceptable EST length was 150 consecutive bases. A total of 5749 ESTs were processed, with 5213 submissable sequences after trimming. Average length was 536 bp. EST sequence information can be retrieved in the public domain through GenBank accession numbers DV202711-DV203067 and DV496099-DV500954, NCBI. Contig assembly to align and condense overlapping sequences was performed as described in Materials and methods. Total number of contigs built was 602, derived from 1515 sequences, giving an average of 2.5 clones per contig. These showed a range of 429 contigs derived from two sequences each through 1 contig derived from 10 sequences. Singletons represented 86% (3701 sequences) of total ESTs, and the total number of unique, nonoverlapping sequences representing gene transcripts was 4303. Contig length was distributed in a range from 188 to 1932 bp (Figure 1). The shortest sequence examined was 152 bp.
Figure 1.
Sequence length distribution of ESTs from SAE and LEE-1 cell lines. Total number of sequences analyzed was 4303 for SAE cells and 3660 for LEE-1 cells.
Data include both contigs and singletons. Contig assembly was performed with the Sequencher Sofware suite version 4 (http://www.genecodes.com/). FASTA files from 5’ ESTs previously deposited in Genbank were imported into the Sequencher software. A total of 602 contigs were identified for SAE cells and 799 for LEE-1 cells. Contig length was distributed in a range from 188 to 1932 bp for SAE cells and from 169 to 2330 bp for LEE-1 cells. Smallest sequences were 152 bp (SAE and LEE-1). SAE cells: diamonds; LEE-1 cells: squares.
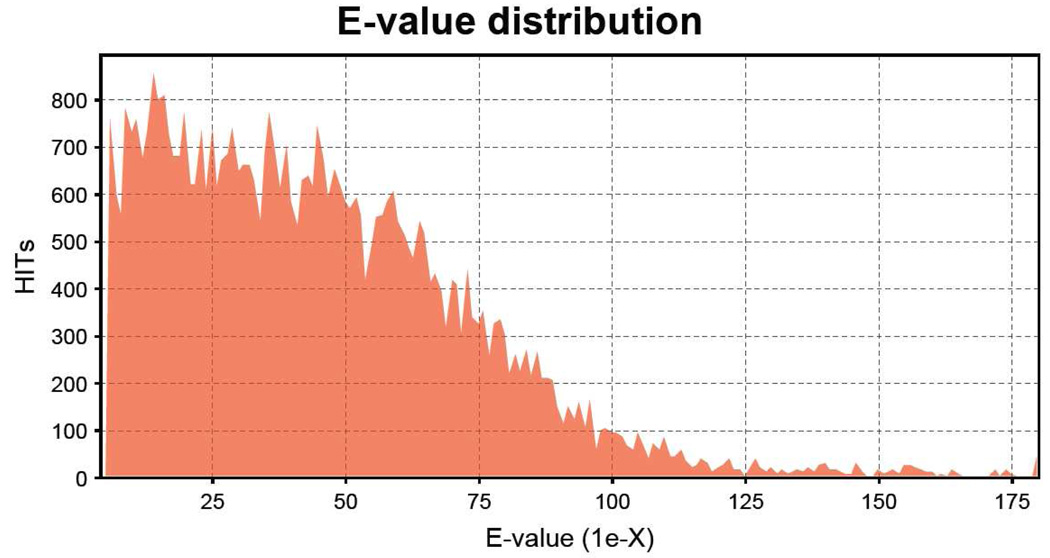
Homology to known genes was analyzed (December, 2009) by BLASTX algorithm search (Altschul et al., 1998) against the NCBI nonredundant protein database (E≤1e−5 cutoff) through Blast2GO software (Conesa et al., 2005; www.Blast2GO.de). Unknown unique sequences (no Blast identification, or “hit”, returned) totaled 1848 (43%) of the 4303 sequences. E value distribution of blast hits is shown in Figure 2.
Figure 2.
E-value distribution for SAE cell line sequences (4303 unique transcripts) analyzed by the Blast2GO program (E≤1e−5 cutoff). Contigs and singletons were combined for Blast2GO analysis. Homology to known genes was analyzed by BLASTX algorithm search against the NCBI nonredundant protein database. Unknown unique sequences (no Blast identification returned) totaled 43% of sequences analyzed.
3.2. LEE-1 cell line EST analysis
The LEE-1 cell line has been maintained in a continuously proliferative state for more than three years (Hwang et al., 2008). Cells were cultured as described (Hwang et al., 2008 and Materials and methods) in a medium similar to that used for SAE cells. Population doubling time was approximately ten days.
For derivation of the LEE-1 cDNA library, RNA was extracted and the library constructed as described above for the SAE cDNA library. Normalization resulted in a decrease in beta-actin abundance from 4.9% to 0.19%, representing a 26-fold reduction. Average insert size was 1.9 kb, with 100% of the clones containing inserts. Total number of colony-forming units was 5.1 × 10⁷. Clones were single-pass sequenced from the 5’ end and processed using trace2dbest software as described for SAE ESTs above. Of 5376 traces processed, 4825 were considered submissable sequences after trimming. Average length was 693 bp. Genbank accession numbers are FF597303-FF602127, inclusive.
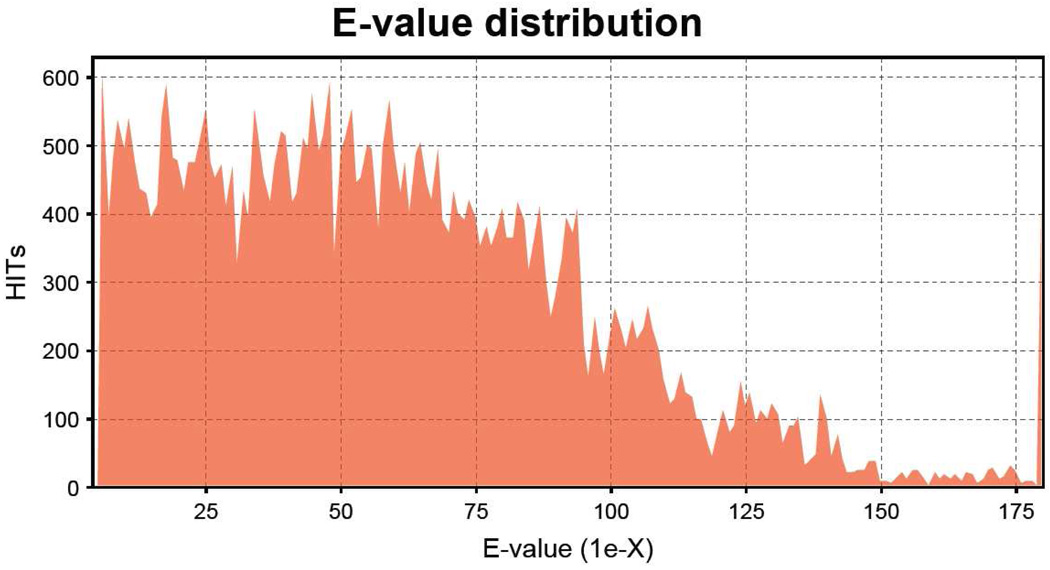
Contig assembly for the LEE-1 ESTs was performed as with the SAE library. Total number of contigs was 799, derived from 1964 sequences (average of 2.5 clones per contig). Results showed a range of 578 contigs derived from two sequences each through 1 contig derived from 14 sequences. There were 2861 singletons (78%), and the total number of unique transcripts represented was 3660. Contig length ranged from 169 to 2330 bp (Figure 1), The peak Est length was larger in the LEE-1 cell line than in the SAE cell line. Differences in peak length between the two lines likely represents a difference in efficiency of transcription during library construction, rather than an inherent difference in transcript length between the two lines. The shortest sequence examined was 152 bp. As with SAE ESTs, homology to known genes was determined by BLASTX (December, 2009) against the NCBI nonredundant protein database (E≤1e−5 cutoff). Unknown, unique sequences (no Blast hits) totaled 1333 (36%) of the 3660 sequences. E value distribution of blast hits is shown in Figure 3.
Figure 3.
E-value distribution for LEE-1 cell line sequences (3600 unique transcripts) analyzed by the Blast2GO program (E≤1e−5 cutoff). Contigs and singletons were combined for Blast2GO analysis. Homology to known genes was analyzed by BLASTX algorithm search against the NCBI nonredundant protein database. Unknown unique sequences (no Blast identification returned) totaled 36% of sequences analyzed.
3.3. Gene ontology analysis
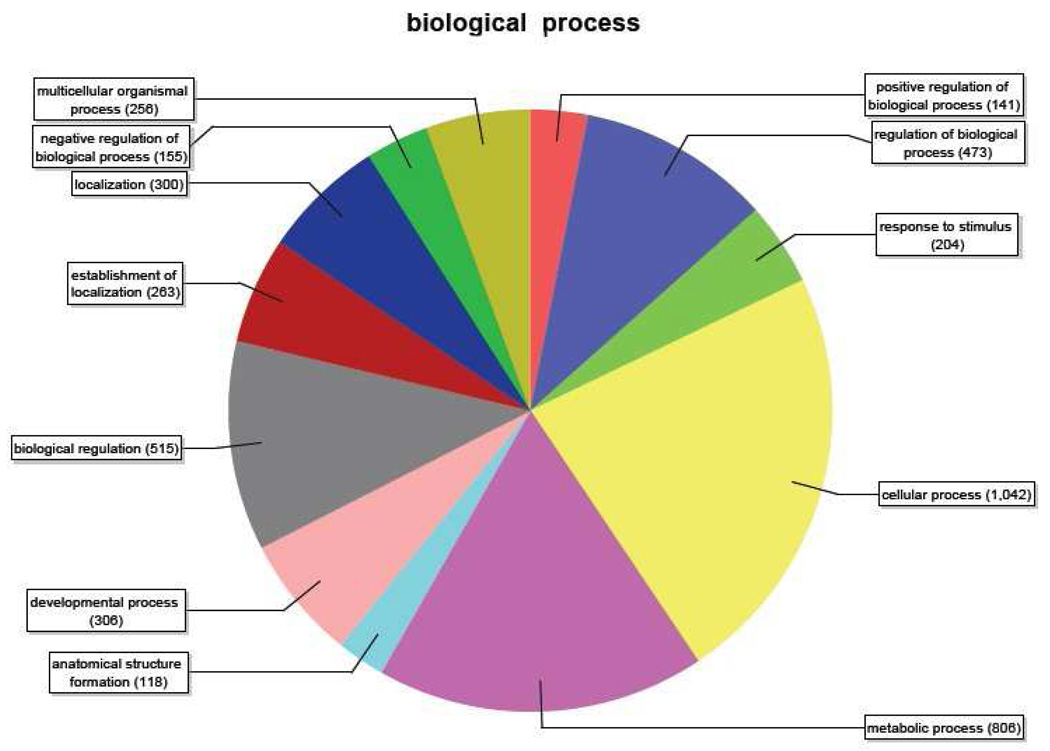
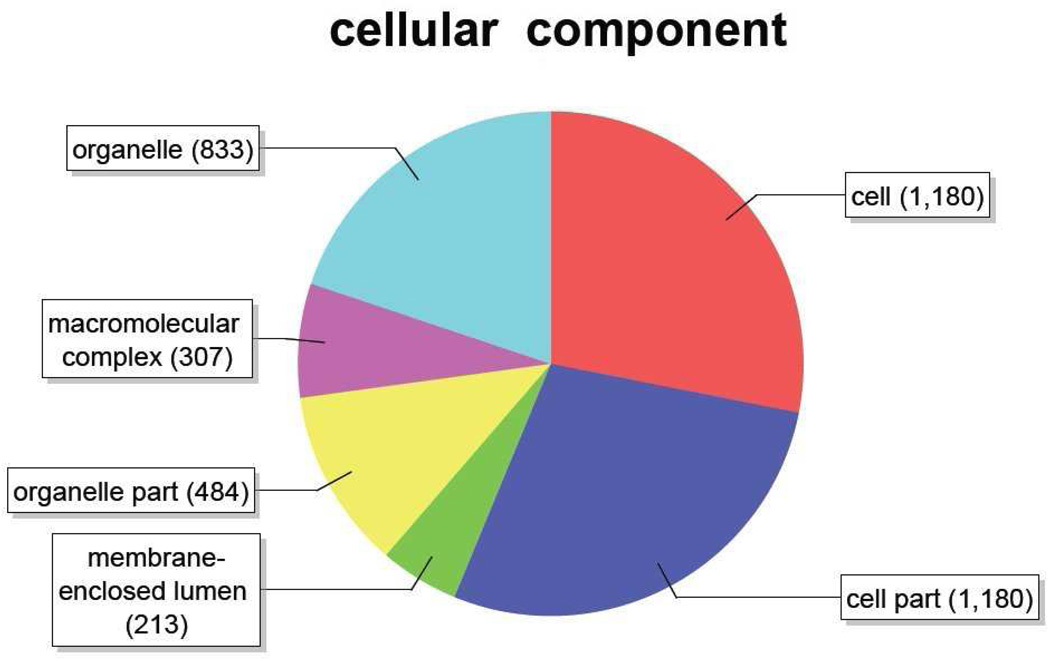
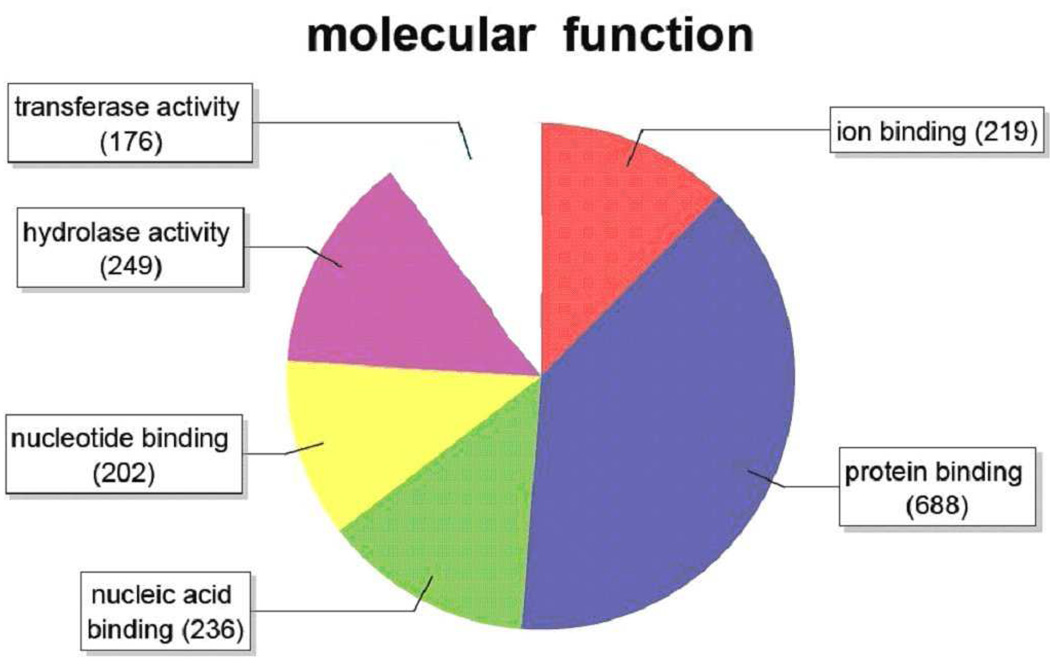
Gene ontology annotations and functional analyses of SAE unique sequences were carried out with automated software Blast2GO. Of the total 2455 blast hits, 1414 (58%) could be annotated with GO terms. These were assigned into three standard classifications: Biological Processes, Molecular Functions and Cellular Components, and summarized according to GO criteria. Within the classification of Biological Processes (Figure 4), of a total of 4579 sequences identified, 1042 (23%) appeared under “cellular process” and 806 (18%) appeared under “metabolic process”. Of a total of 4197 sequences annotated within the Cellular Component classification (Figure 5), 28 % (1180 sequences) appeared each under “cell” and “cell part”. Within the classification of Molecular Functions (Figure 6), of a total of 1770 sequences annotated, 688 (39%) appeared in the category “protein binding” and the next highest number of sequences (249) (14%) appeared in the category “hydrolase activity.” Number of sequences varies among classifications because a single gene product may be described by several terms in the three classifications.
Figure 4.
Distribution of annotated sequences for the SAE cell line under the Gene Ontology classification “Biological Process.” Gene ontology annotations and functional analyses of SAE unique sequences were carried out with automated software Blast2GO.
Go-annotated blast hits (1414) were assigned into three standard classifications: Biological Processes, Molecular Functions and Cellular Components. Within the classification of Biological Processes, a total of 4581 sequences were identified. Number of sequences varies among classifications because a single gene product may be described by several terms in the three classifications. Categories expressed as a percentage of the total are: Multicellular organismal process, 5.6%; Negative regulation of biological process, 3.4%; Localization, 6.6%; Establishment of localization, 5.7%; Biological regulation, 11.2%; Developmental process, 6.7%: Anatomical structure formation, 2.6%: Metabolic process, 17.6%: Cellular process, 22.8%: Response to stimulus, 4.4%: Regulation of biological process, 10.3%: Positive regulation of biological process, 3.1%. The category “anatomical structure formation” was present in “Biological Process” analysis of SAE cells but not LEE-1 cells (Figure 7).
Figure 5.
Distribution of annotated sequences for the SAE cell line under the Gene Ontology classification “Cellular Component.” Gene ontology annotations and functional analyses of SAE unique sequences were carried out with automated software Blast2GO. Go-annotated blast hits (1414) were assigned into three standard classifications: Biological Processes, Molecular Functions and Cellular Components. Within the classification of Cellular Component a total of 4197sequences were identified. Number of sequences varies among classifications because a single gene product may be described by several terms in the three classifications. Categories expressed as a percentage of the total are: Organelle, 19.8%: Macromolecular complex, 7.3%: Organelle part, 11.5%: Membrane-enclosed lumen, 5.1%: Cell part, 28.1%: Cell, 28.1%.
Figure 6.
Distribution of annotated sequences for the SAE cell line under the Gene Ontology classification “Molecular Function.”. Gene ontology annotations and functional analyses of SAE unique sequences were carried out with automated software Blast2GO. Go-annotated blast hits (1414) were assigned into three standard classifications: Biological Processes, Molecular Functions and Cellular Components. Within the classification of Molecular Functions a total of 1770 sequences were identified. Number of sequences varies among classifications because a single gene product may be described by several terms in the three classifications. Categories expressed as a percentage of the total are: Transferase activity, 9.9%: Hydrolase activity, 14.1%: Nucleotide binding, 11.4% Nucleic acid binding, 13.3%: Protein binding, 38.9%: Ion binding, 12.4%. SAE cells showed a somewhat higher percentage of sequences in the “hydrolase” category than did LEE-1 cells (Figure 9).
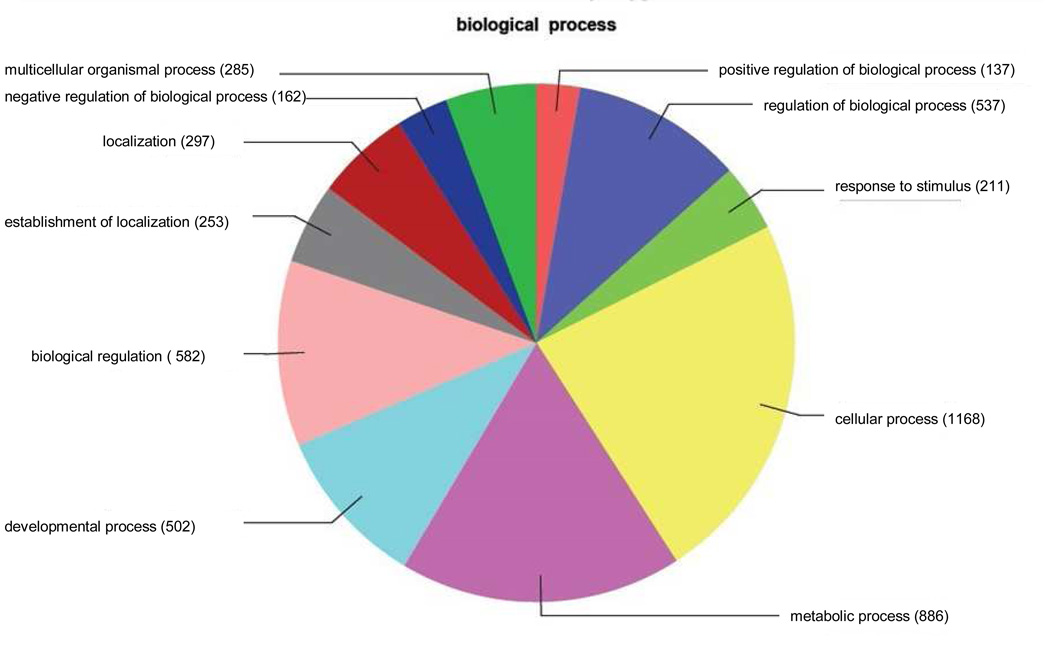
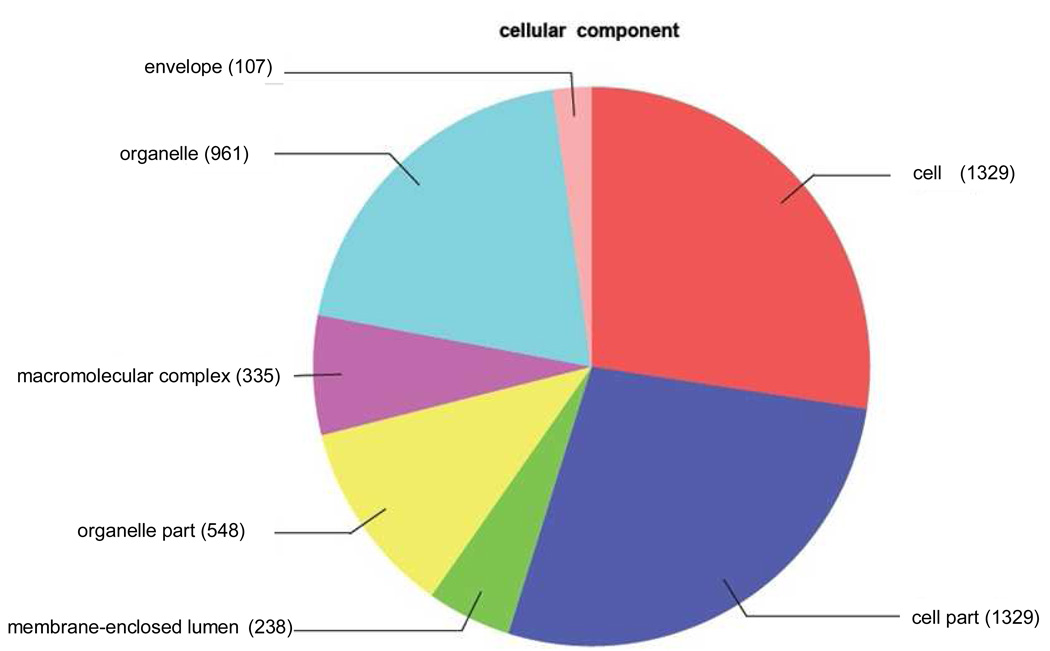
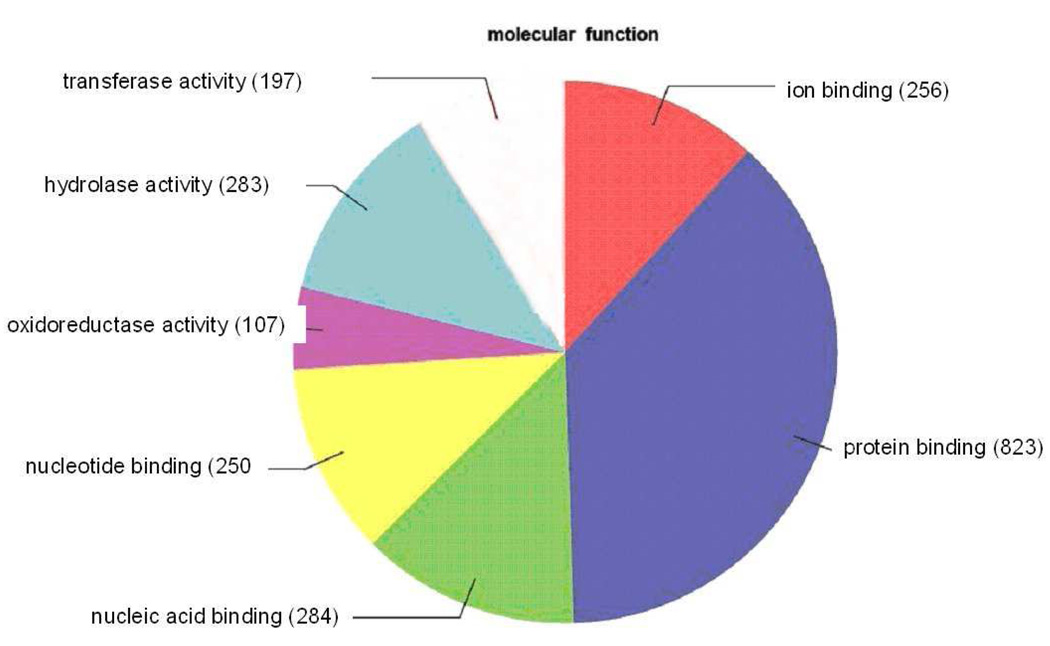
Of the 2327 sequences showing blast hits for the LEE-1 cell line, 1575 (68%) could be GO-annotated. Biological Processes (Figure 7) showed a total of 5020 sequences, with the highest number, 1168 (23%), in the category of “cellular process” and an additional 886 (18%) in the category of “metabolic process.” Of a total of 4847 sequences in the Cellular Component classification (Figure 8), 1329 sequences (27%) each were found in the categories of “cell” and “cell part.” In the classification of Molecular Function (Figure 9), 2180 sequences were found, with the largest segment, 823 sequences (38%), belonging to the category “protein binding.” The next highest category in the Molecular Function classification was nucleic acid binding, 284 sequences (13%).
Figure 7.
Distribution of annotated sequences for the LEE-1 cell line under the Gene Ontology classification “Biological Process.” Gene ontology annotations and functional analyses of SAE unique sequences were carried out with automated software Blast2GO. Go-annotated blast hits (1575) were assigned into three standard classifications: Biological Processes, Molecular Functions and Cellular Components. Within the classification of Biological Processes a total of 5020 sequences were identified. Number of sequences varies among classifications because a single gene product may be described by several terms in the three classifications. Categories expressed as a percentage of the total are: Multicellular organismal process, 5.7% Negative regulation of biological process, 3.2%; Localization, 5.9%: Establishment of localization, 5.0%: Biological regulation, 11.6%: Developmental process, 10.0%: Metabolic process, 17.6%: Cellular process, 23.3%: Response to stimulus, 4.2%: Regulation of biological process, 10.7%: Positive regulation of biological process, 2.7%. LEE-1 cells showed a somewhat higher percentage of sequences in the “developmental process” category than did SAE cells (Figure 4).
Figure 8.
Distribution of annotated sequences for the LEE-1 cell line under the Gene Ontology classification “Cellular Component.” Gene ontology annotations and functional analyses of SAE unique sequences were carried out with automated software Blast2GO. Go-annotated blast hits (1575) were assigned into three standard classifications: Biological Processes, Molecular Functions and Cellular Components. Within the classification of Cellular Component a total of 4847 sequences were identified. Number of sequences varies among classifications because a single gene product may be described by several terms in the three classifications. Categories expressed as a percentage of the total are: Envelope, 2.2%: Organelle, 19.8%: Macromolecular complex, 6.9%: Organelle part, 11.3%: Membrane-enclosed lumen, 4.9%: Cell part, 27.4%: Cell, 27.4%. The category “envelope” was present in “Cellular Component” analysis of LEE-1 cells but not SAE cells (Figure 5).
Figure 9.
Distribution of annotated sequences for the LEE-1 cell line under the Gene Ontology classification “Molecular Function.” Gene ontology annotations and functional analyses of SAE unique sequences were carried out with automated software Blast2GO. Go-annotated blast hits (1575) were assigned into three standard classifications: Biological Processes, Molecular Functions and Cellular Components. Within the classification of Molecular Function a total of 2200 sequences were identified. Number of sequences varies among classifications because a single gene product may be described by several terms in the three classifications. Categories expressed as a percentage of the total are: Transferase activity, 9.0%: Hydrolase activity, 12.9%: Oxidoreductase activity, 4.9%: Nucleotide binding, 11.4%: Nucleic acid binding, 12.9%: Protein binding, 37.4%: Ion binding, 11.6%. The category “oxidoreductase activity” was present in analysis of LEE-1 cells but not in “Molecular Function” analysis of SAE cells (Figure 6).
The LEE-1 cell line in classifications Cellular Component and Molecular Function showed categories that were not present in the SAE cell line at the level of analysis used. These were, in the Cellular Component classification, the category “envelope” (GO:0031975: 107 sequences, 2.9%), and in the Molecular Function classification, the category “oxidoreductase activity” (GO:0016491: 107 sequences, 4.9%). SAE showed an additional category in the classification Biological Process that was not present in LEE-1 cells: the category “anatomical structure formation” (GO:0010926: 118 sequences, 2.6%).
4. Discussion
Elasmobranchs are primitive, cartilaginous fish that have proved useful in a variety of disciplines of biological research (Ballatori et al., 2003; Mattingly et al., 2004; Barnes et al., 2008). We have derived the first cell lines from cartilaginous fish, SAE and LEE-1 (Parton et al.., 2007, Forest et al., 2007; Hwang et al., 2008). The successful derivation of cell lines from these animals was based on the concept that the conventional, heterologous bovine serum supplementation to culture medium should be minimized and replaced with defined peptide growth factors and other growth-promoting medium components more specifically suited to the cells to be cultured (Barnes et al., 2008). An understanding of the nature of the transcriptome of these cell lines provides information making SAE and LEE-1 of further utility in experimental design and interpretation. For instance, we have used the SAE line to identify mRNAs containing sequences in the 3’ untranslated regions that are highly conserved through a number of vertebrate classes: cartilaginous and bony fish, amphibians, birds and mammals (Forest et al., 2007). Sharks first appeared approximately 400 million years ago, and the conservation of these sequences over such a long period suggests they may serve important functions in control of expression of the genes involved.
Previously we explored the SAE EST library for clues to the cell type represented by the culture (Parton et al., 2007). We examined ESTs showing E-values indicating high confidence that the appropriate protein had been identified (≤e−20) and by inspection found, in particular, a number of markers for chondrocytic cells. These included “amplified in osteosarcoma”, cartilage-associated protein, chondroitin polymerizing factor, collagen alpha-2 (IV) chain precursor, bone morphogenetic proteins 1 and 4, hypertrophic chondrocyte-specific protein (connective tissue growth factor), pre-pro bone-inducing protein and transforming growth factors beta 1 and 2 . In this report we took a more global view of the transcriptome represented by EST libraries from SAE and LEE-1, using GO classifications as a guide, and found that at this level the two cell lines are similar. However, the LEE-1 cell line does not exhibit the chondrocytic markers that characterize the SAE cell line.
The field of gene ontology attempts to make available descriptions of gene products from different databases in a manageable, reliable, classified and organized vocabulary, allowing a prediction of gene function (Ashburner et al, 2000; Roche et al, 2005). GO terms are represented in three ontologies: Biological Processes, Cellular Components and Molecular Functions. Each classification can be organized as a directed acyclic graph. Use of GO terms allows uniformity in association of gene products identified in EST analysis independent of species, and is the most common approach to practical categorization of gene products (Ashburner et al., 2000; Conesa et al., 2005; Roche et al, 2005, Botton et al., 2008).
GO assignments for the two cell lines were quite similar, probably representing necessary functions for living cells and, in particular, for cells in culture in vitro. Within the Molecular Function classification, SAE cells showed a somewhat higher percentage of sequences in the “hydrolase” category than did LEE-1 cells (14% vs 12%). Within the Biological Process classification, LEE-1 cells showed a higher percentage of sequences in the “developmental process” category than did SAE cells (10% vs 6.7%).
Further differences in LEE-1 compared to SAE represented one category in each of the classifications Cellular Component and Molecular Function. In the Cellular Component classification, approximately 3% of the sequences fell under the category “envelope”. This term includes gene products comprising multilayered structures surrounding all or part of a cell and encompassing one or more lipid bilayers, and may indicate increased organelle compartments within LEE-1 cells compared to SAE cells. In Molecular Function, “oxidoreductase activity” comprised approximately 5% of the sequences. This term includes all gene products involved in the catalysis of an oxidation-reduction (redox) reaction. The higher oxidoreductase activity in LEE-1 cells may indicate a role for these cells in responses associated with innate immunity or in steroidogenesis. GO analysis of SAE cells identified an additional category, “anatomical structure formation”, under the Biological Process classification, that was not present in LEE-1 cells. This term refers to gene products involved in the formation, from unspecified parts, of an anatomical structure, either macroscopic or microscopic, possibly representing increased structural organization associated with SAE cells compared to LEE-1 cells. Beyond these speculations, the significance of the differences in GO assignments and their relationship to differences between the two cell lines is unknown.
The present study is the first with cell lines from cartilaginous fish, and revealed a significant number of ESTs for which no homologue in other organisms could be identified: 43% for the SAE cell line and 36% for the LEE-1 cell line. Further genomic analysis is necessary to explore the functions of the genes represented by these transcripts, and generation of additional ESTs will likely provide additions to this list. The SAE and LEE-1 cell lines provide useful tools for the elucidation of the physiological roles of known and previously unknown transcripts. The information obtained in this study also will contribute to the generation of cDNA expression arrays that will help in the identification of functional roles for the transcripts examined here. These approaches will add to the growing body of knowledge associated with S. acanthias, L. erinacea and other cartilaginous fish, and advance our understanding of evolution, development, and other disciplines.
Acknowledgments
Supported by NIH grants R01-RR019732, P20-RR016463, and P30-ES03828. Amber Miller is thanked for inspiration.
Footnotes
Publisher's Disclaimer: This is a PDF file of an unedited manuscript that has been accepted for publication. As a service to our customers we are providing this early version of the manuscript. The manuscript will undergo copyediting, typesetting, and review of the resulting proof before it is published in its final citable form. Please note that during the production process errors may be discovered which could affect the content, and all legal disclaimers that apply to the journal pertain.
References
- Altschul SF, Madden TL, Schaffer AA, Zhang J, Zhang Z, Miller W, Lipman DJ. Gapped BLAST and PSI-BLAST: a new generation of protein database search programs. Nucleic Acids Res. 1997;25:3389–3402. doi: 10.1093/nar/25.17.3389. [DOI] [PMC free article] [PubMed] [Google Scholar]
- Ashburner M, Ball CA, Blake JA, Dotstein D, Butler H, Cherry JM, Davis AP, Dolinski K, Dwight SS, Eppig JT, Harris MA, Hill DP, Issel-Tarver L, Kasarskis A, Lesiw S, Matese JC, Richardson JE, Ringwald M, Rubin GM, Sherlock G. Gene ontology: Tool for the unification of biology. The Gene Ontology Consortium. Nat. Genet. 2000;25:25–29. doi: 10.1038/75556. [DOI] [PMC free article] [PubMed] [Google Scholar]
- Ballatori N, Boyer JL, Rockett JC. Exploiting genome data to understand the function, regulation, and evolutionary origins of toxicologically relevant genes. EHP Toxicogenomics. 2003;111:61–65. [PubMed] [Google Scholar]
- Barnes DW, Parton A, Tomana M, Hwang J, Czechanski A, Collodi P. Stem cells from cartilaginous and bony fish. Methods in Cell Biology. 2008;86:343–367. doi: 10.1016/S0091-679X(08)00016-2. [DOI] [PubMed] [Google Scholar]
- Botton A, Galla G, Conesa A, Bachem C, Ramina A, Barcaccia G. Large-scale Gene Ontology analysis of plant transcriptome-derived sequences retrieved by AFLP technology. BMC Genomics. 2008;9:347–366. doi: 10.1186/1471-2164-9-347. [DOI] [PMC free article] [PubMed] [Google Scholar]
- Chomczynski P, Sacchi N. Single step method of RNA isolation by acid guanidinium thiocyanate-phenol-chloroform extraction. Anal Biochem. 1987;162:156. doi: 10.1006/abio.1987.9999. [DOI] [PubMed] [Google Scholar]
- Conesa A, Gotz S, Garcia-Gomez JM, Terol J, Talon M, Robles M. Blast2GO: a universal tool for annotation, visualization and analysis in functional genomics research. Bioinformatics. 2005;21:3674–3676. doi: 10.1093/bioinformatics/bti610. [DOI] [PubMed] [Google Scholar]
- Ewing B, Green P. Base-calling of automated sequencer traces using phred. I. Accuracy assessment. Genome Res. 1998a;8:175–185. doi: 10.1101/gr.8.3.175. [DOI] [PubMed] [Google Scholar]
- Ewing B, Green P. Base-calling of automated sequencer traces using phred. II. Error probabilities. Genome Res. 1998b;8:186–194. [PubMed] [Google Scholar]
- Forest D, Nishikawa R, Kobayashi H, Parton A, Bayne CJ, Barnes DW. RNA expression in a cartilaginous fish cell line reveals ancient 3’ noncoding regions highly conserved in vertebrates. Proc. Natl. Acad. Sci. USA. 2007;104:1224–1229. doi: 10.1073/pnas.0610350104. [DOI] [PMC free article] [PubMed] [Google Scholar]
- Helmrich A, Barnes D. Zebrafish embryo cell culture. Meths Cell Biol. 1999;59:29–38. doi: 10.1016/s0091-679x(08)61818-x. [DOI] [PubMed] [Google Scholar]
- Hwang J-H, Parton A, Czechanski A, Ballatori N, Barnes D. Arachidonic acid-induced expression of the organic solute and steroid transporter-beta (Ost-beta) in a cartilaginous fish cell line. Comp Biochem Physiol C. 2008;148:39–47. doi: 10.1016/j.cbpc.2008.03.005. [DOI] [PMC free article] [PubMed] [Google Scholar]
- Kobayashi H, Parton A, Czechanski A, Durkin C, Kong J, Barnes DW. Multidrug.-resistance-associated protein 3 (Mrp3/Abcc3/Moat-D) is expressed in the SAE Squalus acanthias shark embryo-derived cell line. Zebrafish. 2007;4:261–275. doi: 10.1089/zeb.2007.0520. [DOI] [PMC free article] [PubMed] [Google Scholar]
- Mattingly C, Parton A, Dowell L, Rafferty J, Barnes D. Cell and molecular biology of marine elasmobranchs: Squalus acanthias and Raja erinacea. Zebrafish. 2004;1:111–120. doi: 10.1089/zeb.2004.1.111. [DOI] [PubMed] [Google Scholar]
- Parkinson J, Anthony A, Wasmuth J, Schmid R, Hedley A, Blaxter M. PartiGene—constructing partial genomes. Bioinformatics. 2004;20:1398–1404. doi: 10.1093/bioinformatics/bth101. [DOI] [PubMed] [Google Scholar]
- Parton A, Forest D, Kobayashi H, Dowell LM, Bayne CJ, Barnes D. Cell and molecular biology of SAE, a cell line from the spiny dogfish shark, Squalus acanthias. Comp Biochem Physiol C. 2007;145:111–119. doi: 10.1016/j.cbpc.2006.07.003. [DOI] [PubMed] [Google Scholar]
- Roche JP, Wackym PA, Cioffi JA, Kwitek AE, Erbe CB, Poper P. In silico analysis of 2085 clones from a normalized rat vestibular periphery 3’ cDNA library. Audiol. Neurootol. 2005;10:310–322. doi: 10.1159/000087348. [DOI] [PMC free article] [PubMed] [Google Scholar]


