Abstract
Cardiac fibroblasts (CFs) play a key role in response to injury and remodeling of the heart. Nucleotide (P2) receptors regulate the heart but limited information is available regarding such receptors in CFs. We thus sought to determine if extracellular nucleotides regulate fibrotic responses (e.g., proliferation, migration and expression of profibrotic markers) of CFs in primary culture. UTP increased rat CF migration 3-fold (p < 0.001), proliferation by 30% (p < 0.05) and mRNA expression of profibrotic markers: alpha smooth muscle actin (α-SMA), plasminogen activator inhibitor-1 (PAI-1), transforming growth factor beta, soluble ST2, interleukin-6 and monocyte chemoattractant protein-1 (MCP-1) by 3.0-, 15-, 2.0-, 7.6-, 11-, and 6.1-fold, respectively (p < 0.05). PAI-1 protein expression induced by UTP was dependent on protein kinase C (PKC) and extracellular signal-regulated kinase (ERK), based on blockade by the PKC inhibitor Ro-31-8220 and the ERK inhibitor U0126, respectively. The rank order for enhanced expression of PAI-1 and α-SMA by nucleotides (UTPγS≫UDPβS≫ATPγS), the expression of P2Y2 receptors as the most abundantly expressed P2Y receptor in rat CFs and a blunted response to UTP in P2Y2−/− mice all implicate P2Y2 as the predominant P2Y receptor that mediates nucleotide-promoted profibrotic responses. Additional results indicate that P2Y2 receptor-promoted profibrotic responses in CFs are transient, perhaps as a consequence of receptor desensitization. We conclude that P2Y2 receptor activation is profibrotic in CFs; thus inhibition of P2Y2 receptors may provide a novel means to diminish fibrotic remodeling and turnover of extracellular matrix in the heart.
Keywords: ATP, cardiac fibroblasts, purinergic signaling, P2Y receptors, PAI-1, UTP
Introduction
Heart failure is a major cause of morbidity and mortality in economically developed countries. Although heart failure is classically characterized by systolic dysfunction, i.e., decreased cardiac contraction, inadequate filling of the heart, diastolic dysfunction, is increasingly recognized as an important contributor to heart failure [1–3].
Increased deposition of extracellular matrix (ECM) in the heart, cardiac fibrosis, increases the stiffness of the myocardium, thereby contributing to impaired diastolic function. Fibrosis accompanies many types of cardiac pathology, including hypertensive heart disease, post myocardial infarction remodeling, diabetic cardiomyopathy and in aging [1, 3–5]. Cardiac fibroblasts (CFs), the most numerous cell type in the heart, play a key role in the homeostatic maintenance of the ECM [6].
CFs are regulated by profibrotic and antifibrotic signals. Transforming growth factor-β (TGF-β) and angiotensin II (Ang II) are two profibrotic peptides that induce signaling events in CFs to increase ECM synthesis. TGF-β activates protein kinase receptors while Ang II signals through Gq-coupled AT1 G-protein-coupled receptors (GPCRs) [4, 7, 8]. Offsetting such pro-fibrotic effects, signaling through cAMP and its downstream mediators induce antifibrotic responses [9, 10].
Nucleotides (ATP, ADP, UTP and UDP) can be released into the interstitial space in response to stimuli that include mechanical stretch, chemical stress, platelet activation and cell death [11]. Extracellular nucleotides can then stimulate plasma membrane-localized nucleotide receptors: P2X receptors, which are ion channels and P2Y receptors, which are GPCRs [12]. P2X receptors preferentially interact with ATP while the 8 P2Y receptor subtypes are adenine nucleotide-preferring (P2Y1, P2Y2, P2Y11, P2Y12 and P2Y13), uridine nucleotide-preferring (P2Y2, P2Y4 and P2Y6) or responsive to sugar nucleotides (P2Y14) [12]. Cell type-specific expression of particular P2Y receptors determines the responses to nucleotide stimulation. In cardiomyocytes, at least three subtypes of P2Y receptors can increase inotropy, regulate hypertrophic growth and modulate the response to pressure overload [13–17]. Limited data are available regarding P2Y receptors in CFs. We thus sought to determine if extracellular nucleotides regulate profibrotic responses of CFs and if so, the identity of the P2Y receptors that mediate such responses.
Materials and Methods
Reagents
UTP, UDP, ATPγS and Ro-31-8220 were purchased from Sigma. Antibody to PAI-1 was from BD Biosciences, α-SMA antibody was from Sigma, ERK antibodies were from Stressgen and GAPDH antibody was from Abcam. U0126 was from Tocris. Antibody to P2Y2 receptors was from Alomone. UTPγS and UDPβS were a kind gift from Prof. D. Erlinge (University of Lund, Sweden).
Isolation and Culture of Adult Rat and Mouse CFs
CFs were isolated from adult Sprague–Dawley rats (250 – 300 g, male) or C57/BL6 wild-type or P2Y2−/− mice (20 – 25 g, male), as previously described [18]. Briefly, CFs were separated from cardiac myocytes by gravity separation and grown to confluency on 10-cm cell culture dishes at 37°C with 90% air/10% CO2 in growth media (DMEM/10% FBS/1% penicillin/1% streptomycin). All animals were cared for in compliance with the guiding principles of the American Physiological Society and as approved by the UCSD Institutional Animal Care and Use Committee.
[3H]Thymidine Incorporation
[3H]Thymidine incorporation was used to assess DNA synthesis. CFs (1.5 × 10⁵ per well) were seeded into a 12-well culture plate and serum-starved overnight. One µCi (1 Ci = 37 GBq) of [3H]thymidine/ml was added in combination with UTP or vehicle control and the cells were incubated for 24 or 48 h at 37°C. The cells were washed with cold PBS and 7.5% TCA and then dissolved in 0.5 M NaOH before liquid scintillation counting.
CF Migration
Migration of CFs was assayed by using the Boyden chamber method. The cells were maintained in serum-free conditions for 24 h and then suspended in serum-free DMEM at a density of 1 × 10⁵ CFs/100 µl in uncoated chamber inserts. Basal migration was assessed by adding serum-free DMEM (600 µl) to the lower chambers. Cells were allowed to migrate for 16 h, then fixed in 10% formalin and stained with Hema 3 (Fisher Scientific). Cells on the upper surface of the membrane were mechanically removed with a cotton swab. Cells that migrated were counted from 3 different fields (0.1 mm2/field)
Real-time Polymerase Chain Reaction (RT-PCR)
Total RNA was isolated by using RNeasy (Qiagen) and cDNA was generated using the Superscript III cDNA synthesis system (Invitrogen) according the manufacturers’ instructions. RT-PCR analysis was performed on a DNA Engine Opticon 2 (Biorad) using the qScript™ One-Step qRT-PCR kit (Quanta Biosciences). Primers for PCR amplification (Table 1) were designed based on the nucleotide sequences of the respective gene target and for P2Y receptors were from ref. [19]. When possible, each forward and reverse primer set was designed between multiple exons. Amplification efficiency of each primer pair was tested prior to analysis. Relative gene expression levels were determined using the ΔΔCT method [20] with 18S as the reference gene.
Table 1.
Oligonucleotides used for real-time RT-PCR
| Gene | Forward, 5’–3’ | Reverse, 5’–3’ |
|---|---|---|
| 18s | GTA ACC CGT TGA ACC CCA TT | CCA TCC AAT CGG TAG TAG CG |
| α-SMA | CAT CAG GAA CCT CGA GAA GC | TCG GAT ACT TCA GGG TCA GG |
| PAI-1 | GGA GAA GCG AAA CAG GAG TG | TCC AGA AGG GGA TAT GTT GC |
| sST2 | TTA CCC AGC CAG GAT GTT TC | CTA GGG GCT TGG CTT CTC TT |
| TGF-β1 | CCT GGA AAG GGC TCA ACA | GTT GGT TGT AGA GGG CAA GG |
| IL-6 | GCC TTC CCT ACT TCA CAA GTC C | CTG ACC ACA GTG AGG AAT GTC C |
| MCP-1 | CTT CTG GGC CTG TTG TTC A | TTC CTT ATT GGG GTC AGC AC |
| P2Y1 | AAC CGT GAT GTG ACC ACT GA | TTC AAC TTG TCC GTT CCA CA |
| P2Y2 | TGC TGG GTC TGC TTT TTG CT | ATC GGA AGG AGT AAT AGA GGG T |
| P2Y4 | TCG ATT TGC AAG CCT TCT CT | CCA TAG GAG ACC AGG GTG AT |
| P2Y6 | TGC TGC TAC CCC CAG TTT AC | TGG CAT AGA AGA GGA AGC GT |
| P2Y12 | GGA TTC CCT ACA CCC TGA GC | ACC TTC CTG TCC TTT CTT CT |
Immunoblot Analysis
Whole cell lysates were prepared in NaCO3 buffer (pH 11) and homogenized by sonication. Equal amounts of protein (assayed using a dye-binding reagent, Bio-Rad) were separated by SDS/PAGE using 10% polyacrylamide precast gels (Invitrogen) and transferred to a poly(vinylidene difluoride) membrane with the iBlot system (Invitrogen). Membranes were blocked in PBS Tween (1%) containing 5% nonfat dry milk and incubated with primary antibody 18 h at 4°C. Bound antibodies were visualized using horseradish peroxidase-conjugated secondary antibodies (Santa Cruz Biotechnology) and ECL reagent (Amersham Pharmacia). Bands were compared to molecular weight standards to confirm migration of proteins at the appropriate size. Quantitation of protein expression densitometry was performed using ImageJ software (NIH).
Flow Cytometry
FACS analysis was performed on a BD FACScan flow cytometer equipped with an argon laser capable of excitation at 488 nm. FITC fluorescence was detected with a 530/30 bandpass filter (FL-1). Amplifier gains and instrument voltage were not changed for the duration of each experiment. CFs were serum-starved in DMEM overnight and treated for 4 and 24 h with UTP, UTPγS, or Ang II. Cells were then detached with PBS with 5mM EDTA (pH 7.2), fixed in 1.5% formalin and permeabilized in ice-cold methanol.
CFs were washed in PBS containing 1% BSA, 0.05% NaN3 and incubated for 1 h at room temperature with antibody against α-SMA, PAI-1, or mouse-isotype control antibody diluted in PBS/1% BSA. Cells were washed and incubated for 30 min with Alexa Fluor 488 donkey anti-mouse antibody (Invitrogen) and then washed and resuspended in PBS for FACScan analysis. Fluorescence was acquired in log-scale via an FL-1 filter and data was analyzed and plotted with CellQuest (BD) and Weasel (WEHI).
Immunofluorescence Analysis
Cardiac ventricles were harvested, frozen and mounted on a cryostat to cut 10-µm sections. Sections were fixed in cold acetone, blocked with 4% BSA in 0.1% Tween and PBS, and incubated with primary antibodies (1:100) in 4% BSA/0.1% Tween/PBS. After incubation with Alexa-conjugated secondary antibody (Molecular Probes) (1:250), samples were mounted in Vectashield (Vector Laboratories) mounting media containing DAPI. Specificity of staining was determined by omission of the primary antibody. Images were obtained by using a Zeiss LSM510 Laser Scanning Confocal Microscope and Zeiss Image Examiner software.
Statistical Analysis
Calculations and statistics were performed using GraphPad Prism 5.0 software. Values are presented as mean ± S.E.M. ANOVA with Dunnett’s post-test was used to compare quantitative RT-PCR relative expression data with untreated controls. Analysis of experiments with multiple comparisons was by ANOVA with Bonferroni’s correction.
Results
UTP Induces Proliferation and Migration in Rat CFs
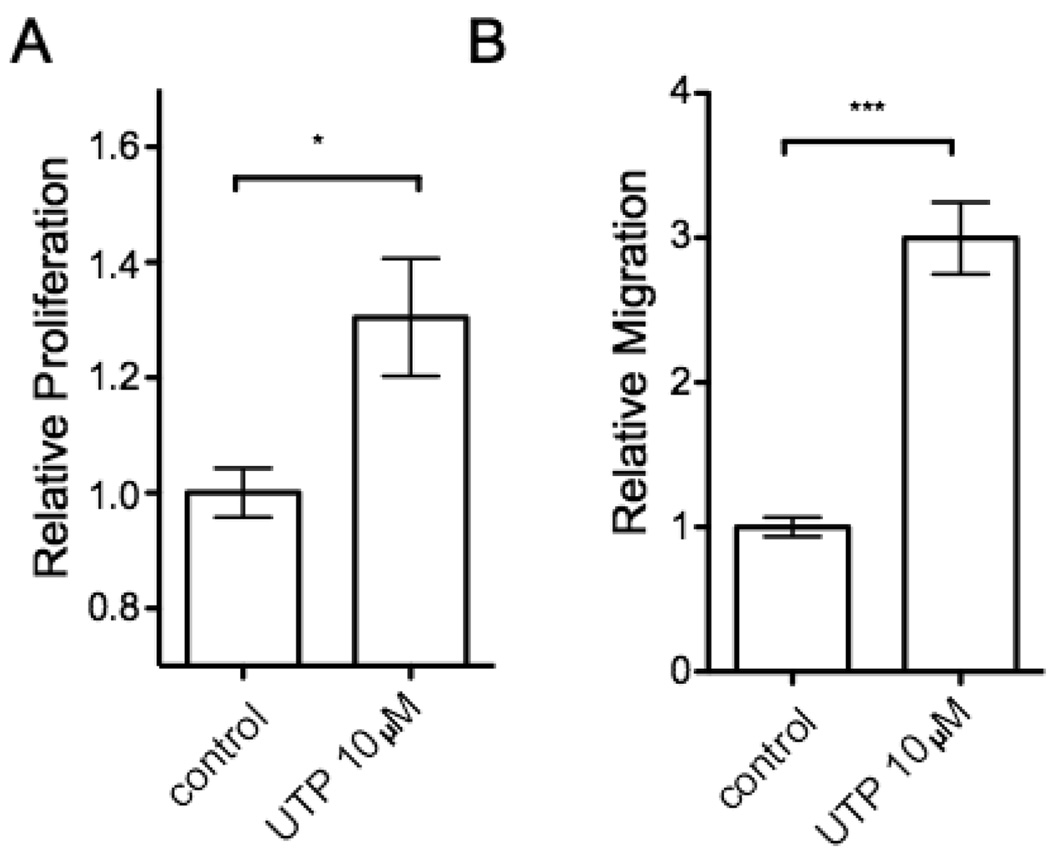
Proliferation and migration of CFs are key events in the fibrotic response of cardiac remodeling and extracellular nucleotides are known to have mitogenic effects in other cell types such as vascular smooth muscle cells [21]. Stimulation of serum-starved, quiescent rat CFs with 10 µM UTP increased [3H]thymidine incorporation by 24 h (Fig. 1A). We observed a similar effect with 10 µM ATP at 24 h (data not shown). UTP also induced a 3-fold-increase (p < 0.001) in cell migration by 24 h, as assessed by the Boyden chamber method (Fig. 1B).
Figure 1. UTP induces proliferation and migration of rat cardiac fibroblasts.
(A) Proliferation of passage 1 rat CFs serum-starved for 24h and stimulated with 10 µM UTP was examined by [3H]thymidine incorporation. UTP increased [3H]thymidine incorporation by 30% after 24 h. (B) Fibroblast migration was assessed by a modified Boyden chamber method in the absence (control) or presence of 10 µM UTP for 24 h. The data are shown as the fold-increase relative to control and are mean ± SEM of at least 3 independent experiments performed in triplicate and compared by using Student’s t test. *, p < 0.05 and ***, p < 0.001 in response to UTP.
UTPγS Induces Transcription of Profibrotic Genes
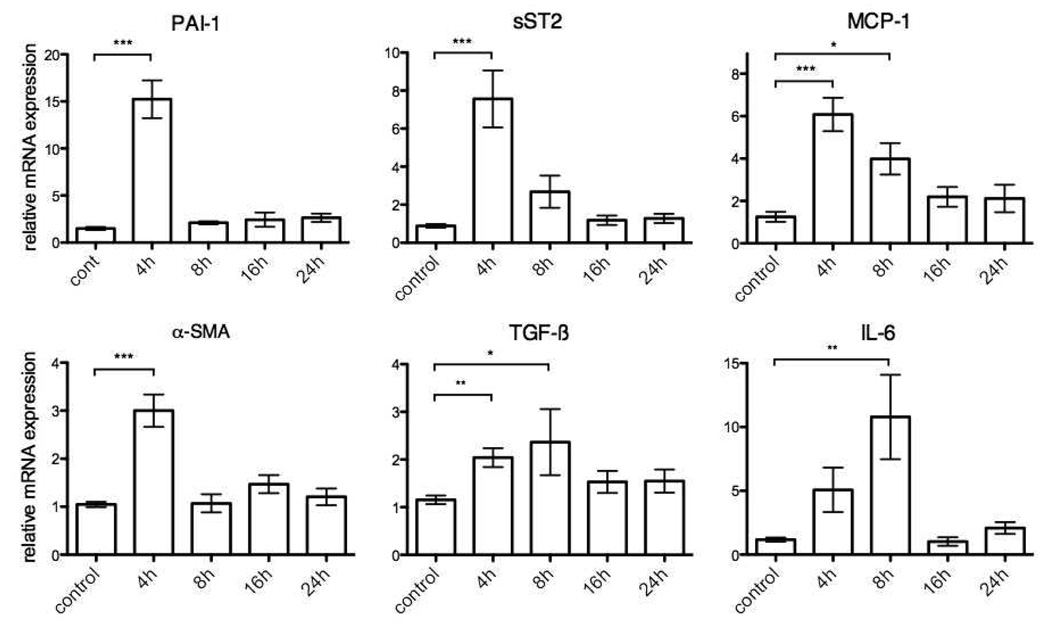
The fibrotic response in the heart is modified by a large number of genes that regulate ECM homeostasis. Alpha smooth muscle actin (α-SMA) is a marker of the conversion of resting CFs to activated, phenotypically distinct myofibroblasts. Incubation of rat CFs with UTPγS (10 µM, 4 h) increased the expression of α-SMA mRNA 3.0-fold (p < 0.001) (Fig. 2). Plasminogen activator inhibitor (PAI-1) plays a key role in tissue fibrosis as a protease inhibitor that regulates matrix metalloproteinases [22]. UTPγS (10 µM, 4 h) increased PAI-1 mRNA expression 15-fold (p < 0.001) and mRNA expression of soluble ST2 (sST2), a receptor for interleukin-33, a prognostic marker in heart failure 7.6-fold (p < 0.001) (Fig. 2) [23]. In addition, 4 h UTPγS increased mRNA expression of the proinflammatory, profibrotic factors TGF-β and monocyte chemoattractant protein-1 (MCP-1) by 2.0- and 6.1-fold, respectively (p < 0.01 and p<0.001, respectively) (Fig. 2). UTP transiently stimulated profibrotic and proinflammatory markers in CFs. Even with the use of an ectonucleotidase-resistant analog, UTPγS, most gene expression was only significantly up-regulated at 4 h of treatment, with the exception of interleukin-6 (IL-6) which had a peak 11-fold increase (p<0.01) in mRNA levels after 8 h (Fig. 2). Desensitization of P2Y receptors rather than degradation of extracellular UTP thus likely accounts for the decrease in responses over the 24 h period of treatment, especially because CF treated with TGF-β or Ang II show increased profibrotic gene expression past 24 h (data not shown).
Figure 2. UTPγS induces transcription of profibrotic genes in rat cardiac fibroblasts.
CFs were serum-starved for 24 h and then incubated with UTPγS (10 µM) for 4, 8, 16, or 24 h. Real-time RT-PCR was used to quantify PAI-1, α-SMA, sST2, TGF-β1, MCP-1 and IL-6; the data are normalized to 18S RNA. UTPγS (10 µM) at 4 h stimulated peak upregulation of profibrotic genes: PAI-1, α-SMA, sST2, TGF-β, MCP-1 by 15-, 3.0-, 7.6-, 2.0-, 6.1-fold, respectively. IL-6 expression peaked at 8 h by 11-fold. The data shown represent mean ± SEM of at least 3 independent experiments performed in triplicate and compared by using Student’s t test. *, p<0.05; **, p<0.01 and ***, p<0.001 in response to UTPγS.
UTP Induces PAI-1 Protein Expression in a Dose- and Time-Dependent Manner but Response to UTP Desensitizes
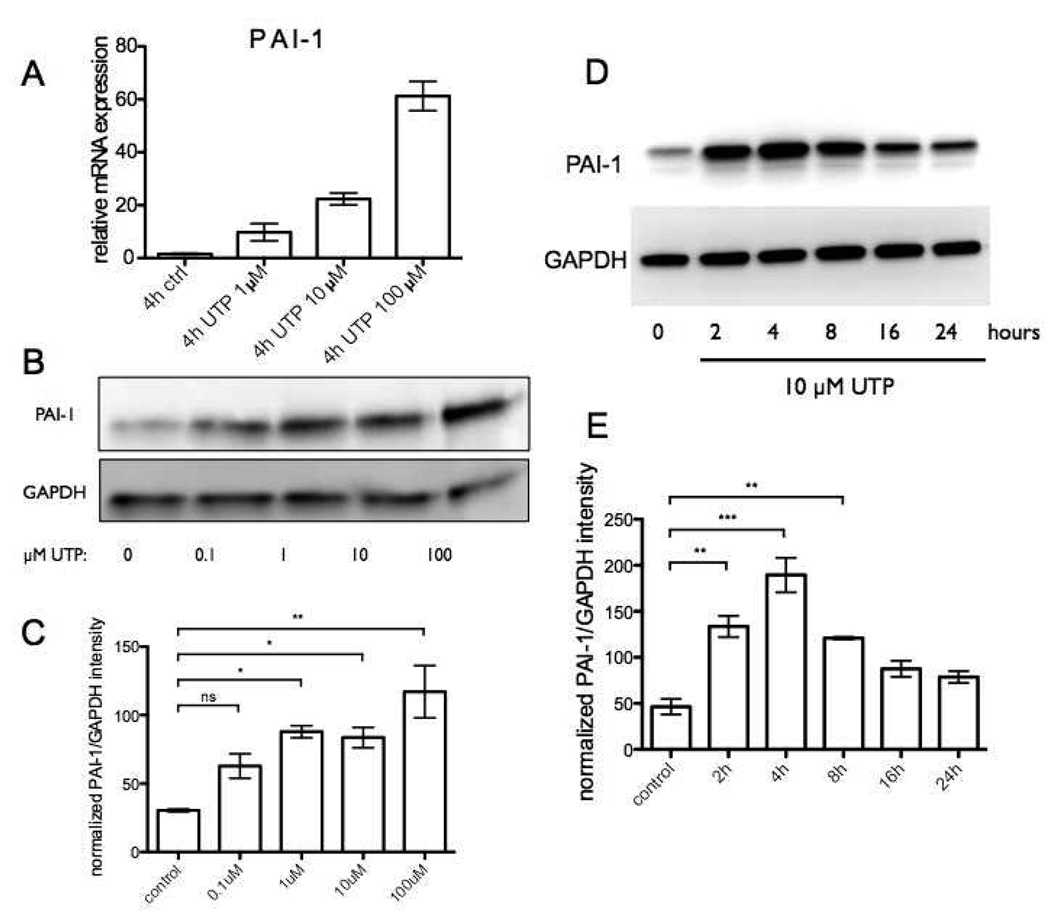
We further characterized PAI-1 expression in UTP-treated CFs since its mRNA increase was the most prominent of all the markers we tested. UTP dose-dependently increased mRNA and protein expression of PAI-1 (Fig. 3A–C). PAI-1 protein expression increased within 2 h, peaked after 4 h and gradually decreased to basal levels after 24 h (Fig. 3D, E), consistent with the trend in PAI-1 mRNA expression after UTP stimulation. UTPγS produced a similar time-dependent pattern of PAI-1 protein expression (data not shown).
Figure 3. UTP induces PAI-1 protein expression in a dose- and time-dependent manner but response to UTP desensitizes.
(A–C) CFs were serum-starved for 24h and then stimulated with 0 – 100 µM UTP for 4h. Cells were assayed by real-time RT-PCR to quantify mRNA expression and immunoblot analysis to quantify protein expression of PAI-1. UTP dose-dependently increased PAI-1 mRNA expression (A) and protein expression (B). (C) Quantification of PAI-1 protein from two independent Western blots is shown as ± SEM compared by using ANOVA with post-hoc multiple comparison tests. *, p<0.05 and **, p<0.01. (D) Time-dependent increase in PAI-1 protein expression was observed after 2 h, peaked after 4 h and decreased to baseline levels after 24 h. (E) Quantification is shown from two independent Western blots as ± SEM compared by using ANOVA with post-hoc multiple comparison tests. **, p<0.01 and ***, p<0.001.
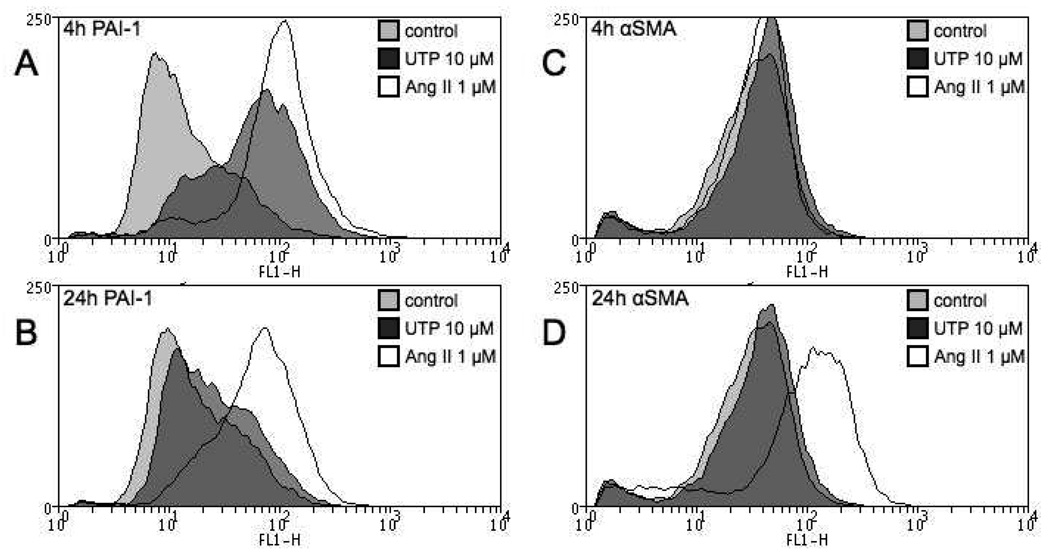
Flow cytometry was used as an additional approach to assess PAI-1 protein expression and also, that of α-SMA in rat CFs. Consistent with the data obtained by RT-PCR and Western blotting, we found that UTP increases PAI-1 expression at 4 h (Fig. 4A). However, by 24 h the enhanced PAI-1 expression reverts nearly to baseline levels even though Ang II produces sustained upregulation of PAI-1 expression (Fig. 4B). Furthermore, CFs are less responsive to UTP than to Ang II (Fig. 4A, B) and UTP does not seem to enhance α-SMA protein expression at either 4 or 24 h. The initial rise in α-SMA mRNA levels (Fig 2) thus does not lead to a later increase in protein expression (Fig. 4C, D). UTPγS elicited the same response as UTP in all time points (data not shown). Interestingly, the enhanced expression of α-SMA in response to Ang II is not observed after 4 h treatment but only at 24 h, suggesting that the increase in α-SMA production requires persistent signaling, which does not occur with stimulation by UTP.
Figure 4. UTP has no effect on α-SMA protein expression of rat CFs.
Cells were serum-starved for 24 h, treated with UTP (10 µM) or Ang II (1 µM) for 4 or 24 h and protein expression analyzed via flow cytometry. (A) 4 h UTP treatment increased PAI-1 expression in CFs but this increase reverts to basal levels by 24 h (B). Ang II increases PAI-1 at 4 and 24 h (A, B). UTP does not increase α-SMA at 4 h (C) or 24 h (D) but Ang II stimulation for 24 h significantly increases α-SMA protein expression (D).
UTP Induces PAI-1 Expression in an Erk-and PKC-dependent Manner
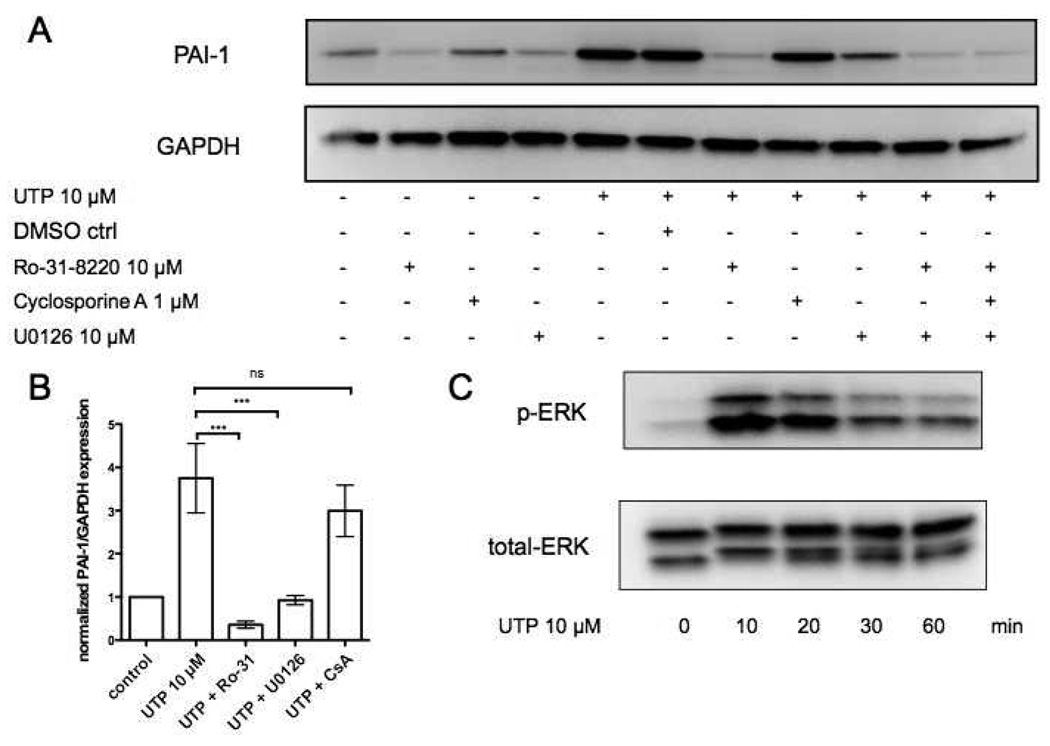
P2Y2, P2Y4 and P2Y6 receptors couple to Gq and increase diacylglycerol and intracellular Ca2+ leading to protein kinase C (PKC) activation [12]. Treatment of CFs with the PKC inhibitor Ro-31-8220 abolished UTP-induced PAI-1 expression (Fig. 5A, B). Consistent with the ability of P2Y receptors to increase extracellular signal-regulated kinase (ERK) signaling [12], the MAPK/ERK kinase (MEK) inhibitor U0126 decreased UTP-induced PAI-1 expression (Fig. 5A, B); such an effect may derive from transactivation of the EGF receptor or GPCR activation of ERK by Gβγ subunits [24]. UTP stimulated ERK-phosphorylation in CFs (Fig. 5C). The calcineurin inhibitor cyclosporine A did not affect UTP-induced PAI-1 response (Fig. 5A, B).
Figure 5. UTP induces PAI-1 expression in rat cardiac fibroblasts in a PKC and ERK-dependent manner.
(A) CFs were serum-starved for 24h and then incubated in the presence or absence of: DMSO (vehicle control), Ro-31-8220 (PKC inhibitor), U0126 (MAPK/ERK kinase (MEK) inhibitor), or Cyclosporine A (calcineurin inhibitor) for 30 min. The cells were then stimulated with UTP (10µM, 4 h). Cells were lysed and assayed for PAI-1 protein expression. GAPDH was used to normalize for protein loading. Panel (B) shows quantification of the immunoblots from panel (A). (C) ERK-phosphorylation and total ERK protein were assessed using immunoblots following stimulation with 10 µM UTP for 0, 10, 20, 30, 60 min. The data shown are mean ± SEM of at least 3 independent experiments performed in triplicate and compared by using ANOVA with post-hoc multiple comparison tests. ***, p<0.001.
UTP-induced Effects Are Predominately Mediated by P2Y2 Receptors
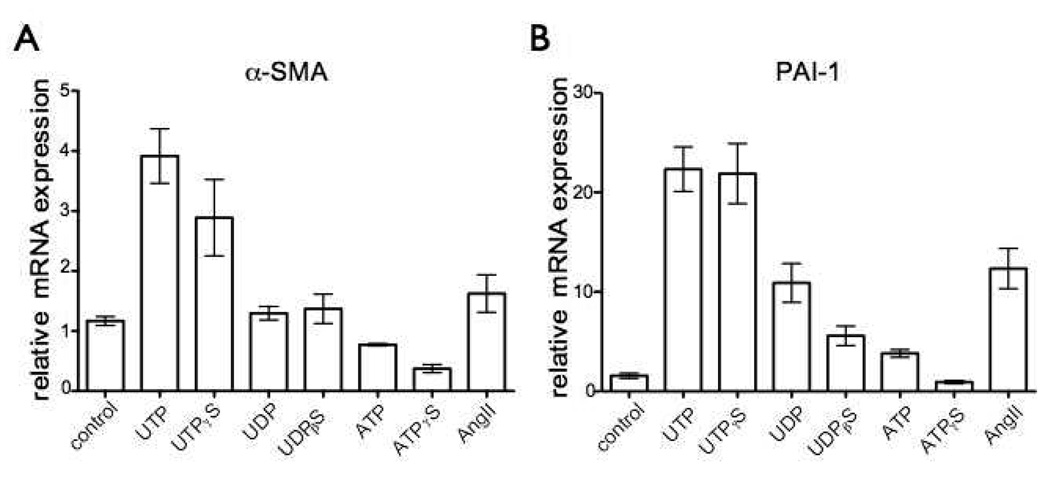
UTP can stimulate P2Y2 and P2Y4 receptors but in addition, UTP is hydrolyzed to UDP, which acts on P2Y6 receptors [12]. To identify the P2Y receptor responsible for the effects of UTP that we observed on CFs we used ATP, UDP and the stable nucleotides ATPγS, UDPβS and UTPγS and found that the effects of UTPγS (10 µM) on α-SMA and PAI-1 mRNA expression were similar to those observed with UTP (Fig. 6A, B). By contrast, incubation of CFs with UDP (10 µM) or the stable agonist UDPβS (10 µM) did not increase α-SMA expression and increased PAI-1 to a lesser extent than did UTP (Fig. 6A, B). Expression of PAI-1 and α-SMA mRNA was not significantly increased by ATP or ATPγS (both 10 µM) (Fig. 6A, B). The rank order for nucleotide-promoted increase in PAI-1 and α-SMA mRNA expression (UTPγS≫UDPβS≫ATPγS) suggests that either P2Y2 or P2Y4 is the main receptor that mediates UTP-induced effects. P2Y2 receptors are much more highly expressed than P2Y4 receptors in CFs (Fig. 8A), thus implicating P2Y2 as the predominant receptor sub-type that mediates response to UTP. ATP and ATPγS produce different effects than do UTP and UTPγS in terms of expression of α-SMA or PAI-1 (Fig. 6A, B). Since ATP and UTP are equipotent agonists for P2Y2 receptors, more than one subtype of P2Y receptor may mediate the effects of ATP.
Figure 6. UTP-induced effects in rat cardiac fibroblasts are predominately mediated by P2Y2 receptors.
(A–B) CFs were serum-starved for 24 h and then incubated with UTP, UTPγS, UDP, UDPβS, ATP, ATPγS (all 10 µM) or angiotensin II (Ang II) for 4 h. Cells were assayed using real-time RT-PCR to quantify mRNA expression of α-SMA (A) and PAI-1 (B). Incubation of CFs with UTP or the stable agonist UTPγS (10 µM) increased α-SMA and PAI-1 mRNA expression. UDP (10 µM) and the stable agonist UDPβS (10 µM) did not increase α-SMA expression; PAI-1 was increased but to a lesser extent than with UTP. ATP and ATPγS (both 10 µM) did not significantly increase α-SMA or PAI-1. The data shown are mean ± SEM of at least 3 independent experiments performed in triplicate and compared using ANOVA with post-hoc multiple comparison testing.
Figure 8. The P2Y2 receptor is the predominant P2Y receptor expressed in cardiac fibroblasts.
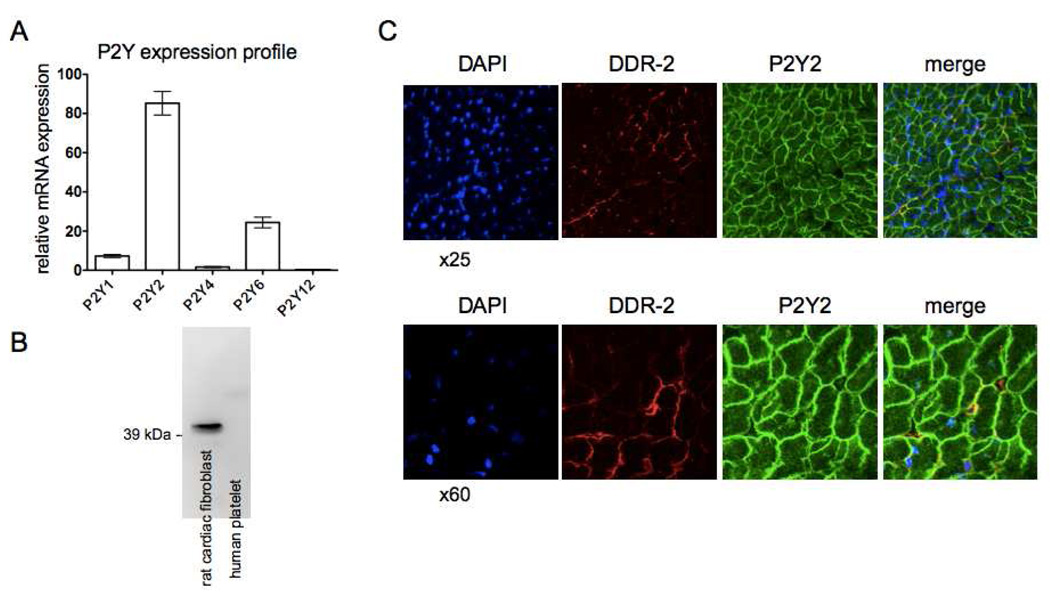
(A) Quantification of the mRNA for P2Y1, P2Y2, P2Y4, P2Y6 and P2Y12 reveals that the P2Y2 receptors are the most highly expressed P2Y receptor subtype in rat CFs. P2Y2 mRNA expression is 50-, 3.5-, and 11-fold higher than that of P2Y4, P2Y6 and P2Y1 receptors, respectively (p < 0.001). (B) Immunoblotting with a P2Y2 antibody detects P2Y2 receptors in CFs but not human platelets. (C) Sections of left ventricles from rats were stained for DDR2 (red), P2Y2 receptor (green) and nuclei with DAPI (blue). Cross-sectional images of cardiac myocytes and fibroblasts are shown.
UTP-induced PAI-1 Expression and Cell Proliferation are Blunted in P2Y2−/− Mice
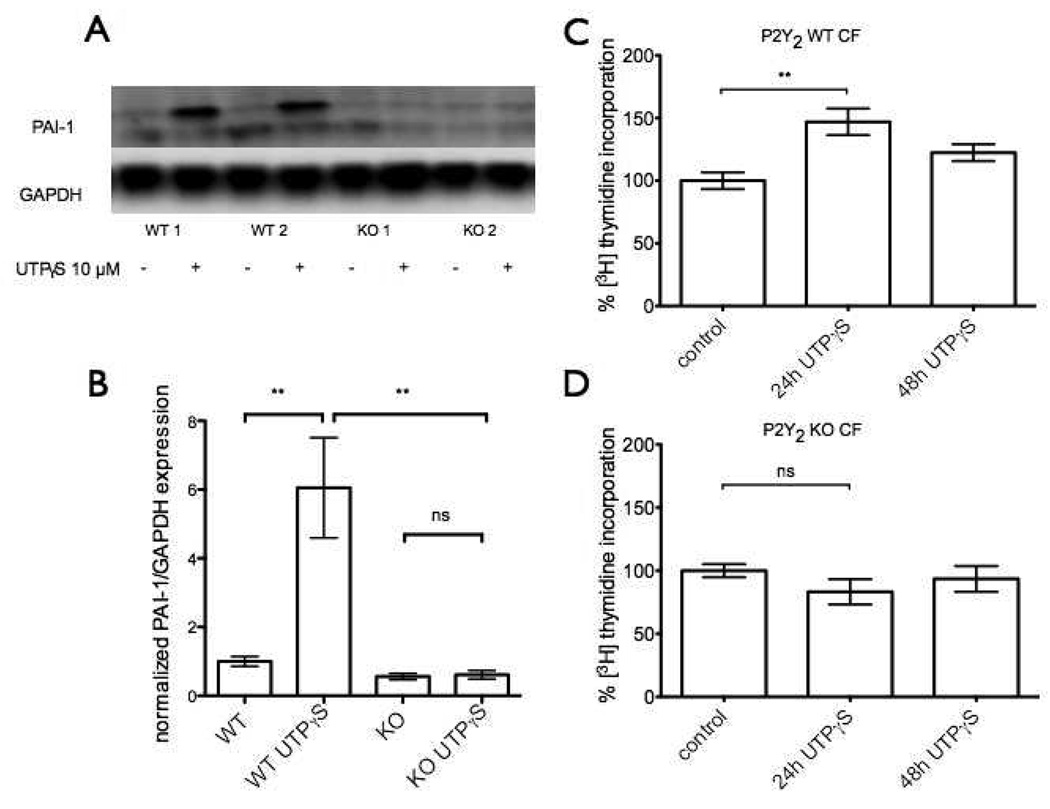
To help define the role of P2Y2 receptors in the response of CFs, we isolated CFs from wild-type and P2Y2−/− mice and assayed ability of UTP to regulate PAI-1 expression and induce proliferation. Incubation with UTPµS (10 µM) prominently increased PAI-1 protein expression in CFs from wild-type mice, an effect completely blunted in CFs from P2Y2−/− mice (Fig. 7A, B). These results indicate that the UTP-induced increase in PAI-1 expression is mediated by P2Y2-receptors in CFs from mice and provide data that are complementary to those shown in the previous section regarding the role of P2Y2 receptors in rat CFs. In addition, the stimulatory effect of UTP on CF proliferation is also blunted in P2Y2−/− cells: UTPγS (10 µM) increased proliferation of CF from WT mice by almost 50% (p<0.01) at 24 h but had no proliferative effect on CFs from P2Y2−/− mice (Fig. 7C, D). Proliferation occurred in WT CF at 24 h but not 48 h (Fig. 7C).
Figure 7. UTP-induced PAI-1 expression and cell proliferation are blunted in P2Y2−/− mice.
CFs from wild-type or P2Y2−/− mice were serum-starved for 24 h and then incubated with UTPγS (10 µM) for 4 h. Cells were assayed by immunoblot analysis to quantify protein expression of PAI-1. (A) Immunoblotting shows that UTPγS increases PAI-1 protein expression in CFs from wild-type mice but not from P2Y2−/− mice. Panel (B) shows quantification of the immunoblots from panel (A). The data shown in (B) are the mean ± SEM of at least 3 independent experiments compared by using ANOVA with post-hoc multiple comparison tests. **, p<0.01. (C) CFs from wild-type mice show ~50% increase in proliferation in response to treatment with UTPγS (10 µM) for 24 h but not 48 h. (D) UTPγS is not proliferative in CFs from P2Y2−/− at either time point.
The P2Y2 Receptor is the Predominant P2Y Receptor in Rat Cardiac Fibroblasts and is Detected on Cardiac Myocytes and Fibroblasts in Rat Left Ventricle
Quantification of mRNA for P2Y1, P2Y2, P2Y4, P2Y6 and P2Y12 revealed that the P2Y2 receptors are the most highly expressed (>50-fold higher than P2Y4 receptors, 3.5-fold more than the P2Y6 and 11-fold more than the P2Y1 receptors [p < 0.001]) in rat CFs (Fig. 8A). P2Y12 receptors are expressed at very low levels. Immunoblotting detected a single band (with the appropriate size of P2Y2 receptors) in CFs but not human platelets, a P2Y2-null tissue (Fig. 8B). Immunohistochemistry and confocal microscopy revealed P2Y2 receptor expression on cardiomyocytes in rat left ventricular tissue but also colocalized with fibroblasts, identified with a fibroblast-specific DDR-2 antibody (Fig. 8C).
Discussion
Cardiac remodeling following stress or damage to the myocardium is associated with increased morbidity and mortality [25]. Stiffening due to fibrosis is a key event in cardiac remodeling. The most effective pharmacological agents for heart failure, inhibition of the renin-angiotensin-aldosterone system and β-adrenergic receptor blockers, improve cardiac remodeling [25]. GPCR expression profiling has revealed that P2Y2 receptors are expressed in the left ventricles at a level comparable to that of Angiotensin-1 and β1-adrenergic receptors, suggesting that the P2Y2 receptors contribute to cardiac regulation and perhaps remodeling [26].
Three P2Y receptors (P2Y2, P2Y6 and a P2Y11-like receptor) increase inotropy [13, 17]. Moreover, UTP can increase hypertrophic growth of rat neonatal cardiomyocytes [14, 16]. Neonatal rat cardiac myofibroblasts were recently shown to have P2Y1-, P2Y2-, P2Y4-, P2Y6- and P2Y11-induced signaling through Gq, Gi and Gs [27]. Nishida et al described a role for P2Y6 in modulating Gα12/13 signaling and cardiac fibrosis in response to pressure overload in mice [15]. Those authors concluded that cardiac myocyte P2Y6 receptors contribute to stretch-induced modulation of the ECM but did not consider receptors on CF. Other studies suggest that UTP has a protective role in ischemia-reperfusion injury; the receptors that mediate this protection may include P2Y2 receptors [28, 29]. ATP inhibits proliferation and modulates adrenergic-promoted growth of rat neonatal CFs but the nucleotide receptor(s) and mechanisms for this response are not known [30]. Our data that implicate P2Y2 receptors in fibrotic response of CFs identify a cellular consequence of the increases in phosphoinositide hydrolysis and cellular Ca2+ promoted by cardiac P2Y2 receptors [31].
Communication between CFs and cardiomyocytes has recently been shown to contribute to cardiac development and homeostasis. Release of nucleotides by cardiomyocytes can act in an autocrine and/or paracrine manner to stimulate P2Y receptors on cardiomyocytes and also potentially receptors on CFs [32]. Our finding that P2Y2 receptors on CFs induce TGF-β, sST2 and IL-6 expression, factors that are known to be involved in CF-cardiomyocyte crosstalk, identifies a receptor that mediates such autocrine/paracrine response and CF-cardiomyocyte crosstalk.
The current results show that UTP induces proliferation, migration and an increase in profibrotic gene expression in CFs. The use of pharmacological approaches and assessment of P2Y gene expression in rats and in P2Y2-knockout mice strongly implicate a predominant role for P2Y2 receptors in these profibrotic effects. Thus, our data demonstrate a previously unappreciated role for nucleotide receptors in promoting a profibrotic phenotype in CFs. Though UTP does not increase protein expression of α-SMA, a marker of phenotypic transformation to myofibroblasts, the increase in other fibrotic markers suggests that UTP contributes to the acute-phase response after injury of CF, perhaps by modulating formation and composition of cardiac ECM.
Although UTP and ATP are equipotent in stimulating rat P2Y2 receptors [33], we find that ATP-stimulated increases in PAI-1 and α-SMA mRNA expression are less than those in response to UTP, thus implicating more than one receptor in ATP response. In mouse cardiomyocytes, which show a similar discrepancy for ATP and UTP, ATP acts via P2Y2 and P2Y11-like receptors [13]. Our finding that UTP acts predominantly via P2Y2 receptors to increase PAI-1 mRNA and protein expression in CFs contrasts with data in rat vascular smooth muscle cells in which P2Y6 receptors mediate PAI-1 induction [34].
P2Y receptors regulate the proliferation and ECM production by renal mesangial cells and exaggerated release of nucleotides and increase in P2Y-induced fibrotic responses can occur in a diabetic setting [35, 36]. Moreover, decreased degradation of extracellular nucleotides in CD39-knockout mice results in more severe glomerular sclerosis after induction of diabetes mellitus [37]. ATP also contributes to hypoxia-induced increase in growth of lung fibroblasts and P2Y receptors are profibrogenic in hepatic stellate cells [38, 39]. Our results for CFs and those for fibroblasts from kidney, lung and liver suggest that signaling via P2Y receptors is a general profibrotic mechanism.
PAI-1 was initially characterized as an inhibitor of the tissue-type and urokinase-type plasminogen activators (tPA and uPA) [40]. Plasmin formed after cleavage of plasminogen, the main substrate for tPA and uPA, regulates fibrin degradation but also matrix metalloproteinase (MMP) activation and TGF-β activation. In addition to the cleavage of plasminogen, tPA and uPA can activate several MMPs in renal fibroblasts, namely MMP-1, -2, -3, and -9 [41–43]. Moreover, PAI-1 is a critical modulator of kidney and liver fibrosis [37, 44, 45]. In the heart, PAI-1 increases in diabetes mellitus, with increasing age and contributes to cardiac fibrosis post myocardial infarction [22, 46, 47]. An acute rise in plasma PAI-1 levels after myocardial infarction is a strong prognostic indicator of mortality and development of heart failure [48, 49]. Notably, we found that PAI-1 was dramatically upregulated in CFs in response to P2Y2 receptor activation. The inhibitory role of PAI-1 on fibrinolysis and MMP activation suggests that the acute, transitory increase of PAI-1 in response to UTP may alter ECM dynamics.
In conclusion, the current results show a role for P2Y2 receptor activation in the function of CFs. Our findings imply that P2Y2 receptor inhibition is potentially a novel means to diminish fibrotic remodeling in the heart by reducing matrix production and deposition, release of PAI-1 and via MMP-promoted turnover of ECM.
Acknowledgements
This work was supported by National Institutes of Health Grant 2P01HL066941 (to PAI), Graduate Training in Cellular and Molecular Pharmacology Grant 2T32GM007752-32 (in support of DL) and the Ellison Medical Foundation. OÖB was supported by postdoctoral grants from the Tegger foundation, the Westerström foundation and from the Swedish Heart and Lung foundation. We thank Sandra Peterson and the laboratory of Dr. Martin F. Kagnoff for sharing their FACS facility.
Abbreviations
- ADP
adenosine diphosphate
- ATP
adenosine triphosphate
- CFs
cardiac fibroblasts
- DAPI
4',6-diamidino-2-phenylindole
- ECM
extracellular matrix
- ERK
extracellular signal-regulated kinase
- GPCR
G-protein-coupled receptors
- MEK
MAPK/ERK kinase
- PAI-1
plasminogen activator inhibitor-1
- PKC
protein kinase C
- α-SMA
α-smooth muscle actin
- sST2
soluble ST2
- TGF-β
transforming growth factor-β
- UDP
uridine diphosphate
- UTP
uridine triphosphate
Footnotes
Publisher's Disclaimer: This is a PDF file of an unedited manuscript that has been accepted for publication. As a service to our customers we are providing this early version of the manuscript. The manuscript will undergo copyediting, typesetting, and review of the resulting proof before it is published in its final citable form. Please note that during the production process errors may be discovered which could affect the content, and all legal disclaimers that apply to the journal pertain.
Disclosures
None
References
- 1.Espira L, Czubryt MP. Emerging concepts in cardiac matrix biology. Can J Physiol Pharmacol. 2009;87:996–1008. doi: 10.1139/Y09-105. [DOI] [PubMed] [Google Scholar]
- 2.Jessup M, Abraham WT, Casey DE, et al. 2009 focused update: ACCF/AHA Guidelines for the Diagnosis and Management of Heart Failure in Adults: a report of the American College of Cardiology Foundation/American Heart Association Task Force on Practice Guidelines: developed in collaboration with the International Society for Heart and Lung Transplantation. Circulation. 2009;119:1977–2016. doi: 10.1161/CIRCULATIONAHA.109.192064. [DOI] [PubMed] [Google Scholar]
- 3.Souders CA, Bowers SL, Baudino TA. Cardiac fibroblast: the renaissance cell. Circ Res. 2009;105:1164–1176. doi: 10.1161/CIRCRESAHA.109.209809. [DOI] [PMC free article] [PubMed] [Google Scholar]
- 4.Khan R, Sheppard R. Fibrosis in heart disease: understanding the role of transforming growth factor-beta in cardiomyopathy, valvular disease and arrhythmia. Immunology. 2006;118:10–24. doi: 10.1111/j.1365-2567.2006.02336.x. [DOI] [PMC free article] [PubMed] [Google Scholar]
- 5.van den Borne SW, Diez J, Blankesteijn WM, Verjans J, Hofstra L, Narula J. Myocardial remodeling after infarction: the role of myofibroblasts. Nat Rev Cardiol. 2010;7:30–37. doi: 10.1038/nrcardio.2009.199. [DOI] [PubMed] [Google Scholar]
- 6.Camelliti P, Borg TK, Kohl P. Structural and functional characterisation of cardiac fibroblasts. Cardiovasc Res. 2005;65:40–51. doi: 10.1016/j.cardiores.2004.08.020. [DOI] [PubMed] [Google Scholar]
- 7.Salazar NC, Chen J, Rockman HA. Cardiac GPCRs: GPCR signaling in healthy and failing hearts. Biochim Biophys Acta. 2007;1768:1006–1018. doi: 10.1016/j.bbamem.2007.02.010. [DOI] [PMC free article] [PubMed] [Google Scholar]
- 8.Tang CM, Insel PA. GPCR expression in the heart; "new" receptors in myocytes and fibroblasts. Trends Cardiovasc Med. 2004;14:94–99. doi: 10.1016/j.tcm.2003.12.007. [DOI] [PubMed] [Google Scholar]
- 9.Swaney JS, Patel HH, Yokoyama U, et al. Adenylyl cyclase activity and function are decreased in rat cardiac fibroblasts after myocardial infarction. Am J Physiol Heart Circ Physiol. 2007;293:H3216–H3220. doi: 10.1152/ajpheart.00739.2007. [DOI] [PubMed] [Google Scholar]
- 10.Yokoyama U, Patel HH, Lai NC, Aroonsakool N, Roth DM, Insel PA. The cyclic AMP effector Epac integrates pro- and anti-fibrotic signals. Proc Natl Acad Sci U S A. 2008;105:6386–6391. doi: 10.1073/pnas.0801490105. [DOI] [PMC free article] [PubMed] [Google Scholar]
- 11.Erlinge D, Burnstock G. P2 receptors in cardiovascular regulation and disease. Purinergic Signal. 2008;4:1–20. doi: 10.1007/s11302-007-9078-7. [DOI] [PMC free article] [PubMed] [Google Scholar]
- 12.Abbracchio MP, Burnstock G, Boeynaems JM, et al. International Union of Pharmacology LVIII: update on the P2Y G protein-coupled nucleotide receptors: from molecular mechanisms and pathophysiology to therapy. Pharmacol Rev. 2006;58:281–341. doi: 10.1124/pr.58.3.3. [DOI] [PMC free article] [PubMed] [Google Scholar]
- 13.Balogh J, Wihlborg AK, Isackson H, et al. Phospholipase C and cAMP-dependent positive inotropic effects of ATP in mouse cardiomyocytes via P2Y11-like receptors. J Mol Cell Cardiol. 2005;39:223–230. doi: 10.1016/j.yjmcc.2005.03.007. [DOI] [PMC free article] [PubMed] [Google Scholar]
- 14.Morris JB, Pham TM, Kenney B, Sheppard KE, Woodcock EA. UTP transactivates epidermal growth factor receptors and promotes cardiomyocyte hypertrophy despite inhibiting transcription of the hypertrophic marker gene, atrial natriuretic peptide. J Biol Chem. 2004;279:8740–8746. doi: 10.1074/jbc.M310012200. [DOI] [PubMed] [Google Scholar]
- 15.Nishida M, Sato Y, Uemura A, et al. P2Y6 receptor-Galpha12/13 signalling in cardiomyocytes triggers pressure overload-induced cardiac fibrosis. EMBO J. 2008;27:3104–3115. doi: 10.1038/emboj.2008.237. [DOI] [PMC free article] [PubMed] [Google Scholar]
- 16.Pham TM, Morris JB, Arthur JF, Post GR, Brown JH, Woodcock EA. UTP but not ATP causes hypertrophic growth in neonatal rat cardiomyocytes. J Mol Cell Cardiol. 2003;35:287–292. doi: 10.1016/s0022-2828(03)00009-9. [DOI] [PubMed] [Google Scholar]
- 17.Wihlborg AK, Balogh J, Wang L, et al. Positive inotropic effects by uridine triphosphate (UTP) and uridine diphosphate (UDP) via P2Y2 and P2Y6 receptors on cardiomyocytes and release of UTP in man during myocardial infarction. Circ Res. 2006;98:970–976. doi: 10.1161/01.RES.0000217402.73402.cd. [DOI] [PMC free article] [PubMed] [Google Scholar]
- 18.Swaney JS, Roth DM, Olson ER, Naugle JE, Meszaros JG, Insel PA. Inhibition of cardiac myofibroblast formation and collagen synthesis by activation and overexpression of adenylyl cyclase. Proc Natl Acad Sci U S A. 2005;102:437–442. doi: 10.1073/pnas.0408704102. [DOI] [PMC free article] [PubMed] [Google Scholar]
- 19.Lugo-Garcia L, Filhol R, Lajoix AD, Gross R, Petit P, Vignon J. Expression of purinergic P2Y receptor subtypes by INS-1 insulinoma beta-cells: a molecular and binding characterization. Eur J Pharmacol. 2007;568:54–60. doi: 10.1016/j.ejphar.2007.04.012. [DOI] [PubMed] [Google Scholar]
- 20.Pfaffl MW. A new mathematical model for relative quantification in real-time RTPCR. Nucleic Acids Res. 2001;29:e45. doi: 10.1093/nar/29.9.e45. [DOI] [PMC free article] [PubMed] [Google Scholar]
- 21.Erlinge D, Yoo H, Edvinsson L, Reis DJ, Wahlestedt C. Mitogenic effects of ATP on vascular smooth muscle cells vs. other growth factors and sympathetic cotransmitters. Am J Physiol. 1993;265:H1089–H1097. doi: 10.1152/ajpheart.1993.265.4.H1089. [DOI] [PubMed] [Google Scholar]
- 22.Takeshita K, Hayashi M, Iino S, et al. Increased expression of plasminogen activator inhibitor-1 in cardiomyocytes contributes to cardiac fibrosis after myocardial infarction. Am J Pathol. 2004;164:449–456. doi: 10.1016/S0002-9440(10)63135-5. [DOI] [PMC free article] [PubMed] [Google Scholar]
- 23.Weinberg EO, Shimpo M, Hurwitz S, Tominaga S, Rouleau JL, Lee RT. Identification of serum soluble ST2 receptor as a novel heart failure biomarker. Circulation. 2003;107:721–726. doi: 10.1161/01.cir.0000047274.66749.fe. [DOI] [PubMed] [Google Scholar]
- 24.Lorenz K, Schmitt JP, Schmitteckert EM, Lohse MJ. A new type of ERK1/2 autophosphorylation causes cardiac hypertrophy. Nat Med. 2009;15:75–83. doi: 10.1038/nm.1893. [DOI] [PubMed] [Google Scholar]
- 25.Cohn JN, Ferrari R, Sharpe N. Cardiac remodeling--concepts and clinical implications: a consensus paper from an international forum on cardiac remodeling. Behalf of an International Forum on Cardiac Remodeling. J Am Coll Cardiol. 2000;35:569–582. doi: 10.1016/s0735-1097(99)00630-0. [DOI] [PubMed] [Google Scholar]
- 26.Regard JB, Sato IT, Coughlin SR. Anatomical profiling of G protein-coupled receptor expression. Cell. 2008;135:561–571. doi: 10.1016/j.cell.2008.08.040. [DOI] [PMC free article] [PubMed] [Google Scholar]
- 27.Talasila A, Germack R, Dickenson JM. Characterization of P2Y receptor subtypes functionally expressed on neonatal rat cardiac myofibroblasts. Br J Pharmacol. 2009;158:339–353. doi: 10.1111/j.1476-5381.2009.00172.x. [DOI] [PMC free article] [PubMed] [Google Scholar]
- 28.Wee S, Peart JN, Headrick JP. P2 purinoceptor-mediated cardioprotection in ischemic-reperfused mouse heart. J Pharmacol Exp Ther. 2007;323:861–867. doi: 10.1124/jpet.107.125815. [DOI] [PubMed] [Google Scholar]
- 29.Yitzhaki S, Shainberg A, Cheporko Y, et al. Uridine-5'-triphosphate (UTP) reduces infarct size and improves rat heart function after myocardial infarct. Biochem Pharmacol. 2006;72:949–955. doi: 10.1016/j.bcp.2006.07.019. [DOI] [PMC free article] [PubMed] [Google Scholar]
- 30.Zheng JS, O'Neill L, Long X, et al. Stimulation of P2Y receptors activates c-fos gene expression and inhibits DNA synthesis in cultured cardiac fibroblasts. Cardiovasc Res. 1998;37:718–728. doi: 10.1016/s0008-6363(97)00245-9. [DOI] [PubMed] [Google Scholar]
- 31.Meszaros JG, Gonzalez AM, Endo-Mochizuki Y, Villegas S, Villarreal F, Brunton LL. Identification of G protein-coupled signaling pathways in cardiac fibroblasts: cross talk between G(q) and G(s) Am J Physiol Cell Physiol. 2000;278:C154–C162. doi: 10.1152/ajpcell.2000.278.1.C154. [DOI] [PubMed] [Google Scholar]
- 32.Kakkar R, Lee RT. Intramyocardial fibroblast myocyte communication. Circ Res. 2010;106:47–57. doi: 10.1161/CIRCRESAHA.109.207456. [DOI] [PMC free article] [PubMed] [Google Scholar]
- 33.Wildman SS, Unwin RJ, King BF. Extended pharmacological profiles of rat P2Y2 and rat P2Y4 receptors and their sensitivity to extracellular H+ and Zn2+ ions. Br J Pharmacol. 2003;140:1177–1186. doi: 10.1038/sj.bjp.0705544. [DOI] [PMC free article] [PubMed] [Google Scholar]
- 34.Bouchie JL, Chen HC, Carney R, Bagot JC, Wilden PA, Feener EP. P2Y receptor regulation of PAI-1 expression in vascular smooth muscle cells. Arterioscler Thromb Vasc Biol. 2000;20:866–873. doi: 10.1161/01.atv.20.3.866. [DOI] [PubMed] [Google Scholar]
- 35.Klawitter S, Hofmann LP, Pfeilschifter J, Huwiler A. Extracellular nucleotides induce migration of renal mesangial cells by upregulating sphingosine kinase-1 expression and activity. Br J Pharmacol. 2007;150:271–280. doi: 10.1038/sj.bjp.0706983. [DOI] [PMC free article] [PubMed] [Google Scholar]
- 36.Solini A, Iacobini C, Ricci C, et al. Purinergic modulation of mesangial extracellular matrix production: role in diabetic and other glomerular diseases. Kidney Int. 2005;67:875–885. doi: 10.1111/j.1523-1755.2005.00152.x. [DOI] [PubMed] [Google Scholar]
- 37.Friedman DJ, Rennke HG, Csizmadia E, Enjyoji K, Robson SC. The vascular ectonucleotidase ENTPD1 is a novel renoprotective factor in diabetic nephropathy. Diabetes. 2007;56:2371–2379. doi: 10.2337/db06-1593. [DOI] [PubMed] [Google Scholar]
- 38.Dranoff JA, Ogawa M, Kruglov EA, et al. Expression of P2Y nucleotide receptors and ectonucleotidases in quiescent and activated rat hepatic stellate cells. Am J Physiol Gastrointest Liver Physiol. 2004;287:G417–G424. doi: 10.1152/ajpgi.00294.2003. [DOI] [PMC free article] [PubMed] [Google Scholar]
- 39.Gerasimovskaya EV, Ahmad S, White CW, Jones PL, Carpenter TC, Stenmark KR. Extracellular ATP is an autocrine/paracrine regulator of hypoxia-induced adventitial fibroblast growth. Signaling through extracellular signal-regulated kinase-1/2 and the Egr-1 transcription factor. J Biol Chem. 2002;277:44638–44650. doi: 10.1074/jbc.M203012200. [DOI] [PubMed] [Google Scholar]
- 40.Loskutoff DJ, Edgington TS. An inhibitor of plasminogen activator in rabbit endothelial cells. J Biol Chem. 1981;256:4142–4145. [PubMed] [Google Scholar]
- 41.Eddy AA, Fogo AB. Plasminogen activator inhibitor-1 in chronic kidney disease: evidence and mechanisms of action. J Am Soc Nephrol. 2006;17:2999–3012. doi: 10.1681/ASN.2006050503. [DOI] [PubMed] [Google Scholar]
- 42.Fogo AB. Renal fibrosis: not just PAI-1 in the sky. J Clin Invest. 2003;112:326–328. doi: 10.1172/JCI19375. [DOI] [PMC free article] [PubMed] [Google Scholar]
- 43.Rerolle JP, Hertig A, Nguyen G, Sraer JD, Rondeau EP. Plasminogen activator inhibitor type 1 is a potential target in renal fibrogenesis. Kidney Int. 2000;58:1841–1850. doi: 10.1111/j.1523-1755.2000.00355.x. [DOI] [PubMed] [Google Scholar]
- 44.Arteel GE. New role of plasminogen activator inhibitor-1 in alcohol-induced liver injury. J Gastroenterol Hepatol. 2008;23 Suppl 1:S54–S59. doi: 10.1111/j.1440-1746.2007.05285.x. [DOI] [PMC free article] [PubMed] [Google Scholar]
- 45.Nicholas SB, Aguiniga E, Ren Y, et al. Plasminogen activator inhibitor-1 deficiency retards diabetic nephropathy. Kidney Int. 2005;67:1297–1307. doi: 10.1111/j.1523-1755.2005.00207.x. [DOI] [PubMed] [Google Scholar]
- 46.Sobel BE, Lee YH, Pratley RE, Schneider DJ. Increased plasminogen activator inhibitor type-1 (PAI-1) in the heart as a function of age. Life Sci. 2006;79:1600–1605. doi: 10.1016/j.lfs.2006.05.011. [DOI] [PubMed] [Google Scholar]
- 47.Sobel BE, Schneider DJ, Lee YH, Pratley RE. Insulin resistance increases PAI-1 in the heart. Biochem Biophys Res Commun. 2006;346:102–107. doi: 10.1016/j.bbrc.2006.05.078. [DOI] [PubMed] [Google Scholar]
- 48.Collet JP, Montalescot G, Vicaut E, et al. Acute release of plasminogen activator inhibitor-1 in ST-segment elevation myocardial infarction predicts mortality. Circulation. 2003;108:391–394. doi: 10.1161/01.CIR.0000083471.33820.3C. [DOI] [PubMed] [Google Scholar]
- 49.Wiman B, Andersson T, Hallqvist J, Reuterwall C, Ahlbom A, deFaire U. Plasma levels of tissue plasminogen activator/plasminogen activator inhibitor-1 complex and von Willebrand factor are significant risk markers for recurrent myocardial infarction in the Stockholm Heart Epidemiology Program (SHEEP) study. Arterioscler Thromb Vasc Biol. 2000;20:2019–2023. doi: 10.1161/01.atv.20.8.2019. [DOI] [PubMed] [Google Scholar]


