Abstract
This report demonstrates the application of a capillary LC-LTQ-orbitrap system to provide automated middle-down analysis of proteolytic peptides in the mass range 3000 to 10,000 Da. The novel workflow combines an underutilized method in the orbitrap—high resolution, mass-accurate product ion measurements—with software tailored to search such data (ProSightPC 2.0) and an Asp-selective chemical cleavage approach that generates peptides across an extended mass range. The strategy using high resolution mass measurements on both precursor and product ions is analogous to that widely used on FT-ICR analyzers. The approach is demonstrated in an analysis of the highly basic ribosomal proteome isolated from human MCF7 cancer cells.
Introduction
Despite tremendous advances based on Fourier transform ion cyclotron resonance mass analyzers, there are still technical barriers to the implementation of top-down tandem mass spectrometry as the method of choice for automated analysis of complex protein mixtures. In addition to the challenge to continue to extend the mass range to accommodate protein requirements (1,2), the resolution and mass accuracy required for deconvolution of very high charge state species are achieved on many Fourier transform ion cyclotron resonance analyzers at ion accumulation times incompatible with interfaced chromatographic flow rates. In the meantime, real advantages have been recognized for the analysis of long polypeptides, so called middle-down analysis, in the mass range 3000 to 20,000 Daltons. Such proteolytic products are reported to provide valuable information about the cooperative occurrence of post-translational modifications (1, 3-5). Mid-range peptides are reported to be fractionated with improved resolution by HPLC (6). And longer peptides carry higher numbers of charges when electrosprayed, which enhance both CID and ETD (7-9).
These polypeptides are usually produced from protein mixtures by enzymatic or chemical methods that cleave with selectivity for a single residue (3, 6, 7, 10, 11). One of these, microwave-accelerated acid cleavage, has been consistently shown to produce polypeptides by selective hydrolysis on one or both sides of Asp residues. This method has the advantage that it does not discriminate between derivatized and underivatized Lys and Arg residues, however its major advantage is the speed with which it provides proteolysis in a variety of solvents (7, 8, 12-14).
Without requiring customized modifications, the orbitrap mass analyzer has been shown to provide resolution sufficient to decharge mid-sized polypeptide precursors in a time frame compatible with capillary HPLC peak widths. Additionally, the orbitrap is able to analyze the multiply charged fragments resulting from collisional or electron transfer activation of highly charged precursors with high resolution (15,000 and up) at a duty cycle compatible with chromatography. The orbitrap used in this work was coupled to a linear ion trap, whose trapping capability maintains sensitivity while providing robust multi-collision activation. The longer duty cycle that results from measuring both precursor and product ions with high resolution means that fewer peptides can be analyzed in a given elution time, and recommends the use of mixtures of fewer peptides such as those provided by the middle-down strategy.
The computational requirements include the capability to extract and deconvolute charge states from isotope patterns of precursor and product ions and to search the resulting fragmentation patterns against predictions from databases of protein sequences. In the present work ProSightPC 2.0 was used, which also provides the option to specify acid cleavage at Asp.
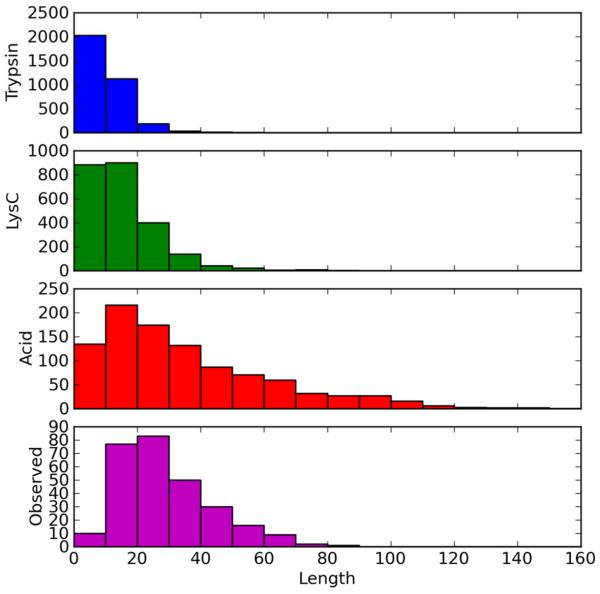
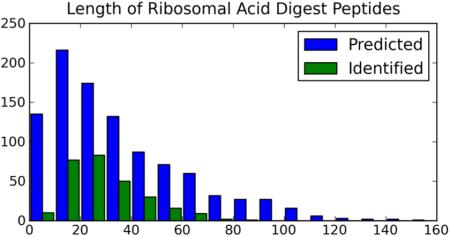
The ribosome is an important multiprotein complex, currently under intense scientific scrutiny (16). Pulse chase experiments have shown that the half life of the eukaryotic ribosome exceeds that of the cell (17), and modest protein modifications have been hypothesized to occur in response to changes in cellular health and drug treatment. In the human ribosomal database, Asp residues account for 3.81% of total residues. By comparison, Arg, Lys, and Arg-plus-Lys account for 9.30, 12.36, and 21.65% of total residues, respectively. Figure 1a-c shows the distribution of peptides of various residue lengths predicted for molecular weights greater than 500 Da with at most 1 missed cleavage, with respect to (a) tryptic digestion (3397 total), (b) Lys-C digestion (2406 total) and (c) acid digestion (991 total). We use an in silico Asp-C cleavage for this Figure, instead of the total acid digest, to eliminate double counting of sequences that differ only in the presence of an Asp residue. Observed acid cleaved peptides have also been filtered throughout to eliminate peptides differing only in terminal Asp residues. In the small ribosomal proteome, comprising mostly basic proteins, Asp-selective cleavage is expected to provide a peptide set of limited size with molecular masses (lengths) across the middle-mass range. The present evaluation of a novel middle-down workflow has been carried out on the ribosomal proteome with the expectation that it will be applied in future studies of differential modification in that system.
Figure 1.
Distribution of peptide products by length, predicted from the 84 proteins in the human ribosome cleaved by (a) trypsin; (b) Lys-C and (c) Asp-C acid cleavage. (d) Distribution of Asp-C peptides identified experimentally in an acid cleavage digestion.
Experimental Section
Cell Culture and Ribosome Isolation
MCF7 breast cancer cells were grown to confluence in 150 cm2 flasks (Corning, New York) in Improved Minimal Essential Media (IMEM) with L-glutamine supplemented with 1% penicillin-streptomycin antibiotic solution and 10% heat inactivated fetal bovine serum. Cells were maintained at a temperature of 37°C in a water jacketed CO2 incubator with 5% carbon dioxide until confluence.
Ribosomes were isolated from confluent cells. All procedures were carried out on ice unless otherwise indicated. Homogenization of the cell pellet with a Kinematica mechanical homogenizer (Littau, Lucerne; Switzerland) in two volumes homogenization buffer (50mM Tris-HCL, pH 7.5; 5mM MgCl2, 25mM KCl, 200mM sucrose) was followed by centrifugation at 10,000g for 10 minutes at 4°C in the benchtop centrifuge. The supernatant was collected and the remaining pellet rehomogenized on ice and centrifuged. The supernatant was layered 1:1 over a sucrose cushion buffer (50mM TrisHCl, pH 7.5; 5mM MgCl2, 25mM KCl, 2M sucrose) and the ribosomal pellet isolated by centrifugation (Optima LE-80K preparative ultracentrifuge, Beckman Coulter, Fullerton, CA) at 260,000g at 4°C for 2 hours in a swinging bucket rotor (SW60Ti).
Protein Extraction
Ribosomal proteins were extracted from a 500µL suspension of ribosomes following a variation of the method described by Hardy et al (18). In brief, one volume of the ribosomal suspension was mixed with 0.25 volumes of 1M Mg(OAc)2 followed by the addition of 1 volume glacial acetic acid. Each solution was incubated for 1 hour and the precipitated rRNA pelleted by centrifugation at 10,000 rpm at 4°C for 10 min in a bench top centrifuge. The supernatant was then collected. Molecular weight cutoff filters (Microcon Ultracel YM-3, Millipore, Billerica, MA) were used to concentrate the samples and reduce the acid content. After desalting and concentrating the samples, the protein concentrations were determined using the BioRad RC/DC protein assay (Bio-Rad, Hercules, CA). Dilutions of 0.1mg/mL concentrations were prepared for each sample. To each of these samples acetic acid and dithiothreitol were added to achieve 12.5% acetic acid and 5mM dithiothreitol.
Microwave Accelerated Acid Digestion
The method optimized and reported by Swatkoski et al (7) for digestion of ribosomal proteins was used. Fifty microliters of each solution was irradiated at 300W for 20 minutes in SPS mode in a Discover Benchmate laboratory grade microwave (CEM, Matthews, NC) at 140°C. Samples were collected and injected directly into the nanoLC through an autosampler.
LC-MS/MS
Seven injections were made into a Shimadzu Prominence NanoLC (Shimadzu, Columbia, MD) interfaced to the LTQ Orbitrap mass spectrometer (ThermoFisher, San Jose CA) via an Advance CaptiveSpray Plug-and-Play source (Michrom Bioresources, Auburn CA). The samples were loaded onto a 0.3 × 5 mm peptrap 300 C18 precolumn (Dionex, Sunnyvale CA) in 5% Solvent A (97.5% water/2.5% ACN/0.1% formic acid) and desalted for 15 min. Peptides were eluted into a 0.1 mm × 150 mm C18 analytical column (Grace Vydac, Deerfield IL) and separated with a linear gradient of 5-15 % solvent B (97.5% ACN/2'5% water/0.1% formic acid) in 5 min, then to 69% B in 115 min. Flow rate was 500 nL/min. Survey scans were acquired in the Orbitrap with resolving power of 30,000 at m/z 400 and an automated gain control (AGC) target level of 5 × 10⁵. The three most abundant ions were selected for fragmentation using collisionally induced dissociation (CID) in the linear ion trap. Precursor ions were isolated using a 3 Da window, and fragmented with He gas for 30 milliseconds with a normalized collision energy of 35. The product ion AGC target level was set to 5 × 10⁴ and fragment ion scans were acquired in the Orbitrap with resolving power of 15,000 at m/z 400. Dynamic exclusion parameters were set to exclude ions previously selected for fragmentation for 3 min. All data was acquired in reduced profile mode to accommodate further downstream processing.
Data Processing
Following spectral acquisition .RAW files were processed using ProSightPC 2.0 provided by Professor Neil Kelleher, University of Illinois (19). (This software is now available in a commercial configuration from ThermoFisher.) Each .RAW file was processed in High Throughput mode. Spectra were decharged with cRAWler using the THRASH algorithm. A FASTA format protein sequence database of 79 human ribosomal proteins was extracted from the Ribosomal Protein Gene Database ((20) and configured for acid-cleavage analysis with ProSightPC 2.0. Spectra were searched in Absolute Mass mode using a 2.5 Da precursor window based on the peptide monoisotopic mass. An additional search, using a loose precursor window of 250 Da, was carried out to search for evidence of post-translationally modified peptide isoforms. Significant identifications, when sufficient b and/or y ions were matched despite discrepancies between the predicted precursor mass and the observed mass were manually checked using ProSightPC's Sequence Gazer tool. The sequence positions of the b and/or y ions matched help to localize the mass-shift from putative PTM's and single amino acid substitutions (22). Mass tolerance for fragment ions was set at 15ppm. False discovery rates (FDR) were calculated using a randomly shuffled version of the ribosomal protein sequence database previously described.
Mascot (Matrix Science, London UK) searches were also used to analyze the data. Searches were carried out specifying “no enzyme.” Up to 9 missed cleavage swere allowed, with precursor tolerance of 10 ppm and product ion tolerance of 0.05 Da. ESI-TRAP was selected for fragment specificity. Variable modifications were selected to include N-terminal acetylation, N,Q deamination, M oxidation and S,T,Y phosphorylation.
Results and Discussion
Peptide identifications were accepted at E-values of 1.0×10⁻³ or less, corresponding to a False Discovery Rate of <1%. Three hundred sixty-six distinct peptide sequences were identified using ProSightPC 2.0, including a number of peptide sequences differing only in the addition or removal of N- or C-terminal Asp. Two hundred seventy-six unique peptides remain after accounting for this redundancy. Forty-four percent of the peptides had masses greater than 3kDa. The heaviest 10 are presented in Table 1, along with charge states, Δm values, adjacent residues and E-Values provided by ProSightPC. The distribution of Asp-C peptide products identified with various residue numbers is shown in Figure 1d, where it can be compared with the distribution predicted in Figure 1c. Twenty-eight percent of the predicted peptides were identified experimentally. Table 1 and Figure 1d indicate that microwave accelerated acid cleavage produces peptides from ribosomal proteins that span a range of lengths, including significant representation in the range 3000 to 10,000 Da. A complete list of the peptides identified by ProSightPC 2.0 is presented in the Supplementary Information Table 1, along with Δm values, E values, adjacent residues and protein accession numbers. It should be noted that the full range of charge states could not be explored at the resolution used in this study. We are working to extend the range of middle-down analysis on the LTQ-orbitrap at higher resolution.
Table 1.
| Left AA |
Sequence | Right AA |
E-value | Z | SwissProt Accession |
Protein | Observed Mass |
Theoretical Mass |
Mass Difference (Da) |
|---|---|---|---|---|---|---|---|---|---|
| D |
VPRKLLSHGK KPFSQHVRKL RASITPGTIL IILTGRHRGK RVVFLKQLAS GLLLVTGPLV LNRVPLRRTH QKFVIATSTK ID |
I | 6.93E-08 | 12 | Q02878 | L6 | 9173.55 | 9174.51 | −1.06 |
| D |
KAAAAAAALQ AKSDEKAAVA GKKPVVGKKG KKAAVGVKKQ KKPLVGKKAA ATKKPAPEKK PAEKKPTTEE KKPAA |
- | 5.17E-12 | 10 | P36578 | L4 | 7577.47 | 7576.52 | 0.95 |
| D |
SSAEELKLAT QLTGPVMPVR NVYKKEKARV ITEEEKNFKA FASLRMARAN ARLFGIRAKR AKEAAEQ |
D | 4.34E-15 | 8 | P26373 | L13 | 7545.04 | 7545.11 | −0.07 |
| D |
IMAKRNQKPE VRKAQREQAI RAAKEAKKAK QASKKTAMAA AKAPTKAAPK QKIVKPVKVS APRVGGKR |
- | 7.28E-11 | 12 | P83731 | L24 | 7354.32 | 7354.34 | −0.02 |
| D |
KATYDKLCKE VPNYKLITPA VVSERLKIRG SLARAALQEL LSKGLIKLVS KHRAQVIYTR NTKGG |
D | 3.72E-09 | 9 | P62851 | S25 | 7234.15 | 7233.15 | 1.00 |
| D |
PSKGPLQSVQ VFGRKKTATA VAHCKRGNGL IKVNGRPLEM IEPRTLQYKL LEPVLLLGKE RFAGV |
D | 5.35E-16 | 6 | P62249 | S16 | 7137.10 | 7136.03 | 1.07 |
| D |
AANFEQFLQE RIKVNGKAGN LGGGVVTIER SKSKITVTSE VPFSKRYLKY LTKKYLKKNN LR |
D | 2.04E-05 | 7 | P35268 | L22 | 7058.00 | 7056.95 | 1.05 |
| D |
MIILPEMVGS MVGVYNGKTF NQVEIKPEMI GHYLGEFSIT YKPVKHGRPG IGATHSSRFI PLK |
- | 2.68E-14 | 9 | P62841 | S15 | 6998.72 | 6998.66 | −0.06 |
| D |
IKGMGTVQKG MPHKCYHGKT GRVYNVTQHA VGIVVNKQVK GKILAKRINV RIEHIKHSKS R |
D | 8.65E-12 | 6 | P46778 | L21 | 6855.84 | 6854.84 | 1.00 |
| D |
DEVQVVRGHY KGQQIGKVVQ VYRKKYVIYI ERVQREKANG TTVHVGIHPS KVVITRLKL |
D | 4.06E-06 | 8 | P61254 | L26 | 6840.81 | 6838.88 | 1.93 |
Microwave–accelerated acid cleavage exhibits kinetic selectivity (not binding specificity) for cleavage at aspartic acid (7 and references therein). In a previous study of yeast ribosomal proteins we reported that acid cleavage occurred with fidelity at Asp at 83% of the termini in peptides identified. Mascot was used with “no enzyme” specified to make this analysis. The present data set was also searched with Mascot, specifying “no enzyme.” In this search 188 peptides were identified, including 168 already identified in the ProSight search. Among the 376 peptide termini analyzed, 34 comprised protein termini and 19 (5%) carried termini produced by cleavage at residues other than Asp. The majority of these occurred next to proline (4), asparagine (5) and glutamate (6).
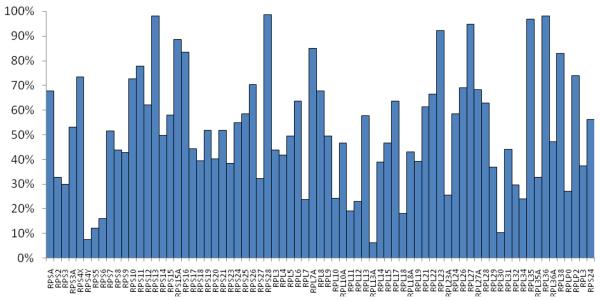
The 366 peptides identified represented 70 of the 79 human ribosomal proteins present in the ribosomal database with at least one significant peptide identification, and 65 of the 79 ribosomal proteins were identified with at least two distinct significant peptide identifications. The average sequence coverage observed for these 70 proteins was 46.2 %. Figure 2 illustrates the coverage accumulated from 7 injections, which ranges between 98.6% and 6.4% for individual proteins.
Figure 2.
Sequence coverage of seventy proteins by the peptide products of acid digestion combined from seven LC-MS/MS analyses.
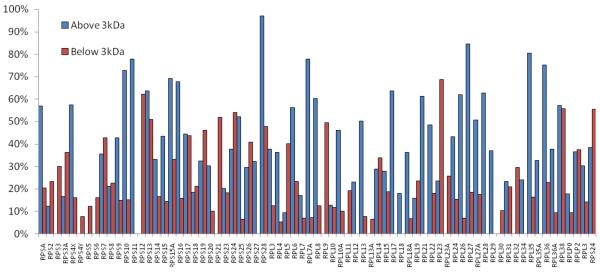
The present analysis allows us to test the hypothesis that larger acid digestion products provide an increase in sequence coverage. Anecdotally, ribosomal protein L21 is represented by just two unique peptides. However, as Figure 2 indicates, those peptides account for 61% of the total sequence. Figure 3 provides a comparison of the sequence coverage for 70 proteins provided by the peptides with molecular masses above 3000 Da identified using ProSight, and coverage provided by peptides identified with molecular masses below 3000 Da. The set of peptides with masses below 3000 Da comprises 205 peptides, whereas the set with masses above that threshold contains 161. The more limited set of longer peptides provides higher coverage, 36 % on average, while the average coverage provided by the more abundant shorter peptides is 21 %.
Figure 3.
Sequence coverage of seventy proteins by subsets of the peptides in Supplementary Table 1. (blue) peptides >3000 Da; (red) peptides <3000 Da.
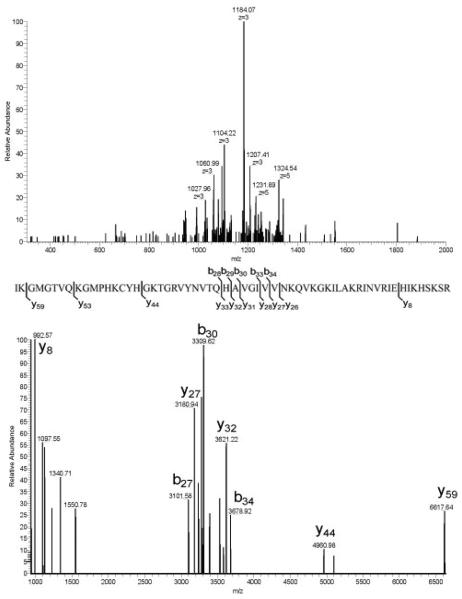
Another positive by-product of acid digestion is the presence of multiple basic residues in the interior of many of the polypeptide products. Enzymatic methods that cleave at basic sites create peptides with sequences that localize positive charges at the termini and must rely on proton transfer for backbone fragmentation (21). Peptides produced from acid digestion, on the other hand, usually contain multiple internal basic sites and readily produce multiply charged precursor and fragment ions. Figure 4 illustrates the formation of highly charged fragment ions by collisionally induced dissociation of a polypeptide containing 14 R and K residues. Although no long series of sequence ions is produced, the fragment ions observed, used in conjunction with accurate mass measurements of precursor and product ion masses, are sufficient to allow the search program to identify the polypeptide with high reliability (Table 1).
Figure 4.
Product ion spectra of a peptide with a calculated monoisotopic mass of 6854.84 (See Table 1): high resolution product ion scan (top); sequence and fragmentation assigned by ProSightPC 2.0 (middle); decharged product ion scan (bottom).
The ten heaviest peptides identified are listed in Table 1, along with E values that indicate the reliability of the middle-down identifications. The largest polypeptide in the table has a neutral mass of 9174.51 Da and carries 12 charges on ions at m/z 765.01. This charge state was determined readily at the resolution used.
Evidence for a number of modified peptides, to be reported in a subsequent manuscript, was collected in the course of this study using the loosely constrained precursor search (22). One example, curated and localized manually using ProSight's Sequence Gazer tool, involves a +28.01 Da mass-shift in an acid digest product of ribosomal protein L10. Initially identified with E-value 1.92E-11 based on 5 b- and y-ions, its E-value improved to 7.89E-22, from 9 b- and y-ions, after application of the +28 Da mass-shift at an appropriate internal Arg residue.
Conclusions
The novel middle-down workflow presented here demonstrates a rapid automated method for analysis of a small protein mixture, allowing high confidence identifications of nearly 30% of the expected peptidome, recognition of protein modifications and an average of 46% sequence coverage of 70 of 79 possible parent proteins. We plan to introduce modifications to improve the analysis further, notably the use of still higher resolution on the LTQ-orbitrap instrument to permit deconvolution and analysis of peptides with higher charge states.
Synopsis.
This report demonstrates the use of a capillary LC- LTQ-orbitrap system to provide middle-down analysis of proteolytic peptides in the mass range 3000 to 10,000 Da with resolution mass measurements of both precursor and product ions on the chromatographic time scale. Spectra were decharged and searched by ProSightPC against a database of human ribosomal protein sequences. Proteolysis was performed with microwave-accelerated acid cleavage. Twenty-eight percent of the predicted peptidome was identified experimentally using this rapid automated workflow,
Supplementary Material
Acknowledgments
The research was supported by grants from the NIH: CTPI grant NCI126189 to NE, and RR 023383 and GM021248 to CF. Mass spectra were measured in the CLFS Proteomics Facility at the University of Maryland. We thank Neil Kelleher and Paul Thomas, University of Illinois, Urbana-Champagne, for providing a beta version of ProSightPC 2.0 and for advice on its use.
References
- 1.Lee JE, Kellie JF, Tran JC, Tipton JD, Catherman AD, Thomas HM, Ahlf DR, Durbin KR, Vellaichamy A, Ntai I, Marshall AG, Kelleher NL. J. Amer. Soc. Mass Spectrom. 2009;20:2183–2191. doi: 10.1016/j.jasms.2009.08.001. [DOI] [PMC free article] [PubMed] [Google Scholar]
- 2.Han X, Jin M, Breuker K, McLafferty FW. Science. 2006;314:109–112. doi: 10.1126/science.1128868. [DOI] [PubMed] [Google Scholar]
- 3.Taverna SD, Ueberheide BM, Liu Y, Tackett AJ, Diaz RL, Shabanowitz J, Chait BT, Hunt DF, Allis CD. Proc. Nat. Acad. Sci. 2007;104:2086–2091. doi: 10.1073/pnas.0610993104. [DOI] [PMC free article] [PubMed] [Google Scholar]
- 4.Garcia BA, Pesavento JJ, Mizzen CA, Kelleher NL. Nat. Methods. 2007;4:486–489. doi: 10.1038/nmeth1052. [DOI] [PubMed] [Google Scholar]
- 5.Bondarenko PV, Second TP, Zabrouskov V, Makarov AA, Zhang Z. J. Amer. Soc. Mass Spectrom. 2009;20:1415–1424. doi: 10.1016/j.jasms.2009.03.020. [DOI] [PubMed] [Google Scholar]
- 6.Wu S-L, Huhmer AF, Hao Z, Karger BL. J. Prot. Res. 2007;6:4230–4244. doi: 10.1021/pr070313u. [DOI] [PMC free article] [PubMed] [Google Scholar]
- 7.Swatkoski S, Gutierrez P, Wynne C, Petrov A, Dinman JD, Edwards N, Fenselau C. J. Prot. Res. 2008;7:579–586. doi: 10.1021/pr070502c. [DOI] [PubMed] [Google Scholar]
- 8.Hauser NJ, Han H, McLuckey SA, Basile F. J. Prot. Res. 2008;7:1867–1872. doi: 10.1021/pr700671z. [DOI] [PMC free article] [PubMed] [Google Scholar]
- 9.Chi A, Bai DL, Geer LY, Shabanowitz J, Hunt DF. Intern. J. Mass Spectrom. 2007;259:197–203. doi: 10.1016/j.ijms.2006.09.030. [DOI] [PMC free article] [PubMed] [Google Scholar]
- 10.Vestling M, Fenselau C. Anal. Chem. 1994;66:471–477. [Google Scholar]
- 11.Hohmann L, Sherwood C, Eastham A, Peterson A, Eng JK, Eddes JS, Shtenberg D, Martin DB. J. Prot. Res. 2009;8:1415–1422. doi: 10.1021/pr800774h. [DOI] [PMC free article] [PubMed] [Google Scholar]
- 12.Swatkoski S, Russell SC, Edwards N, Fenselau C. Anal. Chem. 2005;78:181–188. doi: 10.1021/ac051521d. [DOI] [PubMed] [Google Scholar]
- 13.Li J, Shefcheck K, Callahan J, Fenselau C. Intern. J. Mass Spectrom. 2008;278:109–113. doi: 10.1016/j.ijms.2008.04.030. [DOI] [PMC free article] [PubMed] [Google Scholar]
- 14.Zhong H, Marcus SL, Li L. J. Amer. Soc. Mass Spectrom. 2004;16:471–481. doi: 10.1016/j.jasms.2004.12.017. [DOI] [PubMed] [Google Scholar]
- 15.Wynne C, Fenselau C, Demirev PA, Edwards N. Anal. Chem. 2009;81:9633–9642. doi: 10.1021/ac9016677. [DOI] [PubMed] [Google Scholar]
- 16.The Nobel Prize in Chemistry 2009 at www.Nobelprize.org
- 17.Dinman JD. University of Maryland; 2008. private communication. [Google Scholar]
- 18.Hardy SJS, Kurland CG, Voynow P, Mora G. Biochemistry. 1969;8:2897–2905. doi: 10.1021/bi00835a031. [DOI] [PubMed] [Google Scholar]
- 19.Boyne MT, Garcia BA, Li M, Zamdborg L, Wenger CD, Babai S, Kelleher NL. J. Prot. Res. 2008;8:374–379. doi: 10.1021/pr800635m. [DOI] [PMC free article] [PubMed] [Google Scholar]
- 20.Nakao A, Yoshihama M, Kenmochi N. Nucleic Acids Res. 2004;32:168–170. doi: 10.1093/nar/gkh004. [DOI] [PMC free article] [PubMed] [Google Scholar]
- 21.Wysocki HV, Tsaprailis G, Smith LL, Breci LA. J. Mass Spectrom. 2000;35:1399–1406. doi: 10.1002/1096-9888(200012)35:12<1399::AID-JMS86>3.0.CO;2-R. [DOI] [PubMed] [Google Scholar]
- 22.Wynne C, Fenselau C. Edwards, Nathan. Proteomics. 2010:10. doi: 10.1002/pmic.201000172. in press. [DOI] [PubMed] [Google Scholar]
Associated Data
This section collects any data citations, data availability statements, or supplementary materials included in this article.


