

Abstract
At least six families of mammalian acid lipases (E.C. 3.1.1.-) catalyse the hydrolysis of triglycerides in the body, designated as LIPA (lysosomal), LIPF (gastric), LIPJ (testis) and LIPK, LIPM and LIPN (epidermal), which belong to the AB hydrolase superfamily. In this study, in silico methods were used to predict the amino acid sequences, secondary and tertiary structures, and gene locations for acid lipase genes and encoded proteins using data from several mammalian genome projects. Mammalian acid lipase genes were located within a gene cluster for each of the 8 mammalian genomes examined, including human (Homo sapiens), chimpanzee (Pons troglodytes), rhesus monkey (Macacca mulatta), mouse (Mus musculus), rat (Rattus norvegicus), cow (Bos taurus), horse (Equus caballus) and dog (Canis familaris), with each containing 9 coding exons. Human and mouse acid lipases shared 44-87% sequence identity and exhibited sequence alignments and identities for key amino acid residues and conservation of predicted secondary and tertiary structures with those previously reported for human gastric lipase (LIPF) (Roussel et al., 1999). Evidence for a new family of acid lipase genes is reported for mouse and rat genomes, designated as Lipo. Mouse acid lipase genes are subject to differential mRNA tissue expression, with Lipa showing wide tissue expression, while others have a more restricted tissue expression in the digestive tract (Lipf), salivary gland (Lipo) and epidermal tissues (Lipk, Lipm and Lipn). Phylogenetic analyses of the mammalian acid lipase gene families suggested that these genes are products of gene duplication events prior to eutherian mammalian evolution and derived from an ancestral vertebrate LIPA gene, which is present in the frog, Xenopus tropicalis.
Keywords: Mammals, amino acid sequence, acid lipases, evolution, gene duplication
Introduction
At least six mammalian acid lipase genes have been reported, including LIPA, encoding lysosomal acid lipase/cholesteryl ester hydrolase (E.C.3.1.1.13) (Anderson & Sando, 1991; Anderson et al., 1994; Ameis et al, 1994); LIPF, encoding a gastric lipase (E.C.3.1.1.3) (Bodmer et al., 1987; Lohse et al., 1997) ; LIPJ, expressed in testis (Thierry-Mieg & Theirry-Mieg, 2006) and three other genes (LIPK, LIPM and LIPN), which are expressed in epidermal cells of the body (Toulza et al, 2007) and form part of an acid-lipase gene complex on human chromosome 10 (Deloukas et al., 2004). Acid lipases have the capability to withstand acid conditions and lack any significant homology (<20%) with previously described neutral lipases (Bodmer et al., 1987), including endothelial lipase (LIPE) (Hirata et al., 1999; Jaye et al., 1999), hepatic lipase (LIPC) (Martin et al., 1998), lipoprotein lipase (LIPL) (Wion et al., 1987) and pancreatic lipase (LIPP) (Lowe et al., 1989), which perform specialized roles in lipid metabolism in various tissues and cells of the body.
LIPA catalyses the deacylation of triacylglycerols and cholesteryl esters of lysosomal low density lipoproteins (LDLs), an essential intracellular lipid catabolic process (Goldstein et al., 1975; Wang et al., 2008). Two major genetic diseases, a severe infantile-onset Wolman disease (Patrick & Lake, 1969; Hoeg et al., 1984) and a milder late-onset cholesteryl ester storage disease (CESD) (Assmann et al.,, 1973), are caused by mutations of the LIPA gene. LIPF is involved with the metabolism of dietary triglycerides under acidic conditions, being synthesized by gastric chief cells in the fundic mucosa of the stomach and responsible for 30% of triglyceride digestion in humans (Bodmer et al., 1987). Structures for other acid lipase genes have been determined, including LIPJ, LIPK, LIPM and LIPN, and derived from whole genome sequences for human chromosome 10 (Deloukas et al., 2004; Toulza et al., 2007) and mouse chromosome 19 (The MGC Project Team, 2004; Carninci et al., 2005), which contain acid lipase gene clusters in each case. Human LIPK, LIPM and LIPN genes are specifically expressed in epidermal cells and may play a role in differentiated keratinocyte cells in the body (Toulza et al., 2007). Mammalian acid lipase genes usually contain 9 coding exons of DNA encoding enzyme sequences which undergo exon shuffling generating several acid lipase isoproteins (Thierry-Mieg and Thierry-Mieg, 2006). Predictive three-dimensional structural analyses of human LIPA have been undertaken using the human gastric lipase as a model, and key residues and sequences have been identified (Roussel et al., 1999).
This paper reports the predicted gene structures and amino acid sequences for several mammalian acid lipase genes and proteins, including human (Homo sapiens), chimpanzee (Pons troglodytes), rhesus monkey (Macacca mulatta), mouse (Mus musculus), rat (Rattus norvegicus), cow (Bos taurus), horse (Equus caballus) and dog (Canis familaris). Predicted secondary and tertiary structures for mammalian acid lipases are also described, as well as the structural, phylogenetic and evolutionary relationships of these genes and enzymes with other mammalian lipase gene families. In addition, evidence for a new family of acid lipase genes is reported for mouse and rat genomes, designated as Lipo.
Materials and Methods
In silico mammalian acid lipase gene and protein identification
BLAST (Basic Local Alignment Search Tool) studies were undertaken using web tools from the National Center for Biotechnology Information (NCBI) (http://blast.ncbi.nlm.nih.gov/Blast.cgi) (Altschul et al, 1997). Protein BLAST analyses used mammalian acid lipase amino acid sequences previously described (Table 1). Non-redundant protein sequence databases for several mammalian and vertebrate genomes were examined using the blastp algorithm, including human (Homo sapiens) (International Human Genome Sequencing Consortium, 2001); chimpanzee (Pan troglodytes) (Chimpanzee Sequencing & Analysis Consortium, 2005); orangutan (Pongo abelii) (Orangutan Genome Project, 2007); rhesus monkey (Mucaca mulatta) (Gibbs et al., 2007), horse (Equus caballus) (Horse Genome Project, 2008), cow (Bos Taurus) (Bovine Genome Project, 2008); mouse (Mus musculus) (Mouse Genome Sequencing Consortium, 2002); rat (Rattus norvegicus) (Rat Genome Sequencing Consortium, 2004); guinea pig (Cavia porcellus) (MGC Project Team, 2004); (dog (Canis familiaris) Dog Genome Project, 2005); and frog (Xenopus tropicalis) (Xenopus tropicalis Genome Project, 2005). This procedure produced multiple BLAST ‘hits’ for each of the protein databases which were individually examined and retained in FASTA format, and a record kept of the sequences for predicted mRNAs and encoded acid lipase-like proteins . These records were derived from annotated genomic sequences using the gene prediction method: GNOMON and predicted sequences with high similarity scores generated.
Table 1. Mammalian acid lipase (LIPA, LIPF, LIPJ, LIPK, LIPM, LIPN and LIPO) and frog (Xenopus tropicalis) LIPA genes and proteins.
| Acid Lipase Gene (Expression)4 Human Homo sapiens |
Chromosome Coordinates Chromosome 10 Gene order:J-F-K-N-M-A |
Gene Size bps |
Coding Exons Strand |
Subunit MW |
Amino Acids |
pI | GenBank ID |
Vega Gene ID | Ensembl Protein Prediction |
UNIPROT ID |
Ref Seq ID 1NCBI Reference 2NCBI Predicted 3BLAT Predicted |
Other Name Other ID |
|---|---|---|---|---|---|---|---|---|---|---|---|---|
| LIPA (4.9) | 90,964,568-90,997,385 | 32,818 | 9 −ve | 45,419 | 399 | 6.4 | BC012287 | OTTHUMG00000018716 | ENST00000371829 | P38571 | NM_001127605 | LICH |
| LIPF (2.5) | 90,424,214-90,438,571 | 14,357 | 9 +ve | 45,238 | 398 | 6.8 | AK208334 | OTTHUMG00000018695 | ENST00000238983 | P07098 | NM_004190 | |
| LIPJ (0.3) | 90,346,519-90,366,732 | 20,213 | 9 +ve | 42,388 | 366 | 6.1 | BC031219 | OTTHUMG00000018691 | ENST00000371939 | Q5W064 | NM_001010939 | |
| LIPK (0.05) | 90,474,281-90,502,490 | 28,210 | 9 +ve | 45,563 | 399 | 8.4 | EF426482 | OTTHUMG00000018693 | ENST00000404190 | Q5VXJ0 | NM_001080518 | |
| LIPM (0.04) | 90,552,634-90,570,235 | 17,602 | 9 +ve | 48,233 | 423 | 6.6 | EF426484 | OTTHUMG00000018698 | ENST00000404743 | Q5VYY2 | NM_001128215 | |
| LIPN (0.05) | 90,511,143-90,527,979 | 16,834 | 9 +ve | 45,534 | 399 | 6.4 | EF426483 | OTTHUMG00000018694 | ENST00000404459 | Q5VXI9 | NM_001102469 | |
|
Mouse
Mus musculus |
Chromosome 19
Gene order:o4-3-2-1-f-k-n-m-a |
MGI ID | ||||||||||
| Lipa (3.2) | 34,568,473-34,599,332 | 30,860 | 9 −ve | 45,435 | 397 | 8.2 | BC058564 | ENSMUST00000049572 | Q9Z0M5 | NM_021460 | 96789 | |
| Lipf (2.5) | 34,035,738-34,051,303 | 15,566 | 9 +ve | 44,637 | 395 | 6.4 | BC061067 | OTTMUSG00000028348 | ENSMUST00000025680 | Q9CPP7 | NM_026334 | 1914967 |
| Lipk (0.3) | 34,082,780-34,122,287 | 39,508 | 9 +ve | 45,243 | 398 | 8.7 | BK055815 | ENSMUST00000054260 | Q8BM14 | NM_172837 | 2679259 | |
| Lipm (0.8) | 34,175,433-34,197,049 | 21,617 | 9 +ve | 48,254 | 422 | 8.7 | BC031933 | ENSMUST00000025685 | Q8K2A6 | NM_023903 | 1926003 | |
| Lipn (0.13) | 34,141,848-34,159,408 | 17,561 | 9 +ve | 45,744 | 400 | 6.8 | AK154333 | OTTMUSG00000029762 | ENSMUST00000025682 | Q3U4B4 | NM_027340 | 1917416 |
| Lipo1 (1.0) | 33,851,027-33,861,942 | 10,916 | 9 (−ve) | 44,668 | 399 | 6.1 | AI747699 | ENSMUSG00000079342 | ENSMUST00000112506 | 2NP_001013792 | 2147592 | |
| Lipo2 5 | 33,795,278-33,825,842 | 30,565 | 9 −ve | 44,856 | 399 | 6.5 | AK139780 | OTTMUSG00000033077 | ENSMUST00000025694 | 1XM_994361 | 3644466 | |
| Lipo3 5 | 33,630,724-33,659,458 | 28,735 | 9 −ve | 44,695 | 399 | 6.5 | AK170332 | ENSMUSG00000024766 | ENSMUST00000112508 | |||
| Lipo4 5 | 33,573,637-33,592,260 | 18,624 | 9 −ve | 44,771 | 398 | 6.3 | OTTMUSG00000033071 | ENSMUST00000112511 | 1XM_001477927 | 3779637 | ||
|
Rat
Rattus norvegicus |
Chromosome 1
Gene order:o-f-k-n-m-a |
RGD ID | ||||||||||
| Lipa (0.5) | 238,466,493-238,500,195 | 33,703 | 9 −ve | 45,079 | 397 | 6.3 | BC072532 | ENSRNOT00000025845 | Q64194 | NM_012732 | 3008 | |
| Lipf (0.05) | 237,841,539-237,856,579 | 15,041 | 9 +ve | 44,588 | 395 | 6.1 | X02309 | ENSRNOG00000019448 | ENSRNOT00000027969 | P04634 | NM_017341 | 708441 |
| Lipk (0.01) | 237,889,400-237,910,233 | 20,834 | 9 +ve | 45,337 | 397 | 8.7 | ENSRNOG00000019409 | ENSRNOT00000026299 | NM_001106374 | 1309724 | ||
| Lipm 5 | 237,964,915-237,983,386 | 18,472 | 9 +ve | 48,103 | 422 | 8.7 | ENSRNOG00000019301 | ENSRNOT00000026219 | 2XP_001079892 | 1304912 | ||
| Lipn (0.03) | 237,932,633-237,948,802 | 16,169 | 9 +ve | 45,628 | 398 | 8.2 | ENSRNOG00000019395 | ENSRNOT00000026242 | 2XP_574655 | 1560354 | ||
| Lipo 5 | 237,642,349-237,653,919 | 11,571 | 9 −ve | 44,441 | 397 | 5.7 | ENSRNOG00000025444 | ENSRNOT00000035013 | 2XP_220070 | 1565682 | ||
|
Clawed Frog
Xenopus tropicalis |
Scaffold 150 | Xenbase | ||||||||||
| LIPA 5 | 1,826,750-1,838,449 | 11,700 | 9 +ve | 45,454 | 404 | 5.8 | BC106353 | Q3KQ76 | NM_001015847 | 952976 |
RefSeq: the reference amino acid sequence
predicted Ensembl amino acid sequence
BLAT predicted amino acid sequences are shown (see http://www.ncbi.nlm.nih.gov ); GenBank IDs are derived from NCBI sources http://www.ncbi.nlm.nih.gov/genbank/; Vega gene ID was derived from the Vertebrate Genome Annotation (VEGA) database http://vega.sanger.ac.uk ; Ensembl ID was derived from Ensembl genome database http://www.ensembl.org
relative level of gene expression was obtained from the AceView database for human, mouse and rat gene transcripts http://www.ncbi.nlm.nih.gov/IEB/Research/Acembly/index.html?mouse
result not available; UNIPROT refers to UniprotKB/Swiss-Prot IDs for individual acid lipases (see http://kr.expasy.org); bps refers to base pairs of nucleotide sequences; pI refers to theoretical isoelectric points; the number of coding exons are listed. Sources for acid lipase sequences were provided by the above sources (see Table 1).
BLAT analyses were subsequently undertaken for each of the predicted acid amino acid sequences using the UC Santa Cruz genome browser [http://genome.ucsc.edu/cgi-bin/hgBlat] (Kent et al. 2003) with the default settings to obtain the predicted locations for each of the mammalian acid lipase genes, including predicted exon boundary locations and gene sizes (see Table 1). Structures for mouse acid lipase isoforms were obtained using the AceView website (http://www.ncbi.nlm.nih.gov/IEB/Research/Acembly/index.html?human) to examine predicted gene and protein structures to interrogate this database of mouse mRNA sequences for mouse Lipa, Lipf, Lipk, Lipm, Lipn and Lipo1 genes(Thierry-Mieg and Thierry-Mieg, 2006).
Predicted Structures and Properties of Mouse Acid Lipases
Predicted secondary and tertiary structures for mouse acid lipases were obtained using the PSIPRED v2.5 web site tools provided by Brunel University [http://bioinf.cs.ucl.ac.uk/psipred/psiform.html] (McGuffin et al. 2000) and the SWISS MODEL web tools [http://swissmodel.expasy.org], respectively (Guex & Peitsch 1997; Kopp & Schwede 2004). The reported tertiary structure for human gastric lipase (LIPF) (Roussel et al., 1999) served as the reference for the predicted mouse acid lipase tertiary structures, with a modeling range of residues 22-395 (LIPA); 20-395 (LIPF); 27-394 (LIPK); 40-409 (LIPM); 28-398 (LIPN); and 24-392 (LIPO1). Theoretical isoelectric points and molecular weights for mammalian acid lipases were obtained using Expasy web tools (http://au.expasy.org/tools/pi_tool.html). SignalP 3.0 web tools were used to predict the presence and location of signal peptide cleavage sites (http://www.cbs.dtu.dk/services/SignalP/) for each of the predicted mammalian acid lipase sequences (Emanuelsson et al 2007). The NetNGlyc 1.0 Server was used to predict potential N-glycosylation sites for human, mouse and rat acid lipases (http://www.cbs.dtu.dk/services/NetNGlyc/). Predictions of subcellular locations for mammalian acid lipases were conducted using PSORT 11 (http://psort.ims.u-tokyo.ac.jp/form2.html) (Horton & Nakai, 1997).
Mouse Acid Lipase Gene Expression
The mouse genome browser (http://genome.ucsc.edu) (NCBI37/mm9 2007 assembly) (Kent et al. 2003) was used to examine GNF Expression Atlas 2 data using various expression chips for mouse acid lipase genes Lipa, Lipf, Lipk, Lipm, Lipn and Lipo1 (using GenBank ID AI747699) (http://biogps.gnf.org). Mouse chip expression ‘heat maps’ were examined for comparative gene expression levels among mouse tissues showing high (red); intermediate (black); and low (green) expression levels.
Phylogenetic Studies and Sequence Divergence
Alignments of acid lipase protein sequences and percentages of sequence identities were assembled using BioEdit v.5.0.1 and the default settings (Hall, 1999). Alignment ambiguous regions, including the amino and carboxyl termini, were excluded prior to phylogenetic analysis (BioEdit v.5.0.1) yielding alignments of 365 residues for comparisons of mammalian LIPA, LIPF, LIPJ, LIPK, LIPM, LIPN and LIPO sequences with the frog (Xenopus tropicalis) LIPA sequence (Table 1). Evolutionary distances were calculated using the Kimura option (Kimura, 1983) in TREECON (Van de Peer & de Wachter, 1994). Phylogenetic trees were constructed from evolutionary distances using the neighbor-joining method (Saitou & Nei, 1987). Tree topology was reexamined by the boot-strap method (100 bootstraps were applied) of resampling and only values that were highly significant (≥90) are shown (Felsenstein, 1985).
Results and Discussion
Alignments of Mouse Acid Lipase Amino Acid Sequences
Amino acid sequence alignments for five previously reported mouse acid lipases [LIPA, LIPF, LIPK, LIPM and LIPN (Carninci et al., 2005)] are shown in Figure 1 together with predicted sequences for four new acid lipases (designated LIPO1, LIPO2, LIPO3 and LIPO4). The relative values of sequence identities (41-60%) and comparisons of amino acid sequence alignments for the mouse LIPA, LIPF, LIPK, LIPM, LIPN and LIPO1 sequences strongly suggest that these proteins are products of distinct but related gene families, whereas the predicted mouse LIPO1, LIPO2, LIPO3 and LIPO4 sequences exhibited higher levels of identities (76-96%), indicating that these are members of the same family, designated as LIPO (or Lipo for the gene family) (Table 2).
Figure 1. Amino acid sequence alignments for mouse (Mus musculus) acid lipase sequences.

See Table 1 for sources of acid lipase sequences; * identical residues; : 1 or 2 conservative substitutions; . 1 or 2 non-conservative substitutions; residues involved in processing at N-terminus (signal peptide); potential N-glycosylation sites including residues NKT (161-163) which serves as a lysosomal targeting sequence ^LTS; active site residues Ser174; Asp345; and His374; disulfide bond C residues Cys248 and Cys257for human LIPA; helix (human LIPA) or predicted helix; Sheet (human LIPA) or predicted sheet; numbered according to Roussel et al [37]; potential basic amino acid ‘patch’ for lysosomal targeting at LIPA C-terminus +; residues Leu89 and Gln175 contribute to the oxyanion ‘hole’ near active site [37]; and bold underlined font shows known or predicted exon junctions.
Table 2. Percentage identities for human, mouse and rat acid lipase amino acid sequences Numbers show the percentage of amino acid sequence identities.
| Acid Lipase Gene | Human LIPA | Mouse LIPA | Human LIPF | Mouse LIPF | Human LIPJ | Human LIPK | Mouse LIPK | Human LIPM | Mouse LIPM | Human LIPN | Mouse LIPN | Mouse LIPO1 | Rat LIPO |
|---|---|---|---|---|---|---|---|---|---|---|---|---|---|
| Human LIPA | 100 | 74 | 57 | 55 | 53 | 55 | 52 | 59 | 59 | 53 | 55 | 47 | 47 |
| Mouse LIPA | 74 | 100 | 50 | 51 | 50 | 51 | 48 | 54 | 54 | 49 | 50 | 44 | 45 |
| Human LIPF | 57 | 50 | 100 | 76 | 57 | 62 | 60 | 52 | 53 | 50 | 51 | 50 | 51 |
| Mouse LIPF | 55 | 51 | 76 | 100 | 56 | 61 | 60 | 52 | 54 | 50 | 51 | 50 | 51 |
| Human LIPJ | 53 | 50 | 57 | 56 | 100 | 59 | 54 | 52 | 52 | 48 | 48 | 46 | 46 |
| Human LIPK | 55 | 51 | 62 | 61 | 59 | 100 | 81 | 52 | 52 | 50 | 52 | 48 | 50 |
| Mouse LIPK | 52 | 48 | 60 | 60 | 54 | 81 | 100 | 50 | 52 | 46 | 47 | 48 | 50 |
| Human LIPM | 59 | 54 | 52 | 52 | 52 | 52 | 50 | 100 | 87 | 52 | 52 | 44 | 46 |
| Mouse LIPM | 59 | 54 | 53 | 54 | 52 | 52 | 52 | 87 | 100 | 52 | 52 | 45 | 46 |
| Human LIPN | 53 | 49 | 50 | 50 | 48 | 50 | 46 | 52 | 52 | 100 | 81 | 41 | 46 |
| Mouse LIPN | 55 | 50 | 51 | 51 | 48 | 52 | 47 | 52 | 52 | 81 | 100 | 41 | 47 |
| Mouse LIPO1 | 47 | 44 | 50 | 50 | 46 | 48 | 48 | 44 | 45 | 41 | 41 | 100 | 81 |
| Rat LIPO | 47 | 45 | 51 | 51 | 46 | 50 | 50 | 46 | 46 | 46 | 47 | 81 | 100 |
| Mouse LIPO1 | Mouse LIPO2 | Mouse LIPO3 | Mouse LIPO4 | |
|---|---|---|---|---|
| Mouse LIPO1 | 100 | 76 | 77 | 78 |
| Mouse LIPO2 | 76 | 100 | 96 | 91 |
| Mouse LIPO3 | 77 | 96 | 100 | 90 |
| Mouse LIPO4 | 78 | 91 | 90 | 100 |
Numbers in bold show higher sequence identities for mammalian acid lipase gene family members.
Amino acid sequences for these nine mouse acid lipase proteins contained between 395 (LIPF) and 422 (LIPM) residues with the latter exhibiting extended N- and C-termini (Figure 1). The results of three dimensional structural studies for human LIPF were used to identify key residues which are likely to contribute to the catalytic and structural features for these enzymes (sequence numbers refer to mouse LIPA) (Roussel et al., 1999). These included the catalytic triad for the active site (Ser172; Asp343; His372); the active site motif (Gly-Xaa-Ser-Yaa-Gly) (residues 172-176); residues Leu89 and Gln175 (replaced with 175Glu for chicken LIPA) which stabilize the ‘oxyanion’ transition state during catalysis; and cysteine residues which form a disulfide bond (Cys248/Cys257 [37] to support the enzyme’s structure.
The hydrophobic N-terminus signal peptide function (residues 1-18 for mouse LIPA) has been retained for all of the mouse acid lipase sequences examined, although these vary in length from 18 for LIPA (residues 1-18) to 33 (residues 1-33 for LIPM) (Figure 1). The mannose-6-phosphate containing N-glycosylation site (residues 161-3: Asn-Lys-Thr for mouse LIPA) (Sleat et al., 2006) was not present for other mouse acid lipase sequences, with the exception of mouse LIPN, which supports the reported microlocalization of LIPA within lysosomes (Goldstein et al., 1975). A basic amino acid ‘patch’ at the mouse LIPA C-terminus (residues 394Lys-395Lys) is present only within the LIPA sequence, which may interact with lysosomal UDP-N-acetylglucosamine phosphotransferase, causing phosphorylation of specific LIPA residues, which are proposed to target this enzyme for lysosomal location (Baranski et al., 1990). Two other high probability N-glycosylation sites predicted for mouse LIPA (Asn36-Val37-Ser38; and Asn273-274Met-275Ser) were also observed for all other human, mouse and rat acid lipase sequences examined. Other high probability N-glycosylation sites are described in Table 3 and Figure 1, including site 2 for human LIPA (72Asn-73His-74Ser) and mouse LIPO1 and LIPO3 sequences; site 3 for mouse LIPA (99Asn-100Ser-101Ser), mouse LIPF (98Asn-99Asn-100Ser), human LIPJ (68Asn-69Asn-70Ser), mouse LIPM (113Asn-114Asn-115Ser) and mouse LIPN (102Asn-103Gly-104Ser); site 5 for human LIPF (185Asn-186Pro-187Ser) and mouse LIPO3 (183Asn-184Gln-185Ser); site 8 for human LIPA (321Asn-322Gln-323Ser), human LIPJ (288Asn-289Gln-290Ser), human LIPN (320Asn-321Gln-322Ser) as well as mouse and rat LIPO sequences (316Asn-317Gln-318Ser for mouse LIPO1); site 9 for human LIPF (327Asn-328Val-329Thr) and LIPK (327 Asn-328Ile-329Thr); site 10 for mouse LIPO sequences (357Asn-358Leu-359Thr); and site 11 for human LIPN (413Asn-414Leu-415Ser). Four N-glycosylation sites have been previously identified for human LIPJ by three dimensional studies (Roussel et al., 1999) which may contribute to the stability and activity of this enzyme in acid environments. Individual differences were observed for the theoretical isoelectric points (pI) of the human, mouse and rat acid lipases examined, with higher values (pI values > 8) predicted for human LIPK, mouse LIPK and LIPM and rat LIPK, LIPM and LIPN, as compared with the other acid lipases examined, which exhibited lower predicted pI values (Table 1).
Table 3. Predicted N-glycosylation sites for mammalian acid lipases.
| Mammal | Acid Lipase |
Site 1 | Site 2 | Site 3 | Site 4 | Site 5 | Site 6 | Site 7 | Site 8 | Site 9 | Site 10 | Site 11 | Potential N-glycosylation sites |
High probability sites (>0.75) (confirmed)~ |
Lower Probability Sites (0.5-0.74) |
|---|---|---|---|---|---|---|---|---|---|---|---|---|---|---|---|
| Human | LIPA | 36NVS | 72NHS | 101NSS | 161NKT | 273NMS | 321NQS | 6 | 4 | 2 | |||||
| Mouse | LIPA | 34NVT | 99NSS | 159NKT | 271NMS | 319NQS | 5 | 3 | 2 | ||||||
| Rat | LIPA | 34NVT | 99NSS | 159NKT | 271NMS | 319NQS | 5 | 3 | 2 | ||||||
| Human | LIPF | 34NIS~ | 99NNS~ | 185NPS | 271NTS~ | 327NVT~ | 5 | 4 confirmed~ | 0 | ||||||
| Mouse | LIPF | 33NVS | 98NNS | 270NVS | 3 | 2 | 1 | ||||||||
| Rat | LIPF | 33NIS | 68NNS | 98NNS | 184NPT | 270NVS | 5 | 1 | 1 | ||||||
| Human | LIPJ* | 2NIS | 68NNS | 240NMS | 268NST | 288NQT | 296NMT | 6 | 2 | 2 | |||||
| Human | LIPK | 34NIS | 99NNS | 271NMS | 327NIT | 4 | 2 | 1 | |||||||
| Mouse | LIPK | 33NIS | 98NNS | 270NMS | 326NIS | 4 | 1 | 2 | |||||||
| Rat | LIPK | 32NIS | 97NNS | 269NMS | 325NIS | 4 | 1 | 2 | |||||||
| Human | LIPM | 48NIS | 113NNS | 285NMS | 3 | 0 | 2 | ||||||||
| Mouse | LIPM | 48NVS | 113NNS | 285NMS | 3 | 1 | 1 | ||||||||
| Rat | LIPM | 48NVS | 113NNS | 285NMS | 3 | 1 | 1 | ||||||||
| Human | LIPN | 35NTS | 100NGS | 160NKT | 272NQS | 320NQS | 413NLS | 6 | 1 | 4 | |||||
| Mouse | LIPN | 37NAS | 102NGS | 162NKT | 274NMS | 322NQS | 5 | 0 | 4 | ||||||
| Rat | LIPN | 35NAS | 100NGS | 160NKT | 272NMS | 320NQS | 5 | 0 | 4 | ||||||
| Mouse | LIPO1 | 32NVS | 70NSS | 268NTS | 316NQT | 357NLT | 5 | 2 | 2 | ||||||
| Mouse | LIPO2 | 32NVS | 268NKS | 316NQT | 357NLT | 4 | 3 | 1 | |||||||
| Mouse | LIPO3 | 32NVS | 70NSS | 183NQT | 268NKS | 316NQT | 357NLT | 6 | 3 | 2 | |||||
| Mouse | LIPO4 | 32NVS | 70NSS | 268NMS | 316NQT | 357NLT | 5 | 2 | 3 | ||||||
| Rat | LIPO | 32NVS | 70NSS | 157NTT | 268NTS | 316NQT | 5 | 1 | 3 |
Numbers refer to amino acids in the acid sequences, including N-asparagine; K-lysine; I-isoleucine; M-methionine; H-histidine; S-serine; R-arginine; T-threonine; Q-glutamine; and V-valine. Note that there are 11 potential sites identified, including 4 confirmed sites for human LIPF and a lysosomal targeting site (site 4) for human LIPA. High (in bold) and lower probability N-glycosylation sites were identified using the NetNGlyc 1.0 web server (http://www.cbs.dtu.dk/services/NetNGlyc/).
Predicted Secondary and Tertiary Structures for Mammalian Acid Lipases
Analyses of predicted secondary structures for mammalian acid lipase sequences were compared with the previously reported secondary structure for human LIPF, or human gastric lipase, and the predicted structure for human LIPA (Roussel et al., 1999) (Figure 1). Similar α-helix β-sheet structures were observed for all of the mammalian acid lipases examined, particularly near key residues or functional domains, including the α-helix within the N-terminal signal peptides, the β-sheet and α-helix structures surrounding the active site Ser172 (for mouse LIPA) and the α-helix enclosing the lysosomal targeting signal residues (Asn-Lys-Thr residues 159-161 for mouse LIPA). The pattern of secondary structures were very similar to those reported for human LIPF and predicted for human LIPA and are numbered according to Roussel and coworkers (1999). These have been previously described as globular enzymes which are α/β hydrolase-like, contain a core domain between residues 26-200 and 326-396 (see Figure 1 for mouse LIPA), and a central β-sheet composed of 8 strands, designated as β1 – β8, and 6 α-helices, designated as α1, αA, αB1/B2, αC1/C2, αE and αF, with 3 helices on each side of the central β-sheet. In addition, a ‘Cap’ domain is described for human LIPF and LIPA with 8 helices (designated as αe1-αe8) within residues 203-329 for human LIPA (Roussel et al., 1999). This domain may serve as a ‘lid’ for the active site Ser174, restricting access to the aqueous environment but enabling cholesteryl ester and other substrate entry when the ‘lid’ opens. All of these secondary structures have been retained for the mammalian acid lipases examined however these are based on predictions and may not reflect fully structures in vivo.
The predicted tertiary structures for mouse LIPF, LIPK, LIPA, LIPM, LIPN and LIPO1 were sufficiently similar to the previously reported human LIPF (gastric acid lipase) and the predicted human LIPA structures (Roussel et al., 1999) (Figure 2) to enable predictions of these tertiary structures which were based on incomplete sequences for these enzymes (residues 22-393 for mouse LIPA). The predictions observed suggest that the secondary and tertiary structures for human LIPF and LIPA resemble those for each of the six mouse acid lipase proteins examined, reflecting conservation of the major structural features for these enzymes.
Figure 2. Predicted tertiary structures for mouse acid lipases.
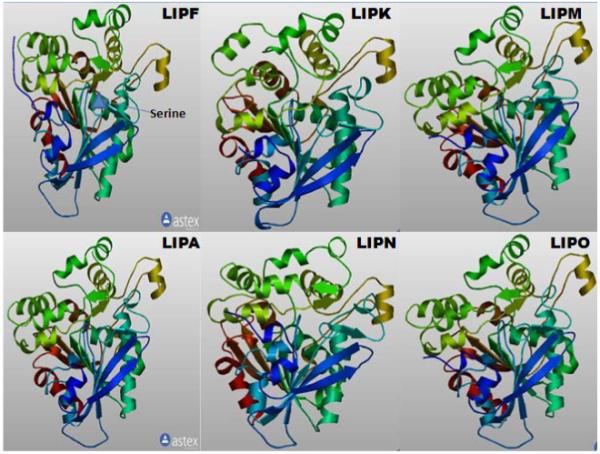
The predicted structures for mouse LIPF, LIPK, LIPA, LIPM, LIPN and LIPO1 are based on the reported structure for human LIPF (Roussel et al., 1999). Predicted structures were obtained using the SWISS MODEL web site http://swissmodel.expasy.org/workspace/index.php?. See Table 1 for sources of these sequences. The rainbow color code describes the 3-D structures from the N-(blue) to C-termini (red color).
Predicted Gene Locations and Exonic Structures for Mammalian Acid Lipase Genes
Table 1 summarizes the predicted locations for mammalian acid lipase genes based upon BLAT interrogations of several mammalian genomes using the reported sequences for human and mouse acid lipases, LIPA (Anderson et al., 1994; Ameis et al, 1994), LIPF (Bodmer et al., 1987; Lohse et al., 1997), LIPJ, LIPK, LIPM and LIPN) (Deloukas et al., 2004; Toulza et al, 2007), and the predicted sequences for rat acid lipases (see Table 1 for sources) and the UC Santa Cruz Genome Browser (Kent et al. 2003). The mammalian acid lipase genes were located in a gene cluster in each case, although the gene order underwent changes for different species, including an addition of one (rat) or four (mouse) acid lipase genes, designated as LIPO (Lipo for the gene family). Supplementary Table 1 also provides data for other mammalian acid lipases genes, including those predicted for chimpanzee, orangutan, horse, cow, guinea pig and dog genomes. These BLAT interrogations of mammalian genomes with the corresponding acid lipase sequences suggested that the gene cluster was syntenic for chromosomes 10 (human, chimp and orangutan), 9 (rhesus monkey), 19 (mouse), 1 (rat and horse) and 26 (cow and dog). Figure 1 summarizes the predicted exonic start sites for human, mouse and rat acid lipase genes with each having 9 coding exons, in identical or similar positions to those reported for the human acid lipase genes (Deloukis et al., 2004).
Comparative Mouse Acid Lipase Gene Expression and Transcripts
Figure 3 illustrates the comparative predicted structures of mRNA mouse acid lipase gene transcripts (http://www.ncbi.nlm.nih.gov/IEB/Research/Acembly/index.html?mouse) for the major transcript isoform in each case (Theirry-Mieg & Thierry-Mieg, 2006). There were 9 introns present for the mRNA transcripts for all mouse acid lipase genes with the exception of Lipo1, which contained 10 introns, and 9 coding exons. Mouse Lipa and Lipo1 transcripts were encoded on the minus strand whereas other mouse acid lipases were encoded on the positive strand (Table 1; Figure 3). With the exception of mouse Lipn transcripts, mouse acid lipase transcripts contained extended 3′-noncoding sequences.
Figure 3. Gene structures and major splicing isoforms for mouse Lipa, Lipf, Lipk, Lipm, Lipn and Lipo1 genes.
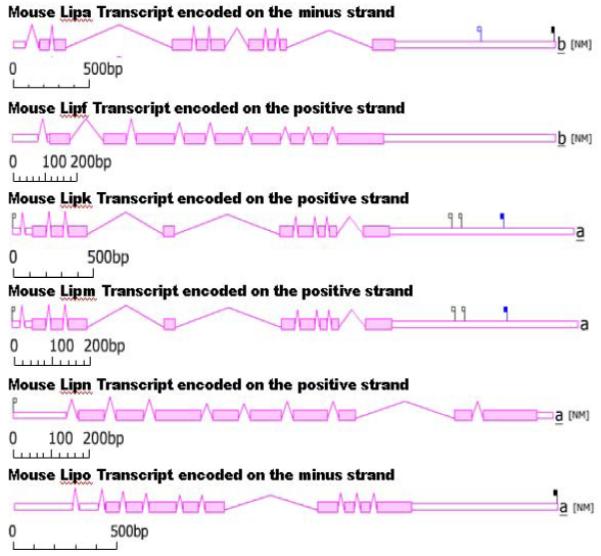
From AceView website (Thierry-Mieg and Thierry-Mieg, 2006) http://www.ncbi.nlm.nih.gov/IEB/Research/Acembly/ Mature isoform variants (designated as a or b isoform) are shown for each mouse gene transcript with capped 5′- and 3′- ends for the predicted mRNA sequences. Scales of base pairs of nucleotide sequences are shown. Flags identify validated endings: cap site on the 5′ side, polyadenylation site on the 3′ side. Filled flags correspond to frequent events while empty flags have lesser supporting cDNAs (all validated); at the 3′ side, black flags are associated to the main AATAAA signal, blue flags to any single letter variant of the major sequence.
Figure 4 presents ‘heat maps’ showing comparative gene expression for various mouse tissues obtained from GNF Expression Atlas Data using the U74a (Lipa), GNF1N (Lipf, Lipk Lipn and Lipo) and U74b (Lipm) mouse chips (http://genome.ucsc.edu; http://biogps.gnf.org). These data supported a broad tissue expression for mouse Lipa (Du et al., 1996); mouse Lipf expression in tissues associated with digestion, including pancreas, stomach and salivary gland (Bodmer et al., 1987; and Lipk, Lipm and Lipn expression at higher levels particularly in epidermal tissues, but also in tongue, trachea, liver and kidney (Lipk), trachea, bone marrow and eye (Lipm) and in liver and kidney (Lipn). In contrast, Lipo expression (data available only for the Lipo1 gene) showed higher levels only in the salivary gland. Mouse acid lipase gene expression levels were compared with the expression for average mouse gene (see Table 1) (Theirry-Mieg & Thierry-Mieg, 2006) (http://www.ncbi.nlm.nih.gov/IEB/Research/Acembly/index.html?mouse). Average or higher expression levels were observed for mouse Lipa, Lipf and Lipo1 acid lipase genes, while Lipj, Lipk, Lipm and Lipn showing lower than average expression in the mouse. Similar results were observed for human acid lipase genes with LIPA and LIPF having much higher levels of expression than the average human gene and the other acid lipase genes, LIPJ, LIPK, LIPM and LIPN.
Figure 4. Mouse tissue gene expression ‘heat maps’ for acid lipase genes.
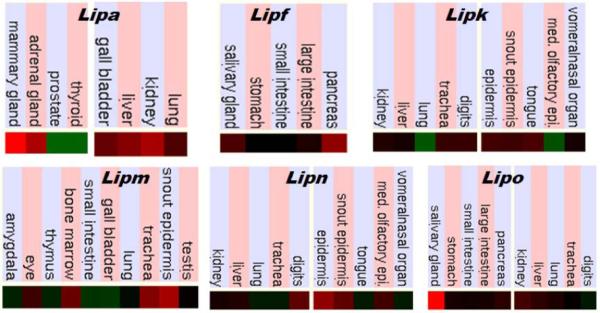
Taken from the mouse genome browser (http://genome.ucsc.edu) (NCBI37/mm9 2007 assembly) (Kent et al. 2003). GNF Expression Atlas 2 data using various expression chips for mouse acid lipase genes Lipa, Lipf, Lipk, Lipm, Lipn and Lipo1 (using GenBank ID AI747699) (http://biogps.gnf.org). Comparative gene expression levels among mouse tissues: red (high); black, (intermediate); and green (low) expression levels.
Sequence Identities and Phylogeny of Mammalian Acid Lipases
Table 2 summarizes the percentages of identity for human and mouse acid lipase family sequences (and the rat LIPO sequence) which are ≥ 74% identical in comparison with the 44-62% identities observed comparing sequence identities between acid lipase families. This supports a proposal for at least 7 mammalian acid lipase gene families, namely LIPA, LIPF, LIPJ, LIPK, LIPM, LIPN and LIPO (designated as Lipo for mouse and rat genes for consistency with other rodent acid lipase genes).
Phylogenetic trees (Figure 5) were constructed from alignments of mammalian acid lipase-like amino acid sequences with the frog (Xenopus tropicalis) LIPA sequence. The dendrogram showed clustering of the sequences into 7 mammalian acid lipase gene family groups. This is consistent with these gene families being present throughout mammalian evolution and of an origin of more than ~100 million years ago, which corresponds to the time of appearance for the eutherian mammalian common ancestor (Woodburne et al., 2003; Donoghue & Benton, 2007). Figure 5 also shows the number of times a clade (sequences common to a node or branch) occurred in the bootstrap analyses with replicate values of 90 or more (which are highly significant) for the 100 replicates undertaken in each case. Of particular interest are the nodes demonstrating highly significant separations for each of the mammalian acid lipase gene family sequences (LIPA, LIPF, LIPJ, LIPK, LIPM, LIPN and LIPO) sequences during mammalian evolution, which supports the separate family status for each of these genes. There were however species differences in the distribution of these mammalian gene families, with LIPJ apparently absent in rodents (mouse, rat and guinea pig), while the Lipo gene family was found only in mouse and rat genomes among the mammalian species studied (Table 1; Figure 5). The highly significant clustering of the mammalian LIPA clade with the single frog acid lipase sequence reported (designated as frog LIPA) (Table 1) suggests that LIPA may have served as a primordial gene for subsequent gene duplication events generating the 7 families of mammalian acid lipases. The sequence and timing however for these proposed acid lipase gene duplication events remain to be determined.
Figure 5. Phylogenetic tree of mammalian acid lipase LIPA, LIPF, LIPJ, LIPK, LIPM, LIPN and LIPO amino acid sequences with frog (Xenopus tropicalis) LIPA sequence.
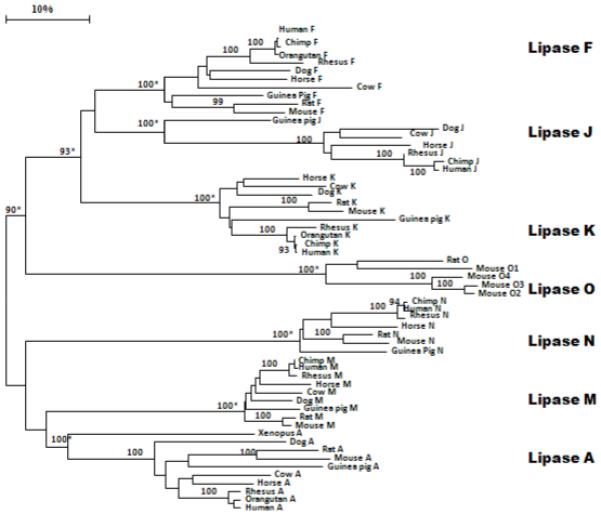
The tree is labeled with the acid lipase gene name and the name of the mammal or frog. Note the major clusters for each of the 7 acid lipase gene families. The gene duplication events generating these distinct gene families (LIPA, LIPF, LIPJ, LIPK, LIPM, LIPN and LIPO) is proposed to have occurred prior to the eutherian mammalian common ancestor estimated at ~100 million years ago (Woodburne et al., 2003). A genetic distance scale is shown. The number of times a clade (sequences common to a node or branch) occurred in the bootstrap replicates are shown. Only replicate values of 90 or more which are highly significant are shown. 100 bootstrap replicates were performed in each case. Of particular interest are the nodes (marked with an asterisk*) supporting the significant separation of each of the acid lipase gene families examined.
Conclusions
The results of this present study support previous studies for at least 6 mammalian acid lipase genes and encoded acid lipases, namely LIPA (encoding lysosomal lipase), LIPF (encoding gastric lipase), LIPJ (encoding a human testis lipase), and LIPK, LIPM and LIPN (encoding epidermal lipases). This report also reports evidence for a new acid lipase gene family in mouse and rat (designated as Lipo), for which the mouse genome contains 4 Lipo-like genes, designated as Lipo1, Lipo2, Lipo3 and Lipo4, whereas the rat genome contains a single Lipo gene. All of these mammalian acid lipase sequences share key conserved sequences and predicted secondary and tertiary structures that have been reported for human LIPJ and LIPA (Roussel et al., 1999), including active site and catalytic transition state supporting residues, as well as disulfide bond forming cysteine residues. A specific N-glycosylation site involved in the localization of mammalian LIPA within lysosomes was also conserved within mammalian LIPA sequences. Comparative gene expression data showed that human and mouse LIPA and LIPF genes are expressed at higher levels than those for the average gene (as defined by Theirry-Mieg & Thierry-Mieg, 2006; http://www.ncbi.nlm.nih.gov/IEB/Research/Acembly/index.html?mouse) . This is consistent with key metabolic roles for these enzymes in lysosomal cholesterol ester and triglyceride metabolism and in gastric triglyceride metabolism, respectively. A high level of expression for mouse Lipo1 was also observed in the salivary gland, which may indicate a supporting role for this acid lipase in triglyceride hydrolysis, either during mastication of food or the subsequent digestion in the stomach . Phylogeny studies using several mammalian acid lipases (human, chimp, orangutan, mouse, rat, guinea pig, horse, cow and dog) indicated that these genes have apparently appeared prior to the eutherian common ancestor more than 100 million years ago, and may have evolved from one or more vertebrate acid lipase gene common ancestors, which include the vertebrate LIPA gene.
Supplementary Material
Supplementary Table 1: Other mammalian acid lipase (LIPA, LIPF, LIPJ, LIPK, LIPM, LIPN and LIPO) genes and proteins. 1RefSeq: the reference amino acid sequence; 2predicted Ensembl amino acid sequence; and 3BLAT predicted amino acid sequences are shown (see http://www.ncbi.nlm.nih.gov ); GenBank IDs are derived from NCBI sources http://www.ncbi.nlm.nih.gov/genbank/; Ensembl ID was derived from Ensembl genome database http://www.ensembl.org ; 4unknown chromosomal location for cow LIPN gene; 5result not available; bps refers to base pairs of nucleotide sequences; pI refers to theoretical isoelectric points; the number of coding exons are listed. Sources for acid lipase sequences were provided by the above sources (see Table 1).
Acknowledgements
This project was supported by NIH Grants P01 HL028972 and P51 RR013986. In addition, this investigation was conducted in facilities constructed with support from Research Facilities Improvement Program Grant Numbers 1 C06 RR13556, 1 C06 RR15456, 1 C06 RR017515. We gratefully acknowledge the expert assistance of Dr Bharet Patel of Griffith University, Brisbane Australia with the phylogenetic analyses. We also acknowledge the expert advice of Ms Lois Maltais (Mouse Genome Nomenclature) of the Jackson Laboratory and Dr Stan Laulederkind (Rat Genome Database) of the Medical College of Wisconsin regarding the nomenclature for the new acid lipase gene (Lipo) described in this paper.
Footnotes
Publisher's Disclaimer: This is a PDF file of an unedited manuscript that has been accepted for publication. As a service to our customers we are providing this early version of the manuscript. The manuscript will undergo copyediting, typesetting, and review of the resulting proof before it is published in its final citable form. Please note that during the production process errors may be discovered which could affect the content, and all legal disclaimers that apply to the journal pertain.
REFERENCES
- Altschul F, Vyas V, Cornfield A, Goodin S, Ravikumar TS, Rubin EH, Gupta E. Basic local alignment search tool. J. Mol. Biol. 1990;215:403–410. doi: 10.1016/S0022-2836(05)80360-2. [DOI] [PubMed] [Google Scholar]
- Ameis D, Merkel M, Eckerskorn C, Greten H. Purification, characterization and molecular cloning of human hepatic lysosomal acid lipase. Eur. J. Biochem. 1994;219:905–914. doi: 10.1111/j.1432-1033.1994.tb18572.x. [DOI] [PubMed] [Google Scholar]
- Anderson RA, Sando GN. Cloning and expression of cDNA encoding human lysosomal acid lipase/cholesteryl ester hydrolase: similarities to gastric and lingual lipases. J. Biol. Chem. 1991;266:22479–22484. [PubMed] [Google Scholar]
- Anderson RA, Byrum RS, Coates PM, Sando GN. Mutations at the lysosomal acid cholesteryl ester hydrolase gene locus in Wolman disease. Proc. Natl. Acad. Sci. USA. 1994;91:2718–2722. doi: 10.1073/pnas.91.7.2718. [DOI] [PMC free article] [PubMed] [Google Scholar]
- Assmann G, Krauss RM, Frederickson DS, Levy RI. Positional specificity of triglyceride lipases in post-heparin plasma 1973. J. Biol. Chem. 1973;240:7184–7190. [PubMed] [Google Scholar]
- Baranski TJ, Cantor AB, Kornfield S. Mapping and molecular modelling of a recognition domain for lysosomal targeting. J. Biol. Chem. 1991;266:23365–23372. [PubMed] [Google Scholar]
- Bodmer MW, Angal S, Yarranton GT, Harris TJ, Lyons A, King DJ, Pieroni G, Riviere C, Verger R, Lowe PA. Molecular cloning of a human gastric lipase and expression of the enzyme in yeast. Biochim. Biophys. Acta. 1987;909:237–244. doi: 10.1016/0167-4781(87)90083-2. [DOI] [PubMed] [Google Scholar]
- Bovine Genome Project 2008 http://hgsc.bcm.tmc.edu/projects/bovine.
- Carninci P, Kasukawa T, Katayama S, Gough J, Frith MC, Maeda N, Oyama R, Ravasi T, Lenhard B, Wells C, Kodzius R, Shimokawa K, Bajic VB, Brenner SE, Batalov S, Forrest AR, Zavolan M, Davis MJ, Hayashizaki Y. The transcriptional landscape of the mammalian genome. Science. 2005;309:1559–1563. doi: 10.1126/science.1112014. [DOI] [PubMed] [Google Scholar]
- Chenna R, Sugawara H, Koike T, Lopez R, Gibson TJ, Higgins DJ, Thompson JD. Multiple sequence alignment with the Clustal series of programs. Nucleic Acids Res. 2003;31:3497–3500. doi: 10.1093/nar/gkg500. [DOI] [PMC free article] [PubMed] [Google Scholar]
- Chimpanzee Sequencing and Analysis Consortium Initial sequence of the chimpanzee genome and comparison with the human genome. Nature. 2005;437:69–87. doi: 10.1038/nature04072. [DOI] [PubMed] [Google Scholar]
- Deloukas P, Earthrowl ME, Grafham DV, Rubenfield M, French L, Steward CA, Sims SK, Jones MC, Searle S, Scott C, Howe K, Hunt SE, Andrews TD, Gilbert JG, Swarbreck D, Ashurst JL, Taylor A, Battles J, Bird CP, Ainscough R, Almeida JP, Ashwell RI, Ambrose KD, Babbage AK, Bagguley CL, Bailey J, Banerjee R, Bates K, Beasley H, Bray-Allen S, Brown AJ, Brown JY, Burford DC, Burrill W, Burton J, Cahill P, Camire D, Carter NP, Chapman JC, Clark SY, Clarke G, Clee CM, Clegg S, Corby N, Coulson A, Dhami P, Dutta I, Dunn M, Faulkner L, Frankish A, Frankland JA, Garner P, Garnett J, Gribble S, Griffiths C, Grocock R, Gustafson E, Hammond S, Harley JL, Hart E, Heath PD, Ho TP, Hopkins B, Horne J, Howden PJ, Huckle E, Hynds C, Johnson C, Johnson D, Kana A, Kay M, Kimberley AM, Kershaw JK, Kokkinaki M, Laird GK, Lawlor S, Lee HM, Leongamornlert DA, Laird G, Lloyd C, Lloyd DM, Loveland J, Lovell J, McLaren S, McLay KE, McMurray A, Mashreghi-Mohammadi M, Matthews L, Milne S, Nickerson T, Nguyen M, Overton-Larty E, Palmer SA, Pearce AV, Peck AI, Pelan S, Phillimore B, Porter K, Rice CM, Rogosin A, Ross MT, Sarafidou T, Sehra HK, Shownkeen R, Skuce CD, Smith M, Standring L, Sycamore N, Tester J, Thorpe A, Torcasso W, Tracey A, Tromans A, Tsolas J, Wall M, Walsh J, Wang H, Weinstock K, West AP, Willey DL, Whitehead SL, Wilming L, Wray PW, Young L, Chen Y, Lovering RC, Moschonas NK, Siebert R, Fechtel K, Bentley D, Durbin R, Hubbard T, Doucette-Stamm L, Beck S, Smith DR, Rogers J. The DNA sequence and comparative analysis of human chromosome 10. Nature. 2004;429:375–381. doi: 10.1038/nature02462. [DOI] [PubMed] [Google Scholar]
- Dog Genome Project 2005 http://www.broadinstitute.org/mammals/dog.
- Donoghue PCJ, Benton MJ. Rocks and clocks: calibrating the tree of life using fossils and molecules. Trends Genet. 2007;22:424–431. doi: 10.1016/j.tree.2007.05.005. [DOI] [PubMed] [Google Scholar]
- Du H, Witte DP, Grablowski GA. Tissue and cellular specific expression of murine lysosomal acid lipase mRNA and protein. J. Lipid Res. 1996;37:937–949. [PubMed] [Google Scholar]
- Emmanuelsson O, Brunak S, von Heijne G, Nielson H. Locating proteins in the cell using TargetP, SignalP and related tools. Nature Protocols. 2007;2:953–971. doi: 10.1038/nprot.2007.131. [DOI] [PubMed] [Google Scholar]
- Felsenstein J. Confidence limits on phylogenies: an approach using the bootstrap. Evolution. 1985;39:783–791. doi: 10.1111/j.1558-5646.1985.tb00420.x. [DOI] [PubMed] [Google Scholar]
- Gibbs RA, Rogers J, Katze MG, Bumgarner R, Weinstock GM, Mardis ER, Remington KA, Strausberg RL. Evolutionary and biomedical insights from the rhesus macaque genome. Science. 2007;316:222–34. doi: 10.1126/science.1139247. [DOI] [PubMed] [Google Scholar]
- Goldstein JL, Dana SE, Faust JR, Beaudet AL, Brown MS. Role of lysosomal acid lipase in the metabolism of plasma low density lipoprotein. Observations in cultured fibroblasts from a patient with cholesteryl ester storage disease. J. Biol. Chem. 1975;250:8487–8495. [PubMed] [Google Scholar]
- Guex N, Peitsch MC. SWISS-MODEL and the Swiss-PdbViewer: An environment for comparative protein modelling. Electrophoresis. 1997;18:2714–2723. doi: 10.1002/elps.1150181505. [DOI] [PubMed] [Google Scholar]
- Guinea Pig Genome Sequencing Project 2008 http://www.broadinstitute.org/science/projects/mammals-models/guinea-pig/guinea-pig.
- Hall TA. BioEdit: a user-friendly biological sequence alignment editor and analysis program for Windows 95/98/NT. Nucleic Acids Symposium Series. 1999;41:95–98. [Google Scholar]
- Hirata K, Dichek HL, Cioffi JA, Choii SY, Leeper NJ, Quintana L, Kronmal GS, Cooper AD, Quertermous T. Cloning of a unique lipase from endothelial cells extends the lipase gene family. J. Biol. Chem. 1999;274:14170–14175. doi: 10.1074/jbc.274.20.14170. [DOI] [PubMed] [Google Scholar]
- Hoeg JM, Demosky SJ, Pescovitz OH, Brewer HB. Cholesteryl ester storage disease and Wolman disease: phenotypic variants of lysosomal acid cholesteryl ester hydrolase deficiency. Amer. J. Human Genet. 1984;36:1190–1203. [PMC free article] [PubMed] [Google Scholar]
- Horse Genome Project 2008 http://www.uky.edu/Ag/Horsemap/
- Horton P, Nakai K. Better prediction of cellular localization sites with the k nearest neighbors classifier. Proc. Int. Conf. Intell. Syst. Mol. Biol. 1997;5:147–152. [PubMed] [Google Scholar]
- International Human Genome Sequencing Consortium Initial sequencing and analysis of the human genome. Nature. 2001;409:860–921. doi: 10.1038/35057062. [DOI] [PubMed] [Google Scholar]
- Jaye M, Lynch KJ, Krawiec J, Marchadier D, Maugeais C, Doan K, South V, Amin D, Perrone M, Daniel J, Rader DJ. A novel endothelial-derived lipase that modulates HDL metabolism. Nature Genetics. 1999;21:424–428. doi: 10.1038/7766. [DOI] [PubMed] [Google Scholar]
- Kent WJ, Sugnet C,W, Furey TS, Roskin KM, Pringle TH, Zahler AM, Haussler D. The human genome browser at UCSC. Genome Res. 2003;12:994–1006. doi: 10.1101/gr.229102. [DOI] [PMC free article] [PubMed] [Google Scholar]
- Kimura M. The Neutral Theory of Molecular Evolution. Cambridge University Press; Cambridge Mass: 1983. [Google Scholar]
- Kopp J, Schwede T. The SWISS-MODEL Repository of annotated three-dimensional protein structure homology models. Nucleic Acids Res. 2004;32:D230–D234. doi: 10.1093/nar/gkh008. [DOI] [PMC free article] [PubMed] [Google Scholar]
- Lohse P, Chahrokh-Zadeh S, Lohse P, Seidel D. Human lysosomal acid lipase/cholesteryl ester hydrolase and human gastric lipase: identification of the catalytically active serine, aspartic acid, and histidine residues. J. Lipid Res. 1997;38:892–903. [PubMed] [Google Scholar]
- Lowe ME, Rosenblum JL, Strauss AW. Cloning and characterization of human pancreatic lipase cDNA. J. Biol. Chem. 1989;264:20042–20048. [PubMed] [Google Scholar]
- Martin GA, Busch SJ, Meredith GD, Cardin AD, Blankenship DT, Mao SJT, Rechtin AE, Woods CW, Racke MM, Schafer MP, Fitzgerald MC, Burke DM, Flanagan MA, Jackson RL. Isolation and cDNA sequence of human postheparin plasma hepatic triglyceride lipase. J. Biol. Chem. 1998;263:10907–10914. [PubMed] [Google Scholar]
- McGuffin LJ, Bryson K, Jones DT. The PSIPRED protein structure prediction server. Bioinformatics. 2000;16:404–405. doi: 10.1093/bioinformatics/16.4.404. [DOI] [PubMed] [Google Scholar]
- Mouse Genome Sequencing Consortium Initial sequencing and comparative analysis of the mouse genome. Nature. 2002;420:520–562. doi: 10.1038/nature01262. [DOI] [PubMed] [Google Scholar]
- Orangutan Genome Project 2007 http://genome.wustl.edu/genomes/view/pongo_abelii/
- Patrick AD, Lake BD. Deficiency of an acid lipase in Wolman’s disease. Nature. 1969;222:1067–1068. doi: 10.1038/2221067a0. [DOI] [PubMed] [Google Scholar]
- Rat Genome Sequencing Project Consortium Genome sequence of the Brown Norway rat yields insights into mammalian evolution. Nature. 2004;428:493–521. doi: 10.1038/nature02426. [DOI] [PubMed] [Google Scholar]
- Roussel A, Canaan S, Egloff M-P, Riviere M, Dupuis L, Verger R, Cambillau C. Crystal structure of human gastric lipase and model of lysosomal acid lipase, two lipolytic enzymes of medical interest. J. Biol. Chem. 1999;274:16995–17002. doi: 10.1074/jbc.274.24.16995. [DOI] [PubMed] [Google Scholar]
- Saitou N, Nei N. The neighbour-joining method: a new method for reconstructing phylogenetic trees. Mol. Biol. Evol. 1987;4:406–426. doi: 10.1093/oxfordjournals.molbev.a040454. [DOI] [PubMed] [Google Scholar]
- Sleat DE, Zheng H, Qian M, Lobel P. Identification of sites of mannose 6-phosphorylation on lysosomal proteins. Mol. Cell Proteomics. 2006;5:686–701. doi: 10.1074/mcp.M500343-MCP200. [DOI] [PubMed] [Google Scholar]
- The MGC Project Team The status, quality and expansion of the NIH full-length cDNA project: the Mammalian Gene Collection. Genome Res. 2004;14:2121–2127. doi: 10.1101/gr.2596504. [DOI] [PMC free article] [PubMed] [Google Scholar]
- Thierry-Mieg D, Thierry-Mieg J. AceView: A comprehensive cDNA-supported gene and transcripts annotation. Genome Biology. 2006;7:S12. doi: 10.1186/gb-2006-7-s1-s12. http://www.ncbi.nlm.nih.gov/IEB/Research/Acembly/index.html?human. [DOI] [PMC free article] [PubMed] [Google Scholar]
- Toulza E, Mattiuzzo NR, Galliano MF, Jonca N, Dossat C, Jacob D, de Daruvar A, Wincker P, Serre G, Guerrin M. Large-scale identification of human genes implicated in epidermal barrier function. Genome Biol. 2007;8:R107.1–R107.23. doi: 10.1186/gb-2007-8-6-r107. [DOI] [PMC free article] [PubMed] [Google Scholar]
- Van De Peer Y, de Wachter R. TreeCon for Windows: a software package for the construction and drawing of evolutionary trees for the Microsoft Windows environment. Comp. App. Science. 1994;10:569–570. doi: 10.1093/bioinformatics/10.5.569. [DOI] [PubMed] [Google Scholar]
- Wang F, Wang W, Wahala K, Adlercreutz H, Ikonen E, Tikkanen MJ. Role of lysosomal acid lipase in the intracellular metabolism of LDL-transported dehydroepiandrosterone-fatty acyl esters. Amer. J. Physiol. Endocrinol. Metab. 2008;295:E1455–61. doi: 10.1152/ajpendo.90527.2008. [DOI] [PubMed] [Google Scholar]
- Wion KL, Kirchgessner TG, Lusis AG, Schotz MC, Lawn RM. Human lipoprotein lipase complementary DNA sequence. Science. 1987;235:1638–1641. doi: 10.1126/science.3823907. [DOI] [PubMed] [Google Scholar]
- Woodburne MO, Rich TH, Springer MS. The evolution of tribospheny and the antiquity of mammalian clades. Mol Phylogenet Evol. 2003;28:360–385. doi: 10.1016/s1055-7903(03)00113-1. [DOI] [PubMed] [Google Scholar]
- Xenopus tropicalis Genome Project 2005 http://genome.jgi-psf.org/Xentr4/Xentr4.home.html.
Associated Data
This section collects any data citations, data availability statements, or supplementary materials included in this article.
Supplementary Materials
Supplementary Table 1: Other mammalian acid lipase (LIPA, LIPF, LIPJ, LIPK, LIPM, LIPN and LIPO) genes and proteins. 1RefSeq: the reference amino acid sequence; 2predicted Ensembl amino acid sequence; and 3BLAT predicted amino acid sequences are shown (see http://www.ncbi.nlm.nih.gov ); GenBank IDs are derived from NCBI sources http://www.ncbi.nlm.nih.gov/genbank/; Ensembl ID was derived from Ensembl genome database http://www.ensembl.org ; 4unknown chromosomal location for cow LIPN gene; 5result not available; bps refers to base pairs of nucleotide sequences; pI refers to theoretical isoelectric points; the number of coding exons are listed. Sources for acid lipase sequences were provided by the above sources (see Table 1).