Abstract
Purpose
Hepatocellular carcinoma (HCC) is a prevalent solid malignancy. Critically needed discovery of new therapeutics has been hindered by lack of an in vitro cell culture system that can effectively represent the in vivo tumor microenvironment. To address this need, a 3D in vitro HCC model was developed using a biocompatible, chitosan-alginate (CA) scaffold cultured with the human HCC cell lines.
Methods
The correlation between the cell function such as secretion of growth factors and production of ECM in vitro, and the tumor growth and blood vessel recruitment in vivo was investigated.
Results
HCC cells grown on 3D CA scaffolds demonstrated morphology characteristic and increased expression of markers of highly malignant cells. Implantation of CA scaffolds cultured with human HCC cells in mice showed accelerated tumor growth. Histology revealed marked differences in morphology and organization of newly formed blood vessels between tumors produced by different pre-cultured conditions. Resistance to doxorubicin was significantly pronounced in CA scaffold-cultured HCC cells compared to 2D or Matrigel cultured HCC cells.
Conclusions
This 3D model of HCC, with its ability to more closely mimic the in vivo tumor behavior, may serve as an invaluable model for study and application of novel anticancer therapeutics against HCC.
Keywords: scaffolds, chitosan, tumor microenvironment, hepatocellular carcinoma in vitro model, drug resistance
Introduction
Hepatocellular carcinoma (HCC) is one of the most common solid malignancies with over a million new cases diagnosed annually worldwide. Most patients with HCC present in an advanced stage are not amenable to potentially curative treatments (e.g. orthotopic liver transplantation and surgical liver resection) (1). Even the most recent advancements in chemotherapeutics (e.g. Sorafenib) prolong survival by merely three months (2), which signals an urgent need for the development of new and more effective therapies.
Unfortunately, experimental models used to test novel HCC therapies are limited. Costly in vivo animal models remain the most sophisticated and faithful models of the disease (3,4). In vitro studies are an essential component of the initial screening for any anti-cancer therapy, allowing for high-throughput, cost-efficient exploration of potential therapeutics. However, traditional in vitro cell culture on two-dimensional (2D) tissue culture substrates fails to simulate the structure of the tumor microenvironment (TME) present in vivo, i.e., complex cell-cell organization and extracellular matrix (ECM)-cell interactions, which have significant effects on cell phenotype and malignancy (5-8). Cells in 2D culture are forced to adhere to a rigid surface and are geometrically constrained, adopting a flat morphology (7) which alters the cytoskeleton regulation that is important in intracellular signaling, and consequently can affect cell growth, migration, and apoptosis (7,9). Moreover, organization of the ECM, which is essential to cell differentiation, proliferation, and gene expression (10), is absent in 2D cultured tumor cell models. These limitations of 2D cultures often result in biological responses to drugs and potentially curative treatments in vitro strikingly different from what is observed in vivo. The ideal in vitro TME model should provide a platform for in vitro drug screening that will better translate to in vivo testing by mimicking both the spatial arrangement of cells and ECM signaling found in tumors in vivo, resulting in the expression of the native in vivo phenotype in these cells (7,8).
A number of studies have demonstrated that three-dimensional (3D) tumor cell culture in vitro induces an increase in malignant phenotype and drug resistance compared to standard 2D cultured cells (5-9,11,12). The 3D organization of tumor cells has been suggested to play a key role in the induction of environment mediated drug resistance (9,13), via environmental cues including hypoxia (14), and contact signaling with the ECM and neighboring cells (9,15). Therefore, 2D in vitro cell culture models are unlikely to accurately represent the in vivo state. A variety of synthetic and natural materials including poly(lactide-co-glycolide), collagen, fibrin, and the commercially available Matrigel have been explored to replicate the 3D TME in vitro. However, many synthetic materials degrade into acidic non-biocompatible byproducts, and mammalian sourced natural ECM materials introduce pathogens in addition to their high cost. Matrigel, a commercially available proprietary mixture of ECM proteins and growth factors secreted by mouse tumor cells, represents the industry standard for ECM replacement (7,8,10).
In this study, we use a chitosan-alginate (CA) scaffold system to address the limitations of existing in vitro tumor models. Both chitosan and alginate are biocompatible, non-mammalian sourced natural polymers with properties ideal for cell culture scaffold formation. Chitosan, a natural polysaccharide derived from the partial deacetylation of chitin, shares structural similarities to glycosaminoglycans present in the native ECM (16,17). Alginate is a family of polyanionic copolymers derived from brown sea algae, and comprises 1,4-linked β-D-mannuronic and α-L-guluronic residues in varying proportions. The chitosan and alginate can be used to create a 3D interconnected, CA complex porous structure (18,19). Previous studies have demonstrated a number of advantages of the CA scaffold system, including in vitro and in vivo biocompatibility, biodegradability, non-immunogenicity, and an ability to stimulate cell differentiation (18-21). Here we investigate if CA scaffolds can be used to mimic the structure of the in vivo TME of HCC in vitro by inducing a biological response in the HCC cell lines, PLC/PRF/5 (PLC) and HepG2. This in vitro HCC tumor model developed on CA scaffolding more closely resembles the in vivo tumor than traditional 2D cell culture or Matrigel, and may be used as a platform to rapidly evaluate anti-cancer therapies that will translate better to in vivo studies and promote effective treatment of this deadly disease.
Materials and Methods
Materials
All chemicals were purchased from Sigma-Aldrich (St. Louis, MO) unless otherwise specified. Chitosan (PolySciences, PA, 15,000 MW) and sodium alginate powders were used as received. Antibiotic-antimycotic, Dulbecco's phosphate buffered saline (D-PBS), and Alamar Blue reagent were purchased from Invitrogen (Carlsbad, CA). Fetal bovine serum (FBS) was purchased from Atlanta Biologicals (Lawrenceville, GA). PLC/PRF/5 (PLC) and HepG2 human hepatocellular carcinoma cell lines and Eagle's Minimum Essential Medium (MEM), were purchased from American Type Culture Collection (ATCC, Manassas, VA). Cells were maintained according to manufacturers’ instructions in fully supplemented MEM (MEM with 10% FBS and 1% antibiotic-antimycotic) at 37°C and 5% CO2 in a fully humidified incubator. Reduced growth factor Matrigel matrix was purchased from BD Biosciences (San Jose, CA). bFGF, IL-8, and VEGF ELISA kits were purchased from R&D Systems (Minneapolis, MN). PVDF membrane and Immun-star chemiluminescent reagent for dot blotting were purchased from BioRad (Hercules, CA), while antibodies were purchased from Abcam (Cambridge, MA).
Chitosan-alginate scaffold synthesis
The chitosan-alginate (CA) scaffolds were prepared as previously reported (18,19). Briefly, a 4 wt% chitosan and 2 wt% acetic acid solution was mixed under constant stirring in a blender for 7 minutes to obtain a homogeneous chitosan solution. A 4 wt% alginate solution was added to the chitosan solution, and mixed in a blender for 5 minutes to obtain a homogeneous CA solution. The CA solution was cast in 24-well cell culture plates and frozen at –20°C for 8 hr. The samples were then lyophilized, sectioned into discs of 13 mm diameter × 2 mm thickness, crosslinked in 0.2 M CaCl2 solution for 10 minutes under vacuum, washed with deionized water several times to remove any excess salt, and sterilized in 70 v% ethanol for 1 hr. The scaffolds were then transferred to a sterile PBS solution and placed on an orbital shaker for >12 hr to remove any excess ethanol.
Cell culture
Cells were seeded onto damp CA scaffolds in 24-well plates at 50,000 cells in 50 μL fully supplemented media per well. Cells were allowed to infiltrate the scaffold for 1 hr before 1 mL fully supplemented media was added to each well. For Matrigel pre-cultured samples, 50,000 cells suspended in 200 μL fully supplemented media were mixed with 200 μL Growth Factor Reduced Matrigel matrix to form a viscous gel and placed in 24-well plate wells to gelate in situ. Matrigel samples were allowed to gel for 1 hr before 1 mL fully supplemented media was added to each well. For 2D pre-cultured samples, 50,000 cells in 1 mL fully supplemented media were added to 24-well plate wells. Media were replaced every 2 days.
Cellular proliferation analysis
Proliferation of cells cultured on 2D wells, Matrigel matrix, and CA scaffolds was determined using the Alamar Blue assay following the manufacturer's protocol. Briefly, cells were washed with D-PBS before adding 1 mL of Alamar Blue solution (10% Alamar Blue in fully supplemented MEM) to each well. After 2 hrs the Alamar Blue solution was transferred to a 96-well plate to obtain fluorescent values on a SpectraMax M2 microplate reader (Molecular Devices, Sunnyvale, CA) at 550 nm excitation, 590 nm emission. Standard curves were generated by seeding cells counted using a hemocytometer onto cell culture materials in triplicate, and performing Alamar Blue assay to generate a plot of linear regression of fluorescent values vs. cell number for each material. The cell number in an experimental sample was calculated based on the standard curve. No background fluorescence was generated by CA scaffolds. Cells were again washed with D-PBS to remove Alamar Blue solution and fresh fully-supplemented media were added to each well.
Cellular morphology analysis (SEM)
Samples for SEM analysis were first fixed with cold Karnovsky's fixative overnight followed by dehydration in a series of ethanol washes (0%, 50%, 70%, 90%, 100% ethanol in deionized water). Samples were critical point dried and sputter coated with platinum before imaging with a JSM 7000 SEM (JEOL, Tokyo, Japan).
Cellular protein expression analysis
After 9 days of culture, media from cell cultures were replaced with a low serum counterpart (media containing 1% FBS and 1% antibiotic-antimycotic) and cells were incubated for 24 hrs. Media were collected and stored at –80°C for future use. Growth factor (bFGF, IL-8, and VEGF) secretion was determined via ELISA assays following the manufacturer's protocol. The protein concentration per cell was calculated based on cell number in the well, and the values were normalized to 2D culture conditions. Glypican-3 was detected using dot blot analysis and protein concentration per cell was normalized to 2D culture conditions using ImageJ (NIH, Bethesda, MD).
In vivo tissue response
All animal studies were performed in accordance with University of Washington IACUC oversight on approved protocols. Athymic nude male mice (nu/nu, 088 strain, Charles River Labs, Wilmington, MA), 6–8 weeks of age, were anesthetized with a solution of ketamine and xylazine before CA scaffolds containing cells were implanted subcutaneously into the left and right flanks. 2D and Matrigel matrix pre-treated cells were diluted into 100 μL media to a cell number matching that of CA scaffold cultured cells prior to implantation based on Alamar Blue assay, and mixed with 100 μL Matrigel before injecting subcutaneously into the left and right flanks of the anesthetized mice. Four mice were tested per group. CA scaffold tumors were measured using calipers and volume was calculated using the formula of a cylinder, i.e., volume = radius2 × height × π, subtracting initial dimensions of the scaffold (265 mm3), and the formula for an ellipsoid volume (22) (volume = length × width2 × π/6) was used for 2D and Matrigel tumors. 4 weeks post-implantation of PLC and HepG2tumors, mice were sacrificed by CO2 inhalation followed by cervical dislocation, and the tumors were resected, fixed in a 10% formalin solution, and submitted for histological analyses.
Cellular response to chemotherapeutic agents
After 10 days of culture, media from cell cultures were replaced with 1 mL fully supplemented cell culture media containing various concentrations of doxorubicin. Cells were induced with doxorubicin containing media for 24 h, after which media was replaced with standard fully supplemented cell culture media. Cell viability was assessed using the Alamar Blue assay following the manufacturer's protocol as described above. LD50 was estimated via a polynomial approximation.
Statistical methods
All experiments were performed in quadruplicate (n = 4). Data are presented as means ± standard deviation. Statistical analysis at each sampling point was performed using one-way analysis of variance (ANOVA) comparing each treatment condition. Differences were considered significant for p < 0.05.
Results
In vitro cell response
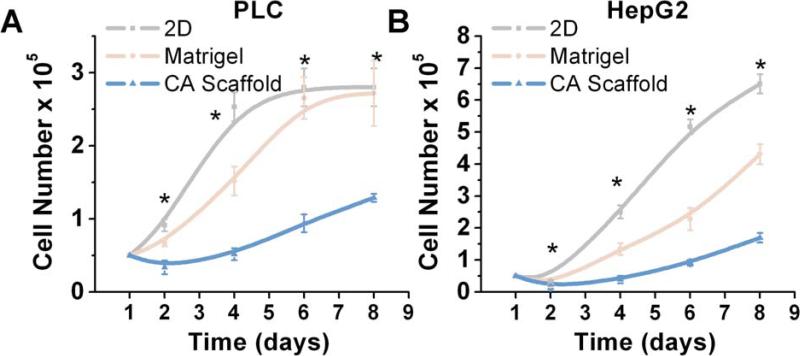
In vitro models of hepatocellular carcinoma (HCC) were generated by culturing human PLC/PRF/5 (PLC) or HepG2 cells in either a 2D surface, Matrigel, or CA scaffold environment. The proliferative response of these cells was compared using the Alamar Blue assay. As shown in Fig. 1, successful expansion and propagation was observed for both PLC and HepG2 cell lines in all three substrate conditions. Statistically significant differences in PLC proliferation were observed at 2 (p < 0.01), 4 (p < 0.01), 6 (p < 0.01) and 8 (p < 0.01) days. Similarly, HepG2 also exhibited statistically significant changes in proliferation at 2 (p < 0.01), 4 (p < 0.01), 6 (p < 0.01), 8 (p < 0.01) days. However, the proliferation rates in 3D culture conditions, i.e., Matrigel and CA scaffolds were significantly lower than the rates in the 2D condition.
Fig. 1.
Effect of culture conditions on Hepatocellular carcinoma cell proliferation. Populations of (a) PLC and (b) HepG2 cells cultured for a period of 8 days on 2D plates, Matrigel matrices, and CA scaffolds. Cellular proliferation was determined by the Alamar blue assay. Results are shown as mean ± s.d., and * indicates at least one of the group means is statistically different from the others at that time point, p < 0.05, n = 4.
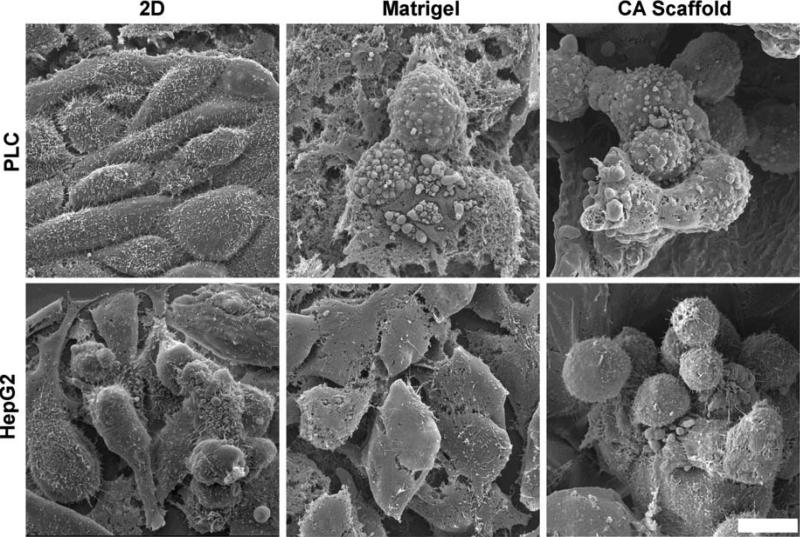
The effect of the culture microenvironment on cell morphology was evaluated by SEM, which showed significant differences in cell morphology and organization between 2D and 3D culture conditions for both HCC cell lines (Fig. 2). PLC cells cultured on a flat monolayer 2D condition exhibited an elongated morphology, whereas when cultured in Matrigel, cells exhibited an enlarged spherical morphology, and clustered together within the provided ECM. This 3D organization of PLC cells was also observed when cultured in CA scaffolds, where spherical cells formed large dense aggregates within the pores of the scaffold. Similarly, HepG2 cells exhibited a spherical morphology when cultured in either Matrigel or CA scaffolds, and demonstrated greater organization by formation of stacked groupings of cells that filled the scaffold pores.
Fig. 2.
Effect of culture conditions on hepatocellular carcinoma cell morphology as observed by SEM. PLC (top) and HepG2 (bottom) cells were cultured on 2D tissue culture plates, Matrigel matrices and CA scaffolds for 10 days. The scale bar represents 10 μm.
Cellular protein expression
The protein expression profile of the cultured cells was examined to determine if the various culture conditions would affect the secretion of growth factors or cytokines that may stimulate tumor expansion and promote malignancy. The expansion of malignant tumors has been shown to be dependent on the development and maintenance of the surrounding vascular network in vivo (23), therefore, we evaluated the expression of pro-angiogenic growth factors IL-8, bFGF, and VEGF, secreted by HCC cells, using ELISA assays. IL-8 has been implicated in cell proliferation, invasion, and recruitment of blood vessels for cancer cell survival (23). As illustrated in Fig. 3A, IL-8 expression was upregulated by both PLC and HepG2 cells cultured in CA scaffolds, by a factor of 2.86 ± 0.38 fold (p < 0.01) and 4.37 ± 0.84 fold (p < 0.01), respectively, as compared to 2D cultured cells. bFGF is a chemotactic signal that induces endothelial cell migration, an angiogenic phenotype, stimulating proliferation, and the release of ECM remodeling enzymes (24). As shown in Fig. 3B, CA scaffold-cultured PLC and HepG2 cells both increased the expression of bFGF by a factor of 1.83 ± 0.22 fold (p < 0.01) and 3.16 ± 0.81 fold (p < 0.01), respectively, as compared to their 2D counterparts. VEGF is a multi-functional cytokine that plays an important role in angiogenesis (25). VEGF expressed by PLC and HepG2 cells cultured in CA scaffolds was significantly higher than that of 2D cultured cells, by a factor of 2.28 ± 0.27 fold (p < 0.01) and 2.54 ± 0.43 fold (p < 0.01), respectively (Fig. 3C).
Fig. 3.
Comparison of growth factor expression profiles of hepatocellular carcinoma cells cultured in vitro for 10 days on different culture conditions. (a) IL-8, (b) bFGF, and (c) VEGF secretion by PCL and HepG2 cells cultured on 2D tissue culture plates, Matrigel matrices, and CA scaffolds as determined by ELISA. Results are mean ± s.d., and * indicates at least one of the means in that group is statistically different from the others, p < 0.05, n = 4.
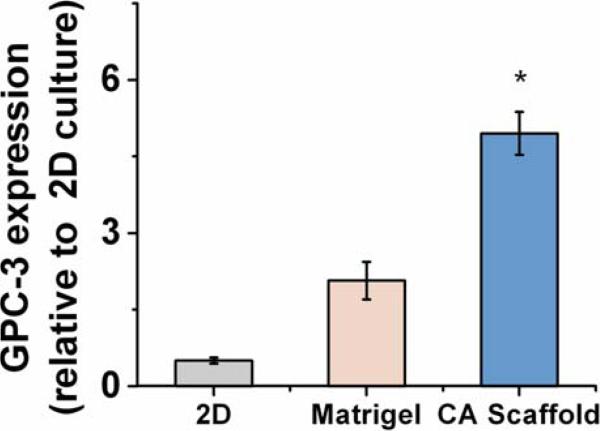
Glypican-3 (GPC-3) is a surface proteoglycan expressed in up to 83% of HCC's and has been used as a specific marker of a cell's malignant transformation (26-28). HepG2 is known to express a high level of this gene, while PLC does not (26). Dot blots used to determine the GPC-3 expression level showed that GPC-3 expression in HepG2 cells cultured in 3D Matrigel and CA scaffolds was greatly increased, by 2.6 ± 0.37 fold and 5.5 ± 0.42 fold (p < 0.01), respectively, compared to 2D culture (Fig. 4).
Fig. 4.
Glypican-3 (GPC-3) expression by HepG2 hepatocellular carcinoma cells cultured in vitro for 10 days on 2D tissue culture plates, Matrigel matrices, and CA scaffolds, as determined by dot blot analysis. Results are mean ± s.d., and * indicates at least one of the means is statistically different from the others, p < 0.05, n = 4.
In vivo tissue response
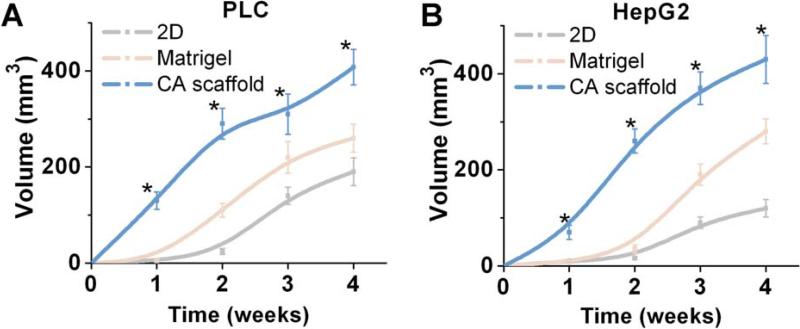
The in vivo tissue response to implantation of HepG2 and PLC cells pre-cultured in the three in vitro conditions, i.e., 2D, Matrigel, and CA scaffold cultures, was evaluated in a subcutaneous xenograft model in athymic nude mice. Initial cell numbers were normalized to the number of cells in CA scaffold culture. Tumor volumetric measurements over a four-week period demonstrated significant increases in tumor size for CA scaffold pre-cultured HCC cells compared to both 2D and Matrigel pre-cultured HCC cells (Fig. 5). CA pre-cultured PLC cells generated final in vivo tumor volumes nearly twice as large as that generated by PCL cells pre-cultured in 2D or Matrigel, while maintaining consistent proliferation rates between pre-culture conditions (Fig. 5A). Statistically significant differences were observed between PLC cultured samples at 1 (p < 0.01), 2 (p < 0.01), 3 (p < 0.01), and 4 (p < 0.01) weeks. Similarly, CA pre-cultured HepG2 cells expanded to form tumors over four times the size of 2D cultured cells, and significantly larger than those pre-cultured in Matrigel, again maintaining consistent proliferation rates for this cell line (Fig. 5B), with statistically significant differences between samples at the 2 (p < 0.01), 4 (p < 0.01), 6 (p < 0.01) and 8 (p < 0.01) week time points as well. The CA pre-cultured cells effected favorable conditions for tumor expansion in vivo without altering expansion rates for either HCC cell line.
Fig. 5.
Effect of pre-culture conditions on tumor growth in vivo. Tumor volume induced by subcutaneously implanted (a) PLC and (b) HepG2 cells pre-cultured on 2D tissue culture plates, Matrigel matrices, or CA scaffolds, as determined by caliper measurements. Results are mean ± s.d. and * indicates at least one of the group means is statistically different from the others at that time point, p < 0.05, n = 4.
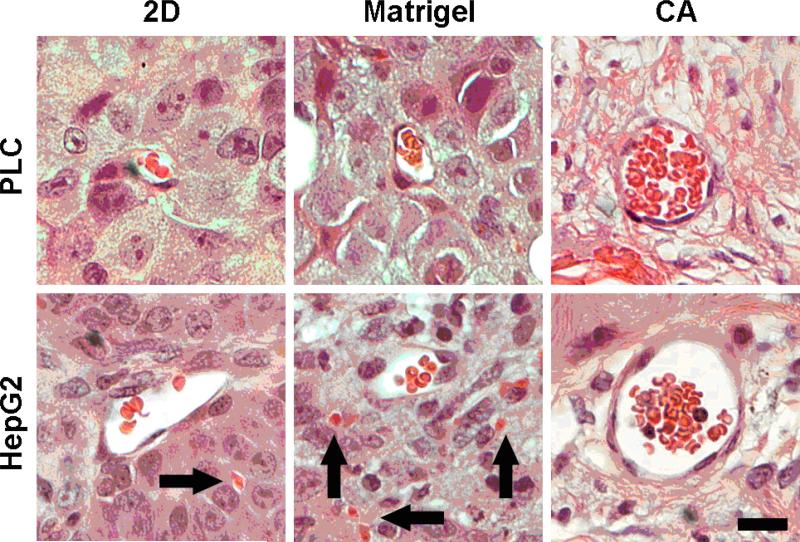
Tumors were harvested 4 weeks post-implantation, formalin-fixed, and sectioned for histological imaging. Hematoxylin and eosin staining revealed significant differences in blood vessel morphology based on pre-culture condition (Fig. 6). Both 2D and Matrigel pre-cultured cells displayed consistently small and irregularly shaped blood vessels with poorly endothelialized thin walls which did not consistently delineate the vessel from the surrounding tissue. In contrast, CA pre-cultured cells induced the formation of large, well rounded blood vessels with well-defined endothelial linings, carrying large numbers of erythrocytes. Additionally, the original porous structure of the CA scaffold was not observed in the histological samples, indicating the scaffold is completely removed by the remodeling action of the cells, confirming the scaffold's excellent biodegradability.
Fig. 6.
Hematoxylin and eosin stained histological sections of tumors induced by implanted hepatocellular carcinoma cells pre-cultured on 2D tissue culture plates, Matrigel matrices, or CA scaffolds. The implants were harvested 4 weeks post implantation in nude mice. Nuclei are stained dark purple, cytoplasm is stained light red, erythrocytes are stained bright red, and connective tissue is stained pink. Arrows indicate extravascular erythrocytes. The scale bar represents 20 μm.
Cellular response to chemotherapy
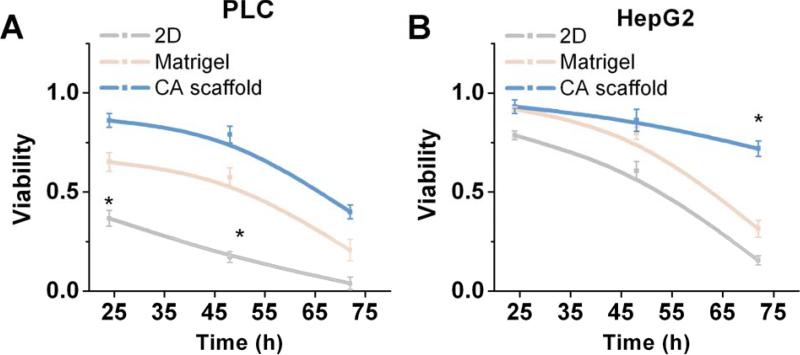
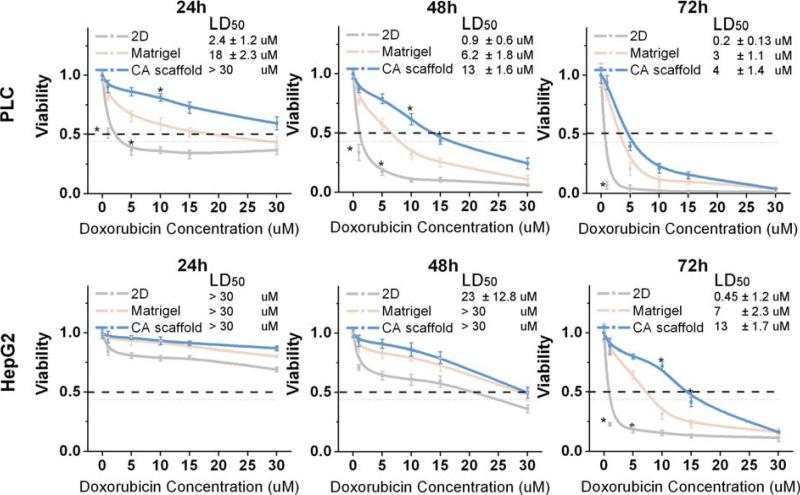
To determine if the in vitro microenvironment is capable of inducing an environment-mediated drug response in our tumor models, cell viability in response to doxorubicin treatment was evaluated. Cell viability was then assessed over a 72-hour period using the Alamar Blue assay (Figs. 7 and 8). Successive viability measurements of doxorubicin treated cells revealed significantly different cytotoxic responses between cell types and culture conditions (Fig. 7). PLC cell viability declined rapidly in 2D culture, with statistically significant differences in cell viability observed at 24 hours (p < 0.01) and 48 hours (p < 0.01) after treatment between culture conditions when treated with 5 μM doxorubicin (Fig. 7). After 24 hours of drug induction, a differential, dose-dependent survival response was observed where viability of 2D cultured PLC cells was significantly lower than either Matrigel or CA cultured cells after treatment with 1 μM (p < 0.01), 5 μM (p < 0.01), and 10 μM (p < 0.01) doxorubicin (Fig. 8). At 48 hours, differences in the survival of PLC cells based on culture condition became more apparent, and viability of CA cultured cells was also observed to be significantly higher than other culture models in 1 μM (p < 0.01), 5 μM (p < 0.01), and 10 μM (p < 0.01) doxorubicin treatments (Fig. 8). Finally, significant differences in PLC viability between culture conditions was observed 72 hours after 1 μM (p < 0.01) doxorubicin treatment (Fig. 8). In a similar fashion, HepG2 cells also responded differentially to doxorubicin dose over time. Differences in HepG2 viability between cell culture conditions were not apparent until 72 hours post treatment (p < 0.01) when treated with 10 μM doxorubicin (Fig. 7). While the onset of cell death in HepG2 cells was much less pronounced at 24 and 48 hours compared to PLC cells, the viability was notably decreased in 2D cultures compared to both Matrigel and CA 3D cultures, statistically significant differences observed in HepG2 viability observed at 72 hours when treated with 1 μM (p < 0.01), 5 μM (p < 0.01), and 10 μM (p < 0.01) doxorubicin (Fig. 8). Interestingly, at 72 hours, the viability of HepG2 cells cultured on CA scaffolds and exposed to 1 μM doxorubicin increased slightly to 88.6 ± 2.75% compared to 86.7 ± 2.4% at 48 hours (Fig. 8). The viability measurements indicated that a population of HepG2 cells cultured in CA scaffolds had survived doxorubicin treatment that had eliminated cells cultured on 2D plates.
Fig. 7.
Assessment of drug resistance of hepatocellular carcinoma cells cultured under different conditions. Viability of (a) PCL and (b) HepG2 cells cultured on 2D tissue culture plates, Matrigel matrices, or CA scaffolds, relative to untreated cells, as determined by the Alamar blue assay after Doxorubicin treatment. PLCs were treated with 5 μM Doxorubicin, while HepG2 were treated with 10 μM doxorubicin. Results are mean ± s.d., and * indicates at least one of the group means is statistically different from the others at that time point, p < 0.05, n = 4.
Fig. 8.
Dose-dependent cytotoxic response of hepatocellular carcinoma cells to Doxorubicin. PLC (top row) and HepG2 (bottom row) cells were cultured on 2D tissue culture plates, Matrigel matrices, or CA scaffolds for 10 days before treatment with Doxorubicin. Cell viability relative to untreated cells was determined by the Alamar blue assay at 24 h, 48 h and 72 h after Doxorubicin treatment. LD50 was calculated based on viability data. Results are mean ± s.d., and * indicates at least one of the group means is statistically different from the others at that time point, p < 0.05, n = 4.
The LD50 of a drug is defined as the median lethal dose and commonly used as a measure of the effectiveness of a drug in inhibiting biological or biochemical function (29). The LD50 of doxorubicin in each of the conditions was evaluated post induction, where both HCC cell types displayed significant differences in cell viability across culture conditions (Fig. 8). The LD50 of doxorubicin was 0.2 ± 0.13 μM for PLC cells cultured on 2D surfaces, 3 ± 1.1 μM for Matrigel cultured, and 4 ± 1.4 μM CA cultured cells as determined at 72 hours post treatment (Fig. 8). Similarly, the LD50 for doxorubicin treated HepG2 cells cultured in 2D substrate was 0.45 ± 0.18 μM, increasing to 7 ± 2.2 μM in Matrigel, and finally to 13 ± 1.7 μM in CA at 72 hours post treatment (Fig. 8).
Discussion
Tumor cells cultured on standard 2D tissue culture flasks are exposed to a dramatically altered structural microenvironment as compared to in vivo tumors, and thus display altered cell function and response to drug treatment. An in vitro model that can more closely mimic the structure of the tumor microenvironment (TME) could dramatically improve the translation of novel chemotherapeutics from in vitro to in vivo testing. To this end, we use a biocompatible chitosan-alginate complex scaffold to model the structure of the TME of HCC in vitro. The difference in proliferation rate observed between 2D, Matrigel matrix and CA scaffold culture conditions in Fig. 1 can be attributed to the diffusion-limitations imposed by 3D culture environments (7,12). The TME is inherently heterogeneous (7,9), with the cells at the periphery of a tumor mass receiving the most nutrients and oxygen, while the cells closer to the center are typically hypoxic (5,12,13), whereas 2D monolayer cultured cells have no barrier to this exchange. 3D CA scaffolds allow for cell clusters to form en masse, creating 3D multicellular microenvironments (Fig. 2) which may permit additional interactions between cells that cannot be generated by 2D culture (8). Changes in ECM deposition patterns and the ability to form tight junctions with neighboring cells in the 3D CA scaffold likely facilitate the formation of these cell clusters. This complex arrangement of cells cultured in CA scaffolds resembles that of multicellular spheroid cultures used to model tumor behavior (8,9,12,30).
Further analysis of differently cultured HCC cells revealed that expression of the angiogenic factors IL-8, bFGF, and VEGF were elevated in CA scaffold cultured cells compared to both 2D and Matrigel cultured cells (Fig. 3). This suggests that the cell-cell and cell-ECM interactions created upon culture in CA scaffolds more faithfully mimicked the native TME conditions that regulate angiogenic factor secretion. Also, GPC-3 expression, which is correlated with poor patient survival, and is a potential prognostic factor (31), was significantly elevated in CA cultured HepG2 cells (Fig. 4). This is consistent with previous in vivo studies (32), where the upregulation of GPC-3 was accompanied by increased signaling via the angiogenic bFGF pathway, as observed in our study. CA scaffolds stimulate the concurrent expression of multiple markers for increased malignancy, consistent with in vivo observations, suggesting that CA scaffolds provide microenvironmental cues which neither 2D nor Matrigel microenvironments simulate faithfully.
The rapid in vivo tumor expansion by the CA scaffold pre-cultured cells (Fig. 5) may be a result of the rapid establishment of neovasculature, since the growth factors vital for the recruitment and maturation of blood vessels were highly expressed in CA tumor models (Fig. 3). The increased pro-angiogenic growth factor secretion by CA scaffold pre-cultured cells promptly overcame the initial lack of vascularization within the flank tumor implant providing sufficient nutrients for rapid tumor formation. This was confirmed by observed blood vessel formation in histological sections which revealed that blood vessel morphology and organization varied tremendously based on pre-treatment (Fig. 6). Extravascular pockets of bright red erythrocytes associated with poorly formed leaky vasculature, which is indicative of angiogenesis (33), were visible in Matrigel pre-cultured HepG2. CA scaffold pre-cultured HCC tumors contained large, round, well endothelialized blood vessels without intraluminal bridging, characteristic of VEGF induced tumor vasculature (33). Compared to Matrigel pre-cultured HepG2 tumors, there were a large number of erythrocytes in the blood vessel and no notable extravascular erythrocytes in CA HCC samples. Blood vessel formation after 4 weeks of in vivo growth correlated well with angiogenic growth factor expression in vitro, suggesting persistent phenotypical changes induced by in vitro cell culture conditions.
The microenvironment conditions produced in our CA tumor models induced significant changes in cellular behavior as compared to conventional 2D culture environments, consistent with many studies on environment-mediated, multicellular drug resistance (1,5-10,12-14). Doxorubicin is an anthracyline antibiotic which induces apoptosis in HCC by intercalating DNA and interfering with topoisomerase II DNA replication. It is a cytotoxic agent commonly incorporated in catheter-based therapies for metastatic disease, ideal for measuring and comparing response of systemic therapies against HCC (34), and thus was selected as our model drug treatment. 2D, Matrigel, and CA scaffold cultured HCC cells were treated with doxorubicin supplemented media for 24 hours at a physiologically relevant dose based on the clearance rate of doxorubicin in vivo (35). Overall, CA cultured cells exhibited significantly greater viability than either 2D or Matrigel cultured cells when exposed to doxorubicin, suggesting that the CA microenvironment induced greater resistance to chemotherapy. The LD50 for doxorubicin treated PLC cells increased significantly, by nearly twenty times in 3D culture compared to 2D culture, and for HepG2, tumor models formed in CA scaffolds had an LD50 nearly thirty times greater than 2D cultured cells (Fig. 8). LD50 for 2D cultured doxorubicin treated PLC and HepG2 corresponded well with previous studies (36,37). The tumor cell clusters that formed exclusively upon culture in CA scaffolds (Fig. 2) reduced the exposure of the cells to therapeutic agents since diffusion of therapeutic agents into the tumor mass is limited by the distance of the core to the supply (12), and may induce drug resistant properties typical to spheroid culture (38). The upregulation of the P-glycoprotein multidrug transporter, strongly linked to doxorubicin resistance (39,40), has been associated with the 3D tumor microenvironment (7,41) and also likely contributed to observed doxorubicin resistance. Additionally, hypoxic conditions at the core of the tumor cluster may trigger cell quiescence, making these cells less susceptible to the action of doxorubicin which interrupts the cell cycle during DNA replication (14,42). This was confirmed by the elevated levels of bFGF and VEGF expression, which have been associated with intercalating agent resistant quiescent tumor phenotypes (13), in CA HCC tumor models. Finally, GPC-3 over-expression, which has been implicated in the increased resistance to topoisomerase II inhibitors such as doxorubicin (43), was displayed by HepG2 cells cultured in CA scaffolds. The greatly increased resistance of 3D CA HCC tumor models to chemotherapy more closely resembles the in vivo levels of resistance, where standard dosing schemes result in peak plasma concentrations of approximately 15 μM doxorubicin minutes after treatment, declining to nearly complete clearance at 48 hours post treatment (35). The CA scaffolds were shown to be capable of stimulating cooperative signaling between cells and the environment that led to the expression of a highly malignant, drug resistant phenotype.
Conclusion
We have developed a 3D in vitro HCC model that features greater angiogenic potential, increased expression of markers for malignancy and migration, rapid transfer into animals, and an increased resistance to chemotherapy in comparison to 2D and Matrigel cultures. Cancer cells exist in a dynamic microenvironment involving interactions with the ECM and soluble factors that is constantly remodeled by cellular interactions. The CA scaffold system is a highly reproducible, versatile model of HCC with direct applications for evaluating tumor behavior and the efficacy of novel anti-cancer therapies.
Acknowledgment
This work is supported in part by NIH grants (R01EB006043 and R01CA134213). Jim Park and Omid Veiseh would like to acknowledge support through the ASA Foundation Fellowship Research Award and an NIH training grant (T32CA138312), respectively. Additionally, we would like to acknowledge the use of the SEM at the Dept of Materials Science and Engineering and Keck Microscopy Imaging Facility at the University of Washington.
References
- 1.Spangenberg HC, Thimme R, Blum HE. Targeted therapy for hepatocellular carcinoma. Nat Rev Gastroenterol Hepatol. 2009;6:423–32. doi: 10.1038/nrgastro.2009.86. [DOI] [PubMed] [Google Scholar]
- 2.Llovet JM, Ricci S, Mazzaferro V, Hilgard P, Gane E, Blanc JF, de Oliveira AC, Santoro A, Raoul JL, Forner A, Schwartz M, Porta C, Zeuzem S, Bolondi L, Greten TF, Galle PR, Seitz JF, Borbath I, Haussinger D, Giannaris T, Shan M, Moscovici M, Voliotis D, Bruix J. Sorafenib in advanced hepatocellular carcinoma. N Engl J Med. 2008;359:378–90. doi: 10.1056/NEJMoa0708857. [DOI] [PubMed] [Google Scholar]
- 3.Frese KK, Tuveson DA. Maximizing mouse cancer models. Nat Rev Cancer. 2007;7:654–8. doi: 10.1038/nrc2192. [DOI] [PubMed] [Google Scholar]
- 4.Wu L, Tang Z-Y, Li Y. Experimental models of hepatocellular carcinoma: developments and evolution. Journal of Cancer Research and Clinical Oncology. 2009;135:969–81. doi: 10.1007/s00432-009-0591-7. [DOI] [PubMed] [Google Scholar]
- 5.Fischbach C, Chen R, Matsumoto T. Engineering Tumors with 3D Scaffolds. Nat Med. 2007;4:855–60. doi: 10.1038/nmeth1085. al. e. [DOI] [PubMed] [Google Scholar]
- 6.Horning JL, Sahoo SK, Vijayaraghavalu S, Dimitrijevic S, Vasir JK, Jain TK, Panda AK, Labhasetwar V. 3-D Tumor Model for In Vitro Evaluation of Anticancer Drugs. Mol Pharm. 2008;5:849–62. doi: 10.1021/mp800047v. [DOI] [PubMed] [Google Scholar]
- 7.Smalley K, Lioni M, Herlyn M. Life isn't Flat: Taking Cancer Biology to the Next Dimension. In Vitro Cell Dev BioL - Animal. 2006;42:242–7. doi: 10.1290/0604027.1. [DOI] [PubMed] [Google Scholar]
- 8.Xu F, Burg K. Three-dimensional polymeric systems for cancer cell studies. Cytotechnology. 2007;54:135–43. doi: 10.1007/s10616-007-9065-4. [DOI] [PMC free article] [PubMed] [Google Scholar]
- 9.Tredan O, Galmarini CM, Patel K, Tannock IF. Drug Resistance and the Solid Tumor Microenvironment. J Natl Cancer Inst Monogr. 2007;99:1441–54. doi: 10.1093/jnci/djm135. [DOI] [PubMed] [Google Scholar]
- 10.Wu XZ, Chen D, Xie GR. Extracellular matrix remodeling in hepatocellular carcinoma: Effects of soil on seed? Med Hypotheses. 2006;66:1115–20. doi: 10.1016/j.mehy.2005.12.043. [DOI] [PubMed] [Google Scholar]
- 11.Desoize B, Jardillier J-C. Multicellular resistance: a paradigm for clinical resistance? Crit Rev Oncol Hematol. 2000;36:193–207. doi: 10.1016/s1040-8428(00)00086-x. [DOI] [PubMed] [Google Scholar]
- 12.Minchinton AI, Tannock IF. Drug penetration in solid tumours. Nat Rev Cancer. 2006;6:583–92. doi: 10.1038/nrc1893. [DOI] [PubMed] [Google Scholar]
- 13.Meads MB, Gatenby RA, Dalton WS. Environment-mediated drug resistance: a major contributor to minimal residual disease. Nat Rev Cancer. 2009;9:665–74. doi: 10.1038/nrc2714. [DOI] [PubMed] [Google Scholar]
- 14.Sermeus A, Cosse JP, Crespin M, Mainfroid V, de Longueville F, Ninane N, Raes M, Remacle J, Michiels C. Hypoxia induces protection against etoposide-induced apoptosis: molecular profiling of changes in gene expression and transcription factor activity. Mol Cancer. 2008;7:27. doi: 10.1186/1476-4598-7-27. [DOI] [PMC free article] [PubMed] [Google Scholar]
- 15.Lund AW, Yener Bl, Stegemann JP, Plopper GE. The Natural and Engineered 3D Microenvironment as a Regulatory Cue During Stem Cell Fate Determination. Tissue Engineering Part B: Reviews. 2009;15:371–80. doi: 10.1089/ten.teb.2009.0270. [DOI] [PMC free article] [PubMed] [Google Scholar]
- 16.Zhang Y, Zhang M. Cell growth and function on calcium phosphate reinforced chitosan scaffolds. J Mater Sci Mater Med. 2004;15:255–60. doi: 10.1023/b:jmsm.0000015485.94665.25. [DOI] [PubMed] [Google Scholar]
- 17.Zhang Y, Zhang MQ. Microstructural and mechanical characterization of chitosan scaffolds reinforced by calcium phosphates. Journal of Non-Crystalline Solids. 2001;282:159–64. [Google Scholar]
- 18.Li Z, Zhang M. Chitosan-alginate as scaffolding material for cartilage tissue engineering. Journal of Biomedical Materials Research Part A. 2005;75A:485–93. doi: 10.1002/jbm.a.30449. [DOI] [PubMed] [Google Scholar]
- 19.Li Z, Ramay HR, Hauch KD, Xiao D, Zhang M. Chitosan-alginate hybrid scaffolds for bone tissue engineering. Biomaterials. 2005;26:3919–28. doi: 10.1016/j.biomaterials.2004.09.062. [DOI] [PubMed] [Google Scholar]
- 20.Li Z, Gunn J, Chen M-H, Cooper A, Zhang M. On-site alginate gelation for enhanced cell proliferation and uniform distribution in porous scaffolds. J Biomed Mater Res Part A. 2008;86A:552–9. doi: 10.1002/jbm.a.31596. [DOI] [PubMed] [Google Scholar]
- 21.Li Z, Leung M, Hopper R, Ellenbogen R, Zhang M. Feeder-free self-renewal of human embryonic stem cells in 3D porous natural polymer scaffolds. Biomaterials. 2010;31:404–12. doi: 10.1016/j.biomaterials.2009.09.070. [DOI] [PubMed] [Google Scholar]
- 22.Chau Y, Padera RF, Dang NM, Langer R. Antitumor efficacy of a novel polymer-peptidedrug conjugate in human tumor xenograft models. Int J Cancer. 2006;118:1519–26. doi: 10.1002/ijc.21495. [DOI] [PubMed] [Google Scholar]
- 23.Waugh DJJ, Wilson C. The Interleukin-8 Pathway in Cancer. Clin Cancer Res. 2008;14:6735–41. doi: 10.1158/1078-0432.CCR-07-4843. [DOI] [PubMed] [Google Scholar]
- 24.Presta M, Dell'Era P, Mitola S, Moroni E, Ronca R, Rusnati M. Fibroblast growth factor/fibroblast growth factor receptor system in angiogenesis. Cytokine Growth Factor Rev. 2005;16:159–78. doi: 10.1016/j.cytogfr.2005.01.004. [DOI] [PubMed] [Google Scholar]
- 25.Kerbel RS. Tumor Angiogenesis. N Engl J Med. 2008;358:2039–49. doi: 10.1056/NEJMra0706596. [DOI] [PMC free article] [PubMed] [Google Scholar]
- 26.Capurro M, Wanless IR, Sherman M, Deboer G, Shi W, Miyoshi E, Filmus J. Glypican-3: a novel serum and histochemical marker for hepatocellular carcinoma. Gastroenterology. 2003;125:89–97. doi: 10.1016/s0016-5085(03)00689-9. [DOI] [PubMed] [Google Scholar]
- 27.Wang XY, Degos F, Dubois S, Tessiore S, Allegretta M, Guttmann RD, Jothy S, Belghiti J, Bedossa P, Paradis V. Glypican-3 expression in hepatocellular tumors: diagnostic value for preneoplastic lesions and hepatocellular carcinomas. Hum Pathol. 2006;37:1435–41. doi: 10.1016/j.humpath.2006.05.016. [DOI] [PubMed] [Google Scholar]
- 28.Nassar A, Cohen C, Siddiqui MT. Utility of glypican-3 and survivin in differentiating hepatocellular carcinoma from benign and preneoplastic hepatic lesions and metastatic carcinomas in liver fine-needle aspiration biopsies. Diagnostic Cytopathology. 2009;37:629–35. doi: 10.1002/dc.21075. [DOI] [PubMed] [Google Scholar]
- 29.Hodgson E. A Textbook of Modern Toxicology. 3rd ed Wiley-Interscience; 2004. [Google Scholar]
- 30.Lin R-Z, Chang H-Y. Recent advances in three-dimensional multicellular spheroid culture for biomedical research. Biotechnol J. 2008;3:1172–84. doi: 10.1002/biot.200700228. [DOI] [PubMed] [Google Scholar]
- 31.Shirakawa H, Suzuki H, Shimomura M, Kojima M, Gotohda N, Takahashi S, Nakagohri T, Konishi M, Kobayashi N, Kinoshita T, Nakatsura T. Glypican-3 expression is correlated with poor prognosis in hepatocellular carcinoma. Cancer Sci. 2009;100:1403–7. doi: 10.1111/j.1349-7006.2009.01206.x. [DOI] [PMC free article] [PubMed] [Google Scholar]
- 32.Lai J-P, Sandhu DS, Yu C, Han T, Moser CD, Jackson KK, Guerrero RB, Aderca I, Isomoto H, Garrity-Park MM, Zou H, Shire AM, Nagorney DM, Sanderson SO, Adjei AA, Lee J-S, Thorgeirsson SS, Roberts LR. Sulfatase 2 up-regulates glypican 3, promotes fibroblast growth factor signaling, and decreases survival in hepatocellular carcinoma. Hepatology. 2008;47:1211–22. doi: 10.1002/hep.22202. [DOI] [PMC free article] [PubMed] [Google Scholar]
- 33.Nagy JA, Chang SH, Dvorak AM, Dvorak HF. Why are tumour blood vessels abnormal and why is it important to know? Br J Cancer. 2009;100:865–9. doi: 10.1038/sj.bjc.6604929. [DOI] [PMC free article] [PubMed] [Google Scholar]
- 34.Sangro B. Refined tools for the treatment of hepatocellular carcinoma. J Hepatol. 2005;42:629–31. doi: 10.1016/j.jhep.2005.02.006. [DOI] [PubMed] [Google Scholar]
- 35.Varela M, Real MI, Burrel M, Forner A, Sala M, Brunet M, Ayuso C, Castells L, Montañá X, Llovet JM, Bruix J. Chemoembolization of hepatocellular carcinoma with drug eluting beads: Efficacy and doxorubicin pharmacokinetics. J Hepatol. 2007;46:474–81. doi: 10.1016/j.jhep.2006.10.020. [DOI] [PubMed] [Google Scholar]
- 36.Chuu J-J, Liu J, Tsou M-H, Huang C-L, Chen C-P, Wang H-S, Chen C-T. Effects of paclitaxel and doxorubicin in histocultures of hepatocellular carcinomas. J Biomed Sci. 2007;14:233–44. doi: 10.1007/s11373-006-9141-3. [DOI] [PubMed] [Google Scholar]
- 37.Schoonen WGEJ, de Roos JADM, Westerink WMA, Débiton E. Cytotoxic effects of 110 reference compounds on HepG2 cells and for 60 compounds on HeLa, ECC-1 and CHO cells.: II Mechanistic assays on NAD(P)H, ATP and DNA contents. Toxicol In Vitro. 2005;19:491–503. doi: 10.1016/j.tiv.2005.01.002. [DOI] [PubMed] [Google Scholar]
- 38.Hirschhaeuser F, Menne H, Dittfeld C, West J, Mueller-Klieser W, Kunz-Schughart LA. Multicellular tumor spheroids: An underestimated tool is catching up again. Journal of Biotechnology. 2010 doi: 10.1016/j.jbiotec.2010.01.012. In Press, Corrected Proof. [DOI] [PubMed] [Google Scholar]
- 39.Hennessy M, Spiers JP. A primer on the mechanics of P-glycoprotein the multidrug transporter. Pharmacological Research. 2007;55:1–15. doi: 10.1016/j.phrs.2006.10.007. [DOI] [PubMed] [Google Scholar]
- 40.Patel K, Tannock I. The influence of P-glycoprotein expression and its inhibitors on the distribution of doxorubicin in breast tumors. 2009. p. 356. [DOI] [PMC free article] [PubMed]
- 41.Baguley BC. Multidrug Resistance in Cancer. Methods in Molecular Biology. 2010;596:1–14. doi: 10.1007/978-1-60761-416-6_1. [DOI] [PubMed] [Google Scholar]
- 42.Jurisicova A, Lee HJ, D'Estaing SG, Tilly J, Perez GI. Molecular requirements for doxorubicin-mediated death in murine oocytes. Cell Death Differ. 2006;13:1466–74. doi: 10.1038/sj.cdd.4401819. [DOI] [PubMed] [Google Scholar]
- 43.Wichert A, Stege A, Midorikawa Y, Holm PS, Lage H. Glypican-3 is involved in cellular protection against mitoxantrone in gastric carcinoma cells. Oncogene. 2003;23:945–55. doi: 10.1038/sj.onc.1207237. [DOI] [PubMed] [Google Scholar]


