Abstract
Two-dimensional paper networks (2DPNs) hold great potential for extending the utility of paper-based chemical and biochemical diagnostics at a cost and ease-of-use that is comparable to conventional lateral flow strips. 2DPNs enable the automated sequential delivery of multiple reagents to a detection region with a single user activation step, and therefore have the potential to extend the processing capabilities of inexpensive paper-based assays with comparable ease of use to conventional lateral flow tests. In this communication, we used a simple 3 inlet 2DPN to perform signal amplification of a colloidal gold label using a gold enhancement solution, thus demonstrating the capability of 2DPNs to perform processes that can improve limits of detection.
Keywords: two-dimensional paper networks, paper-based assays, signal amplification, gold enhancement of gold nanoparticles
1.1 Introduction
Lateral flow strip tests have been developed for many applications ranging from home testing for pregnancy and drugs of abuse, to disease detection in low resource settings. The main advantages of these strips are their low cost, their use of reagents stored in dry form, they produce a visible signal that is readable by eye, and they do not require additional instrumentation (in their simplest form). However, conventional lateral flow strip tests often only measure a single analyte per strip, and for many targets lack the sensitivity required for clinical utility. Much of the recent work in paper-based devices [1, 2] has been to extend the capabilities of conventional lateral flow strips to detect multiple analytes using two-dimensional patterns in paper to link a single inlet with multiple detection regions [3–6]. The power and applicability of such simple analytical devices would be greatly enhanced if limits of detection were improved.
Previous work to improve limits of detection in lateral flow strips has involved employing particle labels that require additional instrumentation and cost [7, 8]. Chemical amplification has long been used to improve limits of detection in laboratory-based bioassays, most notably, in ELISA. The utility of paper-based tests could be greatly extended by enabling sophisticated processes, such as chemical amplification, using paper networks that do not require additional instrumentation and are of comparable cost to conventional lateral flow strips.
We recently described a series of tools to control reagent transport in 2DPNs and demonstrated sequential delivery of multiple fluids to a detection region using networks consisting of multiple inlets per outlet [9]. In this communication, we demonstrate the next step; the capability of 2DPNs to perform processes that could improve limits of detection in paper-based assays. Specifically, we used a simple 3 inlet 2DPN to perform signal generation and chemical amplification of that signal using a single user activation step.
2.1 Materials and Methods
The 2DPNs were composed of conventional backed nitrocellulose membranes (Millipore Hi-Flow Plus 135, Billerica, MA) cut using a CO2 laser [10] (Universal Laser Systems, Scottsdale, AZ). The main leg of the 2DPN was ~3 mm wide and ~25 mm long, and each inlet was ~3 mm wide. Reagents were introduced to polyester source pads (Ahlstrom, Helsinki, Finland) in contact with the device inlets. The polyester material was pretreated with a solution composed of 0.25% Brij®, 0.5% BSA, and 100 mM Tris, adjusted to a pH of 8.2. The material was then dried for 2 hours at 37°C and stored in a dessicator. The rounds were created using mechanical punches. Untreated cellulose, cut using the CO2 laser, was used for wicking pads (Millipore Billerica, MA, Whatman, Maidstone, Kent). The nitrocellulose and pads were adhered to a glass substrate (Thermo Fisher Scientific, Waltham, MA) using double-sided tape (3M, St. Paul, MN).
For the experiments visualizing transport in the 3 inlet 2DPN, food coloring (containing FD&C Red #40 and/or Yellow #5) in water was used as the fluid. In the demonstration, 4 µl of orange fluid, 8 µl of yellow fluid, and 18 µl of red fluid were added to the source pads at the inlets, from right to left, respectively, in a single-step dispense using a multi-channel pipette (i.e. single activation step).
For the demonstration of signal amplification, a model system was used. A small volume (~0.5 µl) of 0.5 mg/ml bovine serum albumin that had been covalently modified by multiple biotins (BSA-biotin, Arista Biologicals, Allentown, PA) was hand-spotted onto the paper and allowed to dry for approximately 30 min. The 2DPN was then soaked for 1 hour at room temperature in a 1% BSA blocking solution (Thermo Scientific, Waltham, MA) containing 0.05% Tween-20, to prevent nonspecific adsorption of the species of interest. The 2DPN was then dried at 37°C for 2 hours and stored in a dessicator. Reagents were introduced to the source pads at the 3 inlets of the device in a single activation step using a multi-channel pipette. Approximately 4 µl of a solution of 40 nm diameter gold colloidal particles to which streptavidin had been conjugated (SA-gold of OD540=10, Arista Biologicals, Allentown, PA, diluted 1:1 in phosphate buffered saline) was applied to the source pad at the inlet closest to the detection region. Approximately 8 µl of phosphate buffered saline (PBS) was applied to the source pad at the middle inlet. Approximately 18 µl of GoldEnhance LM gold enhancement solution (Nanoprobes, Yaphank, NY) was applied to the source pad at the inlet farthest from the detection region. The larger volume of gold enhancement solution (relative to the volumes of SA-gold and PBS) was chosen to provide flow of gold enhancement reagent to the detection region during a significant portion of the development process. The effects of evaporation were minimized by enclosing the “loaded” devices in a covered dish containing a water source.
Images were acquired with a web camera (Logitech, Fremont, CA) and ImageJ [11] was used to obtain average grayscale intensity measurements in 100 pixel regions of interest; (1) within the capture region (i.e. visibly darkened spot in the detection region) and (2) a reference region upstream of the capture region for each time point. The raw intensity in each of the regions was normalized with a universal value obtained by time averaging the spatially averaged grayscale values in the reference region during a period of PBS flow through the reference region (11 frames from 120 to 130 s). Specifically, normalized intensity was calculated by subtracting raw intensity from the universal normalization value [12]. The average normalized original signal, IOS, was calculated from a time average of the normalized intensity in the capture region during buffer flow over the original signal (11 images from 120 to 130 s). The average normalized amplified signal, IAS, was calculated from a time average of the normalized intensity in the capture region during a time when the amplified signal had leveled off (5 images from ~20 to 22 min). The average normalized background intensity, IOB or IAB, corresponding to the original signal or amplified signal, respectively, was calculated from the reference region using the same image series as described previously. The signal amplification ratio was defined as . Image contrast and brightness have been adjusted for display purposes in Figures 1 and 3.
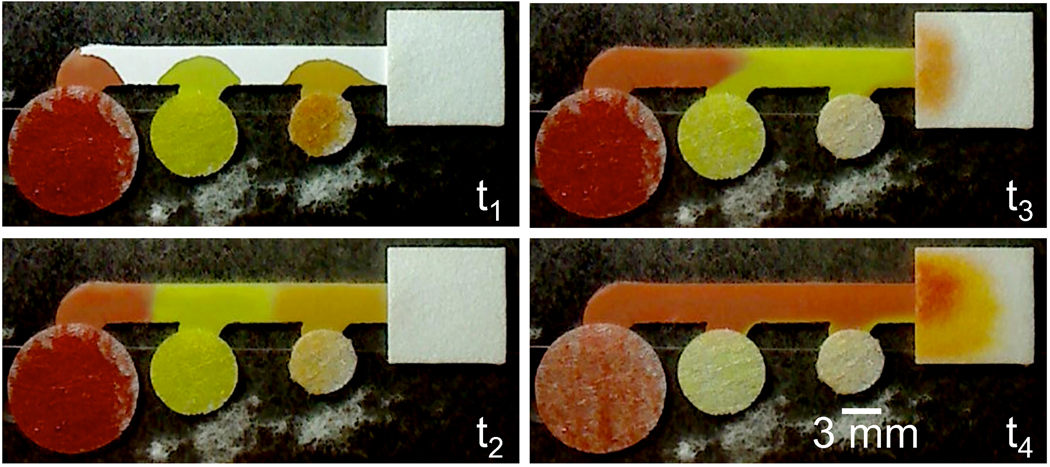
Figure 1.
Sequential delivery of fluids in a 3-inlet 2DPN using source pads of different fluid capacities. The 3 colored fluids initially flowed into the common segment of the device, where they were staged for sequential delivery. The orange fluid reached the wicking pad first, next the yellow fluid, and finally the red fluid. The images correspond to the approximate times of 2 s, 10 s, 70 s, and 6 min, for t1 through t4, respectively.
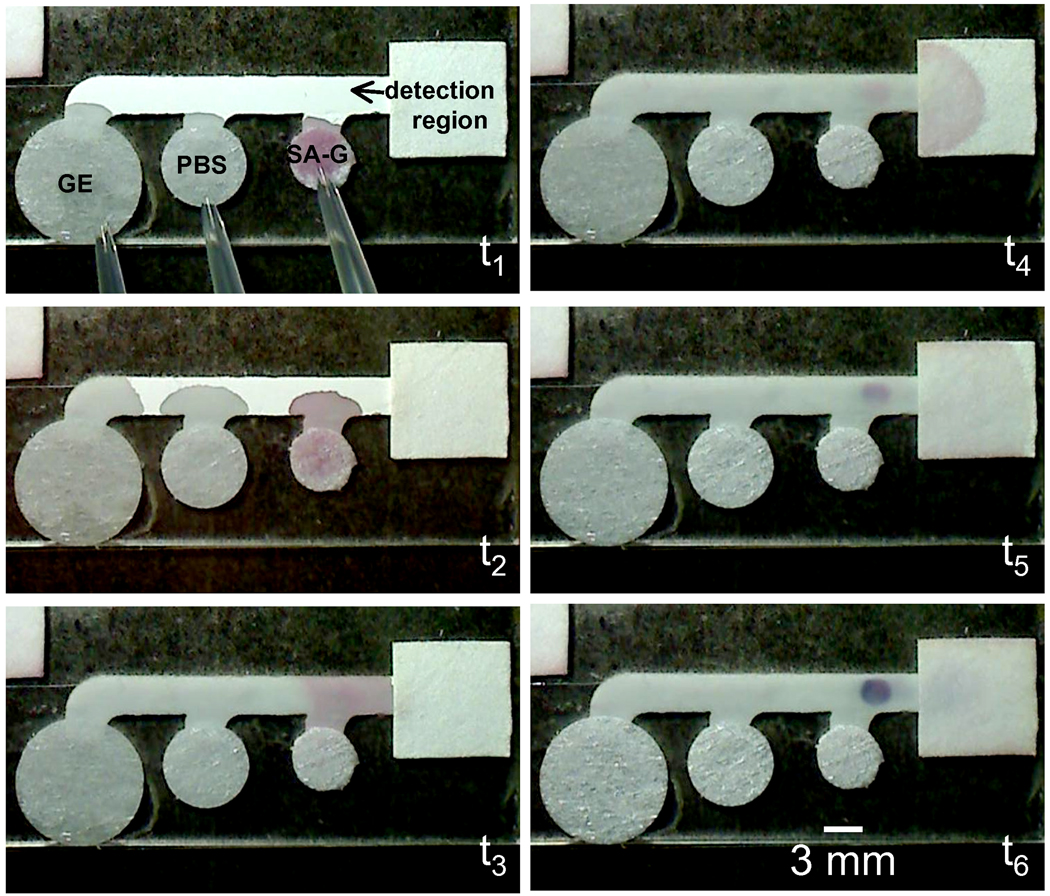
Figure 3.
Demonstration of signal amplification using a simple 3 inlet 2DPN. A spot of BSA-biotin was located upstream of the wicking pad and reagents were applied approximately simultaneously to the source pads using a multi-channel pipette in a single activation step. The images correspond to the approximate times of 1 s, 5 s, 25 s, 2 min, 5.5 min, and 20 min for t1 through t6, respectively. Streptavidin labeled gold (SA-G) reached the capture spot first, next a phosphate buffered saline (PBS) wash, and finally a gold enhancement (GE) solution. Note that the capture spot to the left of the wicking pad becomes substantially darker by t6.
3.1 Results and Discussion
The inlets of the 2DPN were configured such that the distance between each of the inlets and the detection region of the device, located immediately upstream of the wicking pad, increased for the inlets from right to left, respectively. Thus, fluids introduced to the inlets simultaneously, will arrive at the detection region at different times. The sequential delivery of dyed fluids in a 3 inlet 2DPN (similar in design to one presented in our previous report [9], but with improved reagent release properties) is shown in the experiment of Figure 1. Each of the dyed fluids, orange, yellow, and red, flowed into the common segment of the device where they were staged for delivery to the detection region. The staged fluids were then transported by wicking within the common segment of the device and delivered in sequence to the detection region. The images of Figure 1 were taken at the approximate times of 2 s, 10 s, 70 s, and 6 min after the introduction of fluids to the source pads. In the 3-inlet device design presented here, the amount of overlap in the delivery times of the different fluids, as well as the timescale for delivery of the fluids, depends predominantly on the distances between inlets along the common segment of the device, and the fluid release properties of the source pad.
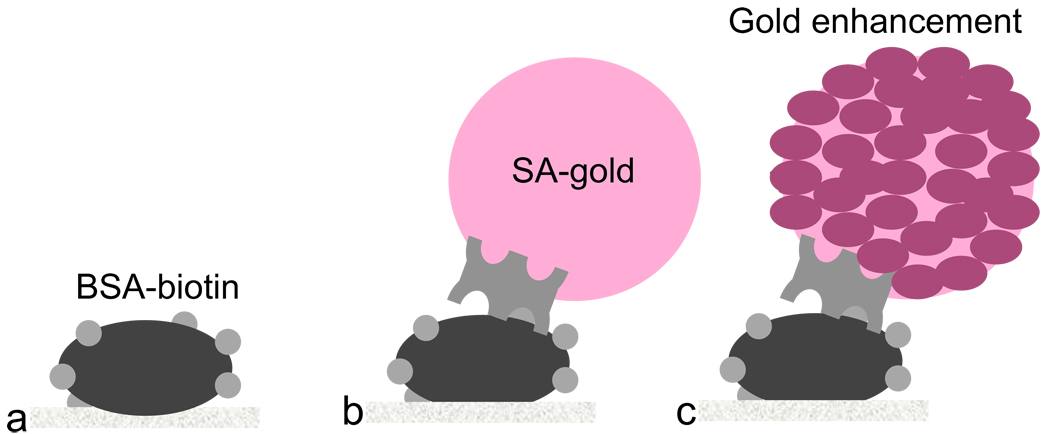
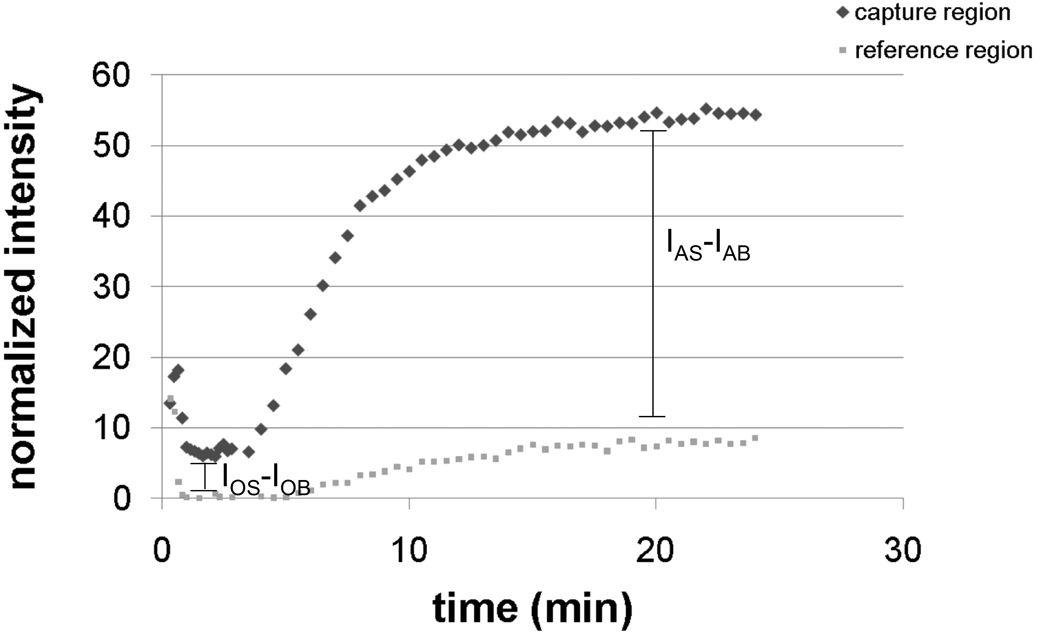
A 2DPN of the same design was used to demonstrate signal generation and chemical amplification of that original signal using a single user acivation step. We chose a model system for this demonstration that would produce a visible signal at both the orginal signal generation stage and the signal amplification stage, gold enhancement of gold nanoparticle labels [13, 14]. The gold enhancement chemistry has been reported to have utility in a different format [15] with low background due to minimal autonucleation for 1 to 2 hours [16], much longer than the timescale of the complete process in the 2DPN demonstrated here. The schematic of Figure 2 shows the model system. The target species was BSA-biotin adsorbed to the paper in a capture spot of the detection region, the original signal was generated by SA-gold that bound to the BSA-biotin, and the amplified signal was generated after the application of the gold enhancement solution, which darkened the capture spot by depositing additional gold onto the pre-existing gold nanoparticles. The reagents, SA-gold, phosphate buffered saline, and a gold enhancement solution were added in a single activation step to the source pads at the inlets of the device as shown in the image taken at t1 in Figure 3. The series of images in Figure 3 were taken at approximately 1 s, 5 s, 25 s, 2 min, 5.5 min, and 20 min after addition of the wet reagents. The plot of Figure 4 shows normalized grayscale intensity measurements from the capture and reference regions versus time. The data in the plot indicate an original signal of ~6.4 counts above background due to the capture of SA-gold on the surface. The gold enhancement solution then produced an amplified signal of ~46 counts above background. The signal amplification ratio in this case is ~7.3. Replicate measurements (n=3) resulted in an average signal amplification ratio of 5.9 ± 1.8. Potential ways to further improve the signal amplification ratio are to optimize the overall [15] and relative concentrations of the gold salt and reducer in the gold enhancement solution, and modify the size of the original gold particle labels. In addition, 2DPNs could also be used to implement other signal amplifcation chemistries, including silver enhancement of gold nanoparticles [17, 18] and the enzymatic system of horseradish peroxidase/tetramethlybenzidine [19], that have reported utility in other formats.
Figure 2.
Schematic of the model system used in this demonstration of signal generation and amplification in a 2DPN. (a) BSA-biotin was the target in the capture spot of the detection region. (b) SA-gold bound to the BSA-biotin formed the original signal. (c) Gold enhancement solution, by increasing the size of the pre-existing gold nanoparticles, produced the amplified signal.
Figure 4.
The plot shows the normalized grayscale intensity in the capture and reference regions as a function of time. As described in the main text, the signal amplification ratio is ~7.3. Replicate measurements (n=3) resulted in an average signal amplification ratio of 5.9 ± 1.8. Conventional lateral flow strips are not capable of multi-step sequences such as signal amplification for improved limits of detection.
Conventional lateral flow strips are not capable of performing the multi-step sequence for chemical signal amplification demonstrated here in a 2DPN. The Chembio Dual Path Platform® extends the capabilities of conventional strip tests through the use of two intersecting strips to incorporate a single wash step (that also requires an additional user step) after the binding of label in the detection region and claims increased sensitivity [20]. 2DPNs, as described and demonstrated here, have the potential to go much further by implementation of multi -step processes, while still only requiring a single user activation step. Processes that require additional steps, over the 3 required for the demonstration in this communication, could be implemented by modifying the 2DPN shown here to include (1) additional inlets located at the appropriate locations upstream of the detection region and (2) appropriate size source pads at the inlets to accept and release the desired volumes of fluids to be staged in the common segment of the device for sequential delivery to the detection region. Additional control parameters that can be used within a network are to (1) vary the length/width of an inlet leg as compared to the other inlet legs or (2) incorporate a dissolvable barrier in an inlet leg, in order to modify the time of fluid transport from that inlet to the detection region as compared to the times of transport for the other inlet legs [9].
4.1 Conclusion
We have described and demonstrated a method for implementing the multi-sequence processes required for signal generation and amplification in a 2DPN with only a single user activation step. We used a simple 3 inlet 2DPN to perform amplification of the signal due to a colloidal gold labeled capture species using gold enhancement solution, and thus demonstrated the capability of 2DPNs to perform processes that can improve limits of detection. The methods described and demonstrated here could be used to implement a multitude of other multi-step sample processes in 2DPNs for increased paper-based assay capabilities and performance.
Acknowledgments
We thank Stephen A. Ramsey for helpful discussions, and Dean Stevens and Paolo Spicar-Mihalic for advice and assistance with reagents. We gratefully acknowledge the support of NIH Grant No. 1RC1EB010593.
Biographies
Elain Fu is a senior research scientist in the Department of Bioengineering at the University of Washington. She holds a ScB in physics from Brown University and a PhD in experimental surface physics from the University of Maryland, College Park. Her research interests include microfluidics, optical biosensors, and the development of point-of-care diagnostics for low resource settings.
Peter Kauffman is a research scientist in the Department of Bioengineering at the University of Washington. He has over 30 years experience in research and in the design of scientific instruments and sensors for physical and chemical oceanography, geophysics, and medical diagnostics.
Barry Lutz is an Assistant Research Professor in the Department of Bioengineering at the University of Washington. He holds a B.S. in chemical engineering from the University of Texas, Austin and a PhD in chemical engineering from the University of Washington. He was a postdoctoral fellow at the Microscale Life Sciences Center working on microfluidics for single cell analysis and then a senior research scientist at Intel Biomedical Life Sciences working on multiplexed optical probes for tissue-based protein detection. His research interests include the chemical transport and kinetics of biosensors, sound-based microfluidic systems, single-cell manipulation, multiplex optical detection, and point-of-care diagnostics.
Paul Yager received his AB in biochemistry from Princeton in 1975, and a PhD in chemistry from the University of Oregon in 1980. He specialized in vibrational spectroscopy of biomolecules. He was an NRC Research Associate at the Naval Research Laboratory in Washington, DC from 1980 to 1982, joining the NRL staff in 1982. At NRL he focused on lipid microstructures and the development of biosensor technologies. He joined the Department of Bioengineering at the University of Washington in Seattle in 1987 as Associate Professor. Initial projects included work on biosensors, the structure of silk, and use of lipid microstructures for controlled release of pharmaceuticals. He was promoted to Professor in 1995, became Vice Chair in 2001, and Chair in 2007. Since 1992, he has focused on development of microfluidic devices for the manipulation of biological fluids and the monitoring of medically significant analytes. The primary goal of current work in his laboratory is decentralization of biomedical diagnostic testing in the developed and developing worlds. Specifics can be found at http://faculty.washington.edu/yagerp/.
Footnotes
Publisher's Disclaimer: This is a PDF file of an unedited manuscript that has been accepted for publication. As a service to our customers we are providing this early version of the manuscript. The manuscript will undergo copyediting, typesetting, and review of the resulting proof before it is published in its final citable form. Please note that during the production process errors may be discovered which could affect the content, and all legal disclaimers that apply to the journal pertain.
References
- 1.Martinez AW, et al. Diagnostics for the Developing World: Microfluidic Paper-Based Analytical Devices. Analytical Chemistry. 2010;82(1):3–10. doi: 10.1021/ac9013989. [DOI] [PubMed] [Google Scholar]
- 2.Zhao WA, van den Berg A. Lab on paper. Lab on a Chip. 2008;8(12):1988–1991. doi: 10.1039/b814043j. [DOI] [PubMed] [Google Scholar]
- 3.Fenton E, et al. Multiplex lateral-flow test strips fabricated by two-dimensional shaping. Applied Materials and Interfaces. 2009;1(1):124–129. doi: 10.1021/am800043z. [DOI] [PubMed] [Google Scholar]
- 4.Martinez AW, et al. Patterned paper as a platform for inexpensive, low-volume, portable bioassays. Angewandte Chemie-International Edition. 2007;46(8):1318–1320. doi: 10.1002/anie.200603817. [DOI] [PMC free article] [PubMed] [Google Scholar]
- 5.Martinez AW, Phillips ST, Whitesides GM. Three-dimensional microfluidic devices fabricated in layered paper and tape. Proceedings of the National Academy of Sciences of the United States of America. 2008;105(50):19606–19611. doi: 10.1073/pnas.0810903105. [DOI] [PMC free article] [PubMed] [Google Scholar]
- 6.Martinez AW, et al. FLASH: A rapid method for prototyping paper-based microfluidic devices. Lab on a Chip. 2008;8(12):2146–2150. doi: 10.1039/b811135a. [DOI] [PMC free article] [PubMed] [Google Scholar]
- 7.Chun P. Colloidal gold and other labels for lateral flow immunoassays. In: Wong R, Tse H, editors. Lateral Flow Immunoassay. New York: Humana Press; 2009. pp. 75–94. [Google Scholar]
- 8.Faulstich K, et al. Handheld and portable reader devices for lateral flow immunoassays. In: Wong R, Tse H, editors. Lateral Flow Immunoassay. New York: Humana Press; 2009. pp. 75–94. [Google Scholar]
- 9.Fu E, et al. Controlled reagent transport in disposable 2D paper networks. Lab on a Chip. 2010;10:918–920. doi: 10.1039/b919614e. [DOI] [PMC free article] [PubMed] [Google Scholar]
- 10.Spicar-Mihalic P, Stevens D, Yager P. MicroTAS Proceedings. 2007. [Google Scholar]
- 11.Rasband WS. Bethesda, Maryland, USA: U. S. National Institutes of Health; ImageJ. 1997–2010 http://rsb.info.nih.gov/ij/
- 12.Stevens DY, et al. Enabling a microfluidic immunoassay for the developing world by integration of on-card dry-reagent storage. Lab on a Chip. 2008;8:2038–2045. doi: 10.1039/b811158h. [DOI] [PubMed] [Google Scholar]
- 13.Brown K, Natan M. Hydroxylamine seeding of colloidal Au nanoparticles in solution and on surfaces. Langmuir. 1998;14:726–728. [Google Scholar]
- 14.Hainfeld JF, et al. Gold-based autometallography; Proceedings of the fifty-seventh Annual Meeting, Microscopy Society of America; Springer-Verlag: 1999. [Google Scholar]
- 15.Lei KF, Butt Y. Colorimetric immunoassay chip based on gold nanoparticles and gold enhancement. Microfluidics and Nanofluidics. 2010;8(1):131–137. [Google Scholar]
- 16. http://www.nanoprobes.com/tech_help/TechGE.html.
- 17.Yan J, et al. A Gold Nanoparticle-Based Microfluidic Protein Chip for Tumor Markers. Journal of Nanoscience and Nanotechnology. 2009;9(2):1194–1197. doi: 10.1166/jnn.2009.c118. [DOI] [PubMed] [Google Scholar]
- 18.Yeh CH, et al. An immunoassay using antibody-gold nanoparticle conjugate, silver enhancement and flatbed scanner. Microfluidics and Nanofluidics. 2009;6(1):85–91. [Google Scholar]
- 19.Kolosova AY, et al. Investigation of several parameters influencing signal generation in flow-through membrane-based enzyme immunoassay. Analytical and Bioanalytical Chemistry. 2007;387(3):1095–1104. doi: 10.1007/s00216-006-0991-3. [DOI] [PubMed] [Google Scholar]
- 20. http://www.chembio.com/newtechnologies.html.


