Abstract
Methodological differences in sound-induced stapes velocity (Vs) measurements in live and cadaveric ears were examined using fresh cadaveric temporal bones. On average, differences in preparation (sectioning the stapedius tendon, removing the facial nerve, and widely opening the facial recess) had statistically insignificant effects on measured Vs. Differences in the achievable measurement angle (with respect to the axis of piston-like stapes motion) had a significant effect on measured Vs below 2 kHz. These results suggest that much if not all of the differences in Vs measurements between live and cadaveric ears can be explained by the differences in measurement angle between the two preparations. Measurement angle was found to have minimal effect on measured Vs above 2 kHz. This demonstrates that the commonly used method of estimating stapes translational velocity by dividing the measured velocity by the cosine of the measurement angle is not valid above 2 kHz.
Keywords: Human middle ear, Temporal bone studies, Middle-ear function in live ears, Stapes velocity
Introduction
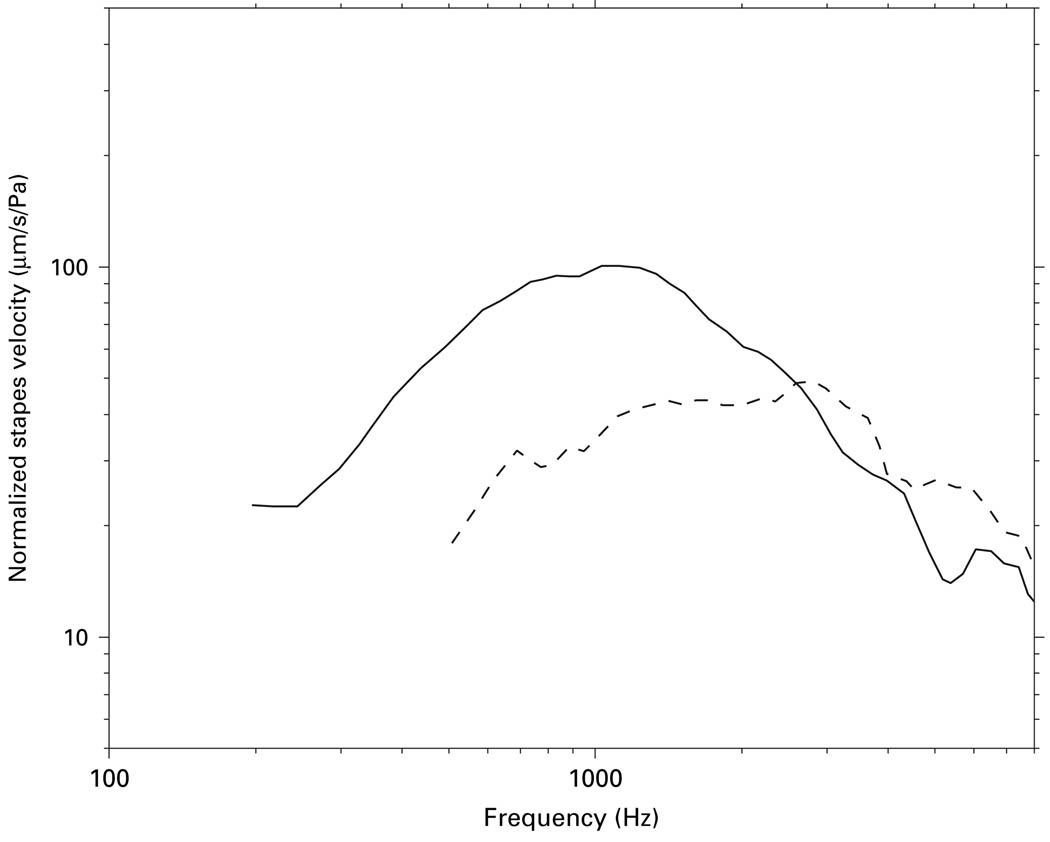
Fresh cadaveric temporal bones have been used extensively as a model for studying human middle-ear mechanics. In support of this use, measures of middle-ear input, e.g., umbo velocity and middle-ear input immittance, have been found by several groups to be statistically similar between live and cadaveric ears [Rosowski et al., 1990, 2004; Goode et al., 1993, 1996]. However, in the single extant study of middle-ear output in 7 live human patients [Huber et al., 2001], the mean sound-induced stapes velocity (Vs) magnitude was significantly lower below ~2 kHz, by a factor of 2–3 (~5–10 dB), compared to Vs measurements in cadaveric ears by the same author (fig. 1). The significance of this finding and its implications for the use of cadaveric temporal bones to study middle-ear mechanics have been a topic of recent debate [Ruggero and Temchin, 2003; Rosowski et al., 2004]. It has been suggested that the differences between live and cadaveric Vs measurements might be explained by post-mortem changes, such as loss of middle-ear muscle tone, or by alterations in cochlear input impedance [Rosowski et al., 2004]. Another possible explanation for the difference between Vs measured in live and cadaveric ears is the methodological differences between the two preparations.
Fig. 1.
Mean Vs magnitude in live (dashed line) and cadaveric (solid line) ears as reported by Huber et al. [2001] and Asai et al. [1999], respectively. Data were originally presented as peak-to-peak stapes displacements; stapes velocities relative to stimulus sound pressure were computed by taking the derivatives of the displacements, converting them to RMS values, and then normalizing by the RMS sound stimulus level.
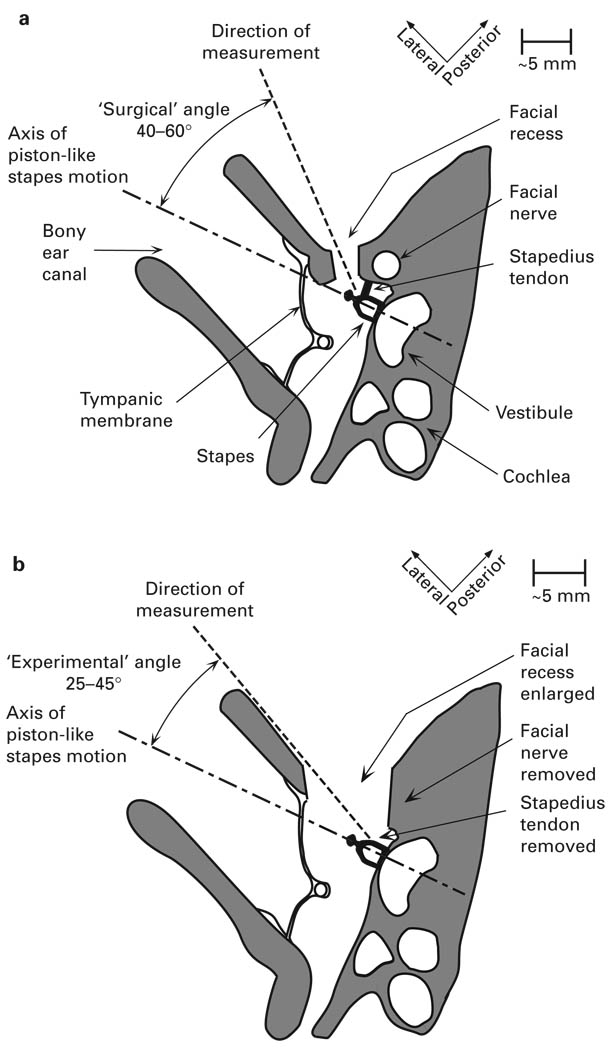
The method of dissection used to view the middle ear for Vs measurements differs between live and cadaveric ears. In live ears, the stapedius tendon and the facial nerve are preserved; therefore, the opening of the facial recess is kept small to avoid violating these structures. Consequently, the view of the stapes and the directions from which Vs can be measured are limited. In cadaveric temporal bones (1) the stapedius tendon is removed to expose the posterior crus of the stapes, and (2) the mastoid segment of the facial nerve is removed and the facial recess is widely enlarged to provide better visualization of the stapes. This larger opening of the facial recess in the experimental preparation of cadaveric temporal bones not only allows for greater exposure of the stapes but also enables Vs to be measured from a direction much closer to the axis of piston-like stapes motion, whereas such a direction of measurement is not possible with the smaller opening of the facial recess in live ears.
In the present study, the methodological differences in measurements of Vs between live and cadaveric ears were examined by using fresh cadaveric temporal bones to mimic the preparation methods used in live and cadaveric ears.
Methods
Temporal Bone Preparation
Twelve fresh cadaveric temporal bones obtained from donors with ages of 46–83 years were used. All donors had no evidence of otologic disease, and the specimens were removed within 24 h after death. The temporal bones were removed from the cranium with a circular saw following the procedures described by Schuknecht [1968], and were stored in normal saline at 5°C between measurements.
Measurement Setup
Sound-induced complex Vs (magnitude and phase) was measured using a laser-Doppler vibrometer (Model No. HLV-1000; Polytec Inc., Tustin, Calif., USA). A small reflective tape (with dimensions of ~0.25 by 0.25 mm) was usually placed on the posterior crus of the stapes during Vs measurements to increase the signal strength of the reflected laser light. In cases where the natural reflection on the stapes was strong enough, the Vs measurements were made directly without a reflective tape. A logarithmic chirp stimulus (containing harmonic frequency components of 48 Hz to 12.5 kHz with a frequency−1/2 pre-emphasis) was presented to an earphone (Model No. ER-4 or ER-6, Etymotic Research, Inc., Elk Grove Village, Ill., USA) coupled to the residual ear canal using a standard otologic speculum. Ear-canal sound pressure (Pec) was measured with a probe tube microphone (Model No. ER-7A, Ety-motic Research), with the probe tip placed within 5 mm of the center of the tympanic membrane. All Vs measurements presented in this paper are normalized by Pec.
The Vs and Pec measurements were gathered using SysId software (SysId Industries, Richmond, Calif., USA). Post-measurement analysis of the Vs and Pec data (including magnitude and phase) was done using MATLAB software (The MathWorks, Inc., Natick, Mass., USA).
Measurement Conditions
Measurements of Vs were made in 3 stages:
‘Surgical’ approach (fig. 2a). A posterior tympanotomy was performed to expose the stapes with preservation of the stapedius tendon and the mastoid segment of the facial nerve. Baseline measurements of Vs were made. This approach simulates measurements of Vs in live ears.
Modifications of ‘surgical’ approach to convert to the ‘experimental’ approach. After the ‘surgical’ preparation and baseline Vs measurements, the stapedius tendon was cut using either Bellucci micro-scissors or an argon laser (Model No. E-005, HGM Medical Laser Systems, Inc., Salt Lake City, Utah., USA). The Vs was re-measured from the same direction as in section 1 above to assess the effect of cutting the stapedius tendon. The facial recess was widely opened by removing the mastoid segment of the facial nerve. Any mucosal folds encountered during the dissection were carefully removed with micro-scissors or argon laser. The Vs was measured again to assess the effect of removing the facial nerve, widely opening the facial recess, and removing the mucosal folds.
‘Experimental’ approach with ‘experimental’ angle (fig. 2b). The measurement angle was varied between the steepest angle permitted by the ‘surgical’ approach (‘surgical’ angle: 40–60° with respect to the axis of piston-like stapes motion) and the steepest angle permitted by the ‘experimental’ approach (‘experimental’ angle: 25–45° with respect to the axis of piston-like stapes motion). Vs was measured to assess the effect of changing measurement angles.
Fig. 2.
a Schematic of a section through a temporal bone illustrating the ‘surgical’ approach and the ‘surgical’ measurement angle. b Schematic of a section through a temporal bone illustrating the ‘experimental’ approach and the ‘experimental’ angle. In the ‘experimental’ approach, the stapedius tendon and the mastoid segment of the facial nerve were removed, and the facial recess was widely opened.
The measurement angles were assessed by first orienting the temporal bone specimen so that the stapes footplate was in the horizontal plane. The angles relative to the horizontal plane were then measured using a protractor. In this paper, measurement angles are expressed relative to the axis of piston-like stapes motion, which is assumed to be perpendicular to the plane of the stapes footplate. Thus, there were two independent sources of error in angle estimation: (1) the alignment of the footplate with the horizontal plane, and (2) the estimation of angle from the horizontal plane. We estimated the errors in these procedures by comparing angle measurements made independently by two observers (W.C. and M.E.R.). Differences in angle estimation from the horizontal plane between the two observers were generally less the 5°; however, differences in aligning the footplate horizontal could be as large as 10°. The accuracy of our angle estimates is discussed in more detail in the Results section.
The posterior crus of the stapes was chosen as the location for velocity measurement because we could consistently visualize the posterior crus in both the ‘surgical’ and the ‘experimental’ approaches. The full extent of the stapes footplate was rarely seen in the ‘surgical’ approach due to the small facial recess opening, and thus the footplate was not chosen as the location for velocity measurements. All Vs measurements in the present study were repeated at least once to verify the stability and reliability of the experimental findings. The test-retest repeatability was within 1 dB in magnitude. Also, measurements of the effect of varying experimental angle generally consisted of two series in which angle was varied from large to small and then back again. Differences in the repeated velocity measurements at various angle locations were generally smaller than 1 dB. (Examples of such repetitions are illustrated in the results.)
The mastoid cavity was left open to the atmosphere during all measurements. The temporal bones were periodically moistened by soaking in normal saline to minimize the effects of drying [Merchant et al., 1996; Nakajima et al., 2005]. To confirm the integrity of the inner ear in these cadaveric temporal bones (i.e., that the inner ear was completely fluid filled), sound-induced round window velocity (Vrw) was also measured. Only temporal bones exhibiting a half-cycle phase difference between Vrw and Vs below ~1 kHz were used [Mehta et al., 2003]. Estimates of measurement noise and artifact were also determined [Ravicz et al., 2004]. Data contaminated by noise and artifact were omitted. The high-frequency limit of each measurement was set at the frequency where the distance between the probe tip and the tympanic membrane was greater than 0.1 times the wavelength.
Results
Vs Measured Using ‘Surgical’ and ‘Experimental’ Approaches
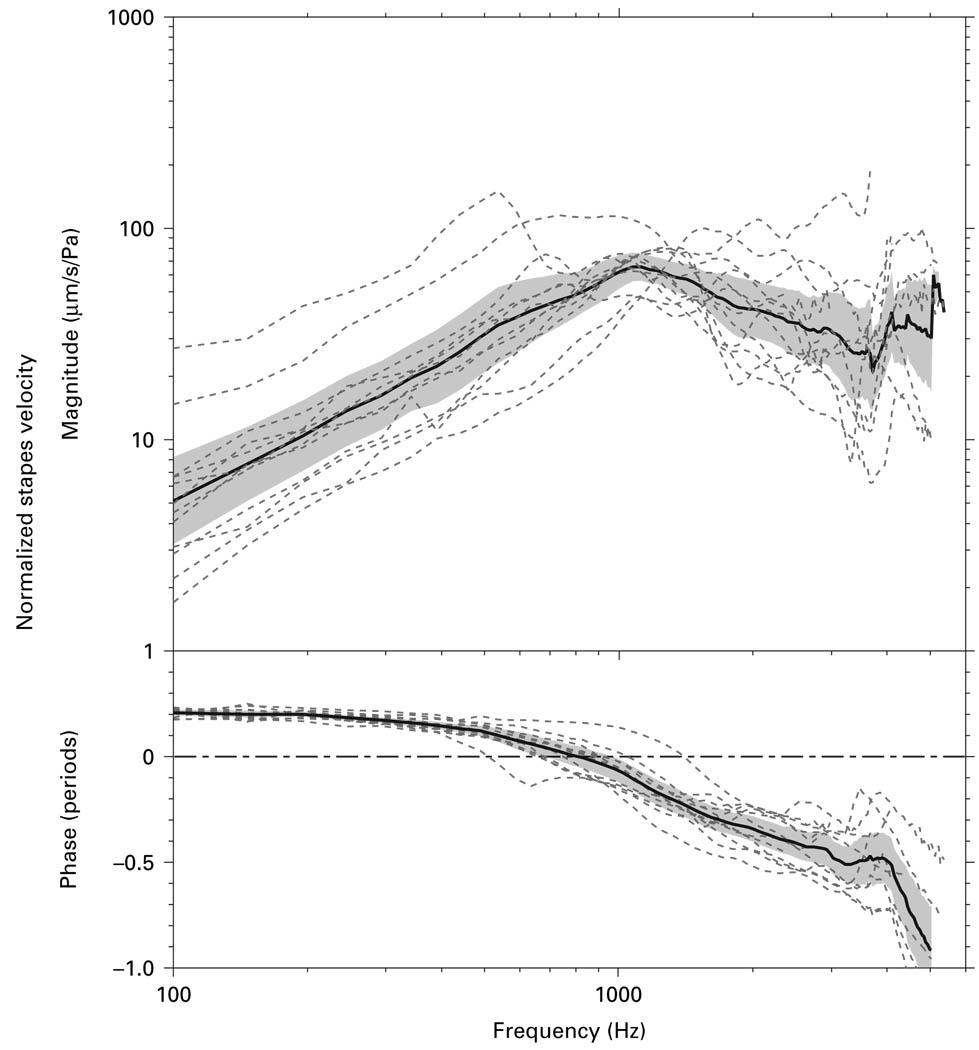
Vs was measured using the ‘surgical’ approach (‘surgical’ Vs) in 12 cadaveric temporal bones (fig. 3). The individual measurements, the mean, and the 95% confidence interval (CI) around the mean are shown. The frequency response of the mean ‘surgical’ Vs had a magnitude that increased with frequency at frequencies below 1 kHz and decreased at a lesser rate at higher frequencies. There was a 0.2-period phase lead at low frequencies which gradually decreased to 0 by ~800 Hz. The phase reached −0.5 periods above 2 kHz.
Fig. 3.
Vs measured by the ‘surgical’ approach in 12 temporal bones (dashed lines), as well as the mean (solid line) and 95% CI around the mean (shaded area).
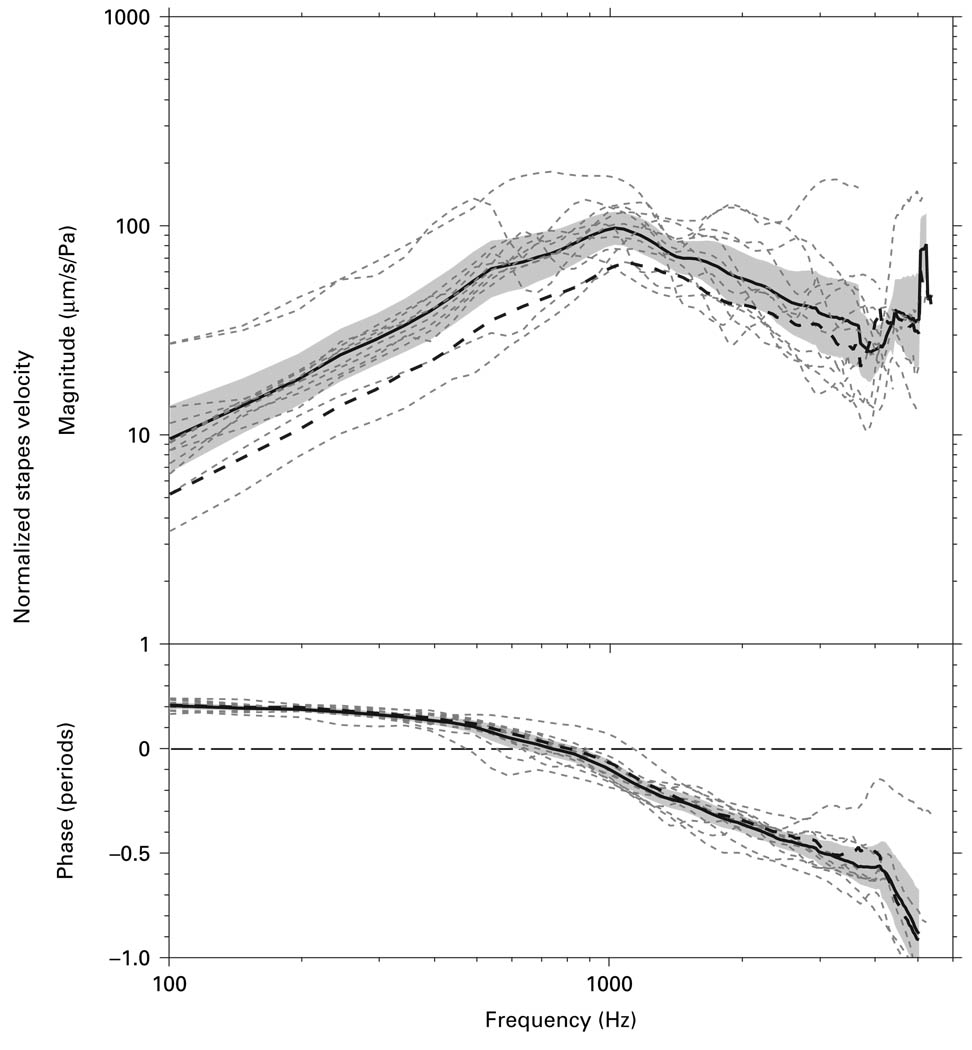
Vs was measured using the ‘experimental’ approach with the ‘experimental’ angle (‘experimental’ Vs) in the same 12 bones (fig. 4). The individual measurements, the mean, and the 95% CI around the mean are shown. The mean ‘experimental’ Vs had a frequency response much like the mean ‘surgical’ Vs, but its magnitude was higher below 4 kHz. This difference was statistically significant up to ~2 kHz since the mean ‘surgical’ Vs fell outside of the 95% CI of the ‘experimental’ Vs in this frequency range. The phase of the ‘experimental’ Vs was very similar to the phase of the ‘surgical’ Vs, with an initial 0.2-period phase lead which gradually became a phase lag above 800 Hz.
Fig. 4.
Vs measured by the ‘experimental’ approach with the ‘experimental’ angle in 12 temporal bones (dashed lines), as well as the mean (solid line) and 95% CI around the mean (shaded area). The mean Vs measured by the ‘surgical’ approach (thick dashed line) from figure 3 are also shown for comparison.
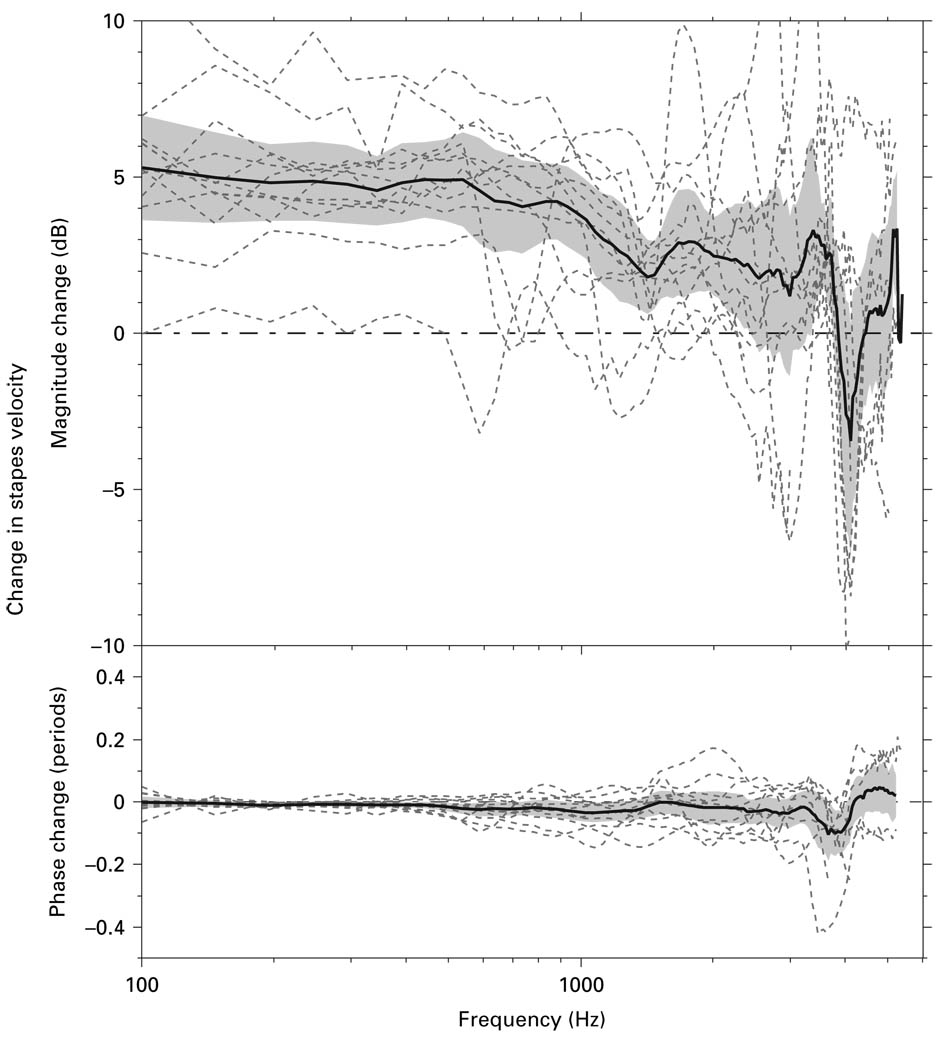
The change in measured Vs (ΔVs) between the ‘experimental’ Vs and the ‘surgical’ Vs in each of the 12 bones above is shown in figure 5 (in dB). Changing the measurement approach from the ‘surgical’ approach to the ‘experimental’ approach with the ‘experimental’ angle caused on average a 2- to 5-dB increase in the magnitude of measured Vs below 2 kHz. This mean increase was statistically significant (p < 0.05). The change in phase with changing the measurement approach was not statistically significant.
Fig. 5.
The ΔVs between Vs measured by the ‘experimental’ approach with the ‘experimental’ angle to that measured by the ‘surgical’ approach in 12 temporal bones (dashed lines). The mean (solid line) and the 95% CI around the mean (shaded area) are also shown. Magnitude change was computed as 20 times the log 10 of the ratio of the magnitudes (‘experimental’ Vs/‘surgical’ Vs). Phase change computed from the difference between the phases of the ‘experimental’ Vs and ‘surgical’ Vs.
Effects of Preparation Differences on the Measured Vs between the ‘Surgical’ and the ‘Experimental’ Approaches
Cutting the Stapedius Tendon
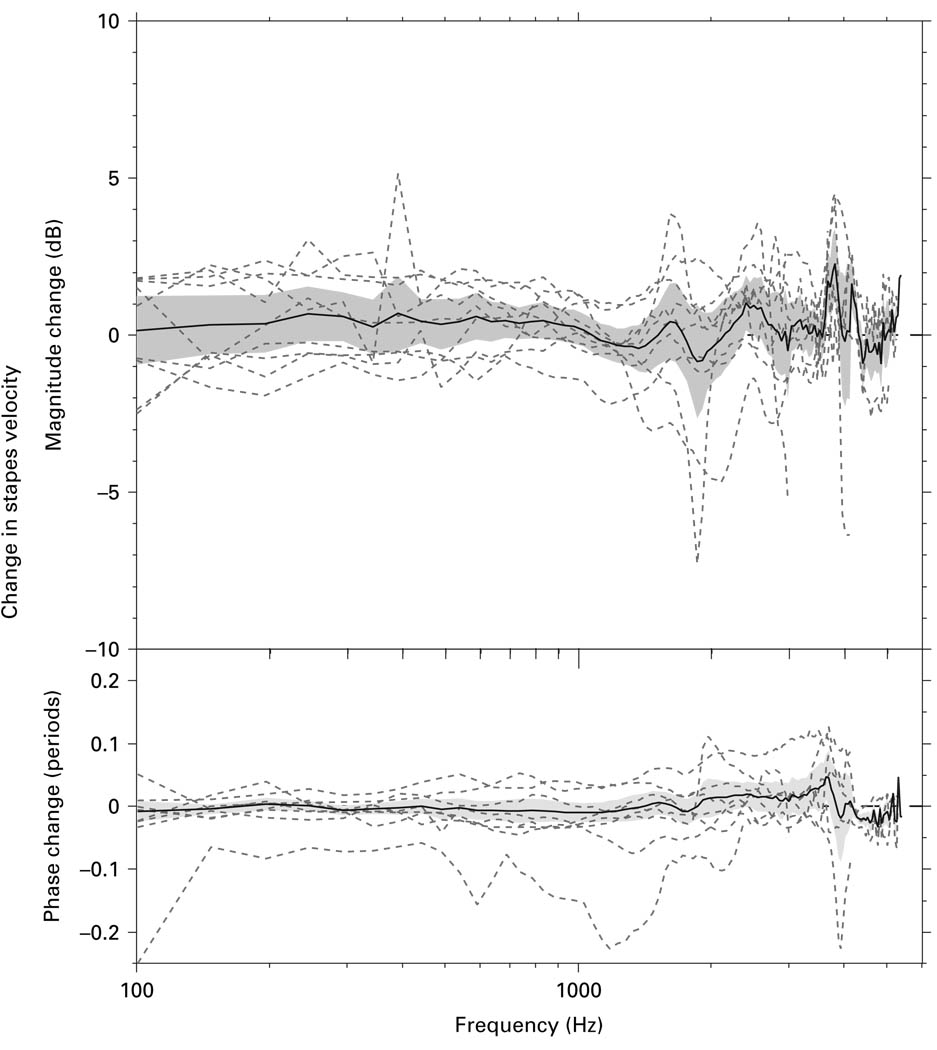
The first step in progressing from the ‘surgical’ to the ‘experimental’ approach was to cut the stapedius tendon. Figure 6 shows the ΔVs in 9 bones produced by cutting the stapedius tendon (while maintaining the ‘surgical’ angle), along with the mean change and 95% CI around the mean. Cutting the stapedius tendon had generally small effects on the magnitude (± 2 dB) and phase (−0.1−0.05 periods) of Vs, with a mean difference that was not significantly different from 0.
Fig. 6.
The ΔVs in 9 bones produced by cutting the stapedius tendon (dashed lines), along with the mean (solid line) and 95% CI around the mean (shaded area).
Removing the Facial Nerve and Opening the Facial Recess
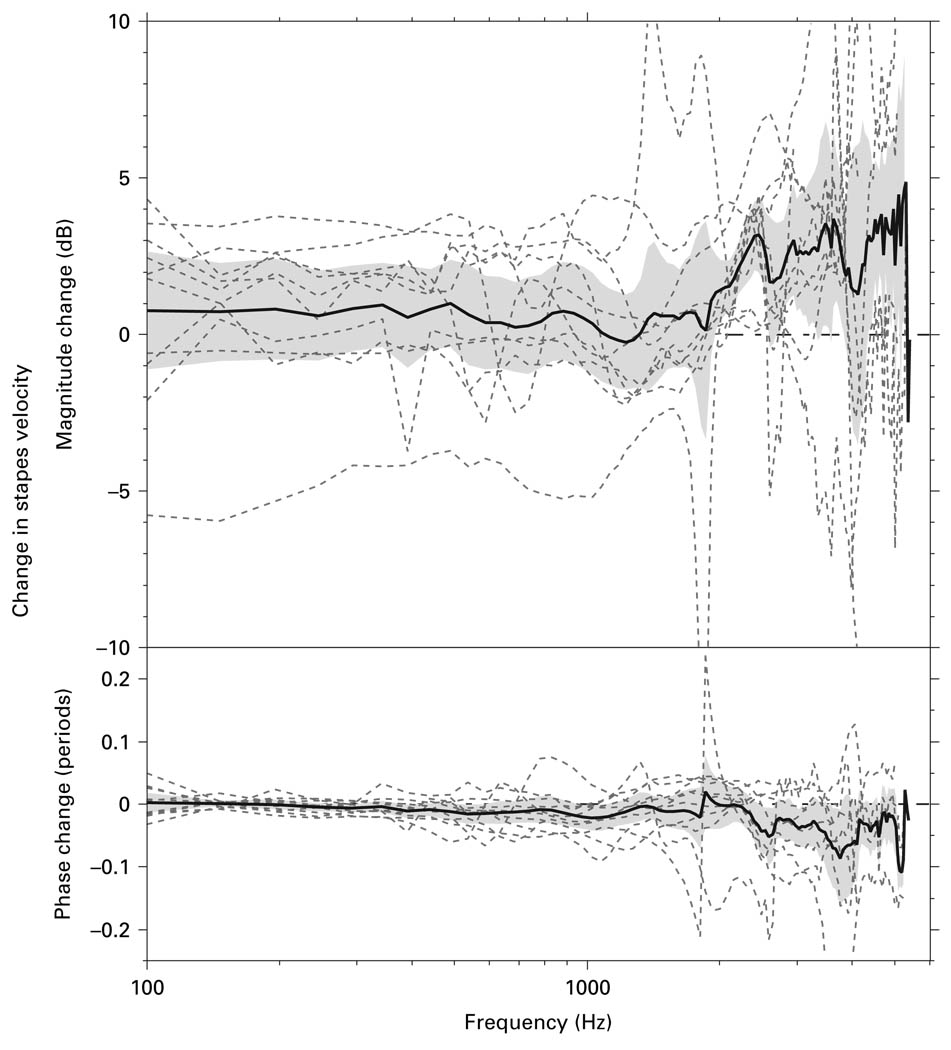
The second step in progressing from the ‘surgical’ to the ‘experimental’ approach was to remove the mastoid segment of the facial nerve and widely enlarge the facial recess. Figure 7 shows the ΔVs in 10 bones produced by removing the mastoid segment of the facial nerve and widely opening the facial recess (while keeping the measurement angle the same as that allowed by the ‘surgical’ approach). The mean change and 95% CI around the mean are also shown. Opening the facial recess and removing the mastoid segment of facial nerve had a variable effect (± 6 dB) on the Vs magnitude, with a mean difference that was not statistically different from 0 below 2 kHz. The variability in data may arise from the fact that some of the temporal bone preparations required removal of mucosal folds, while others did not. Removing mucosal folds may have allowed the ossicular chain to move more freely, causing an increase in Vs; or the process of removing mucosal folds may have loosened the ossicular joints, causing a decrease in Vs. The phase change associated with removing the facial nerve and widely opening the facial recess was small (−0.05−0.05 periods), and the mean change was not statistically significant.
Fig. 7.
The ΔVs in 10 bones (dashed lines) produced by opening of the facial recess and removing the mastoid segment of the facial nerve, along with the mean (solid line) and 95% CI around the mean (shaded area).
Effects of Changing the Measurement Angle
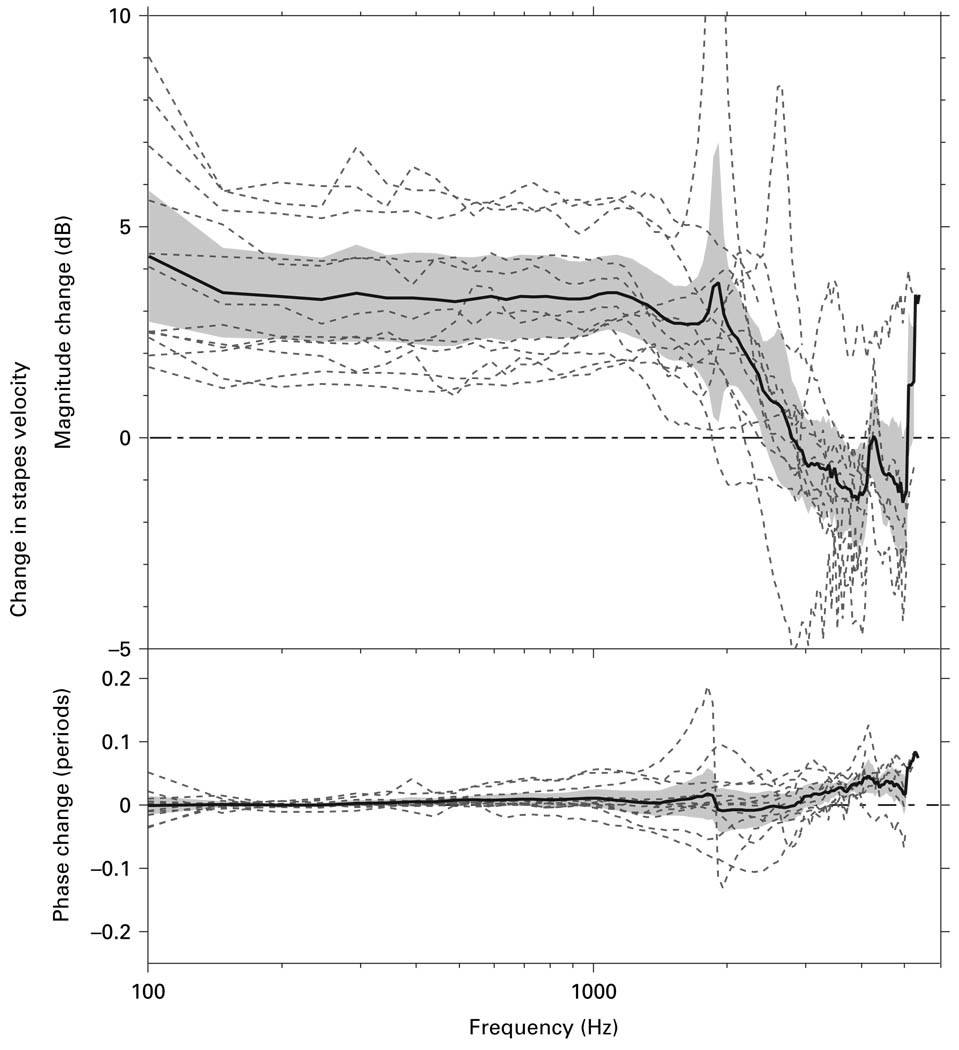
After the facial recess was widely opened, the measurement angle was decreased to the smallest allowed by the facial recess opening, and the effect of changing measurement angle was examined. Figure 8 shows the ΔVs produced by decreasing the measurement angle in temporal bones from the ‘surgical’ angle of 40–60° to the ‘experimental’ angle of 25–45°. Data are shown for 12 bones, along with the mean and 95% CI. On average, decreasing the measurement angle from the ‘surgical’ angle to the ‘experimental’ angle caused a statistically significant 3–3.5 dB increase in the measured Vs up to about 2 kHz. At higher frequencies ΔVs diminished to 0 to −1 dB and was statistically insignificant. The phase change associated with changing the measurement angle was small (−0.1−0.1 periods), and the mean phase change was not statistically significant below ~3.5 kHz.
Fig. 8.
The ΔVs produced by changing the measurement angle in temporal bones from the ‘surgical’ angle of 40–60° to the ‘experimental’ angle of 25–45°. Data are shown for 12 bones (dashed lines), along with the mean (solid line) and 95% CI around the mean (shaded area).
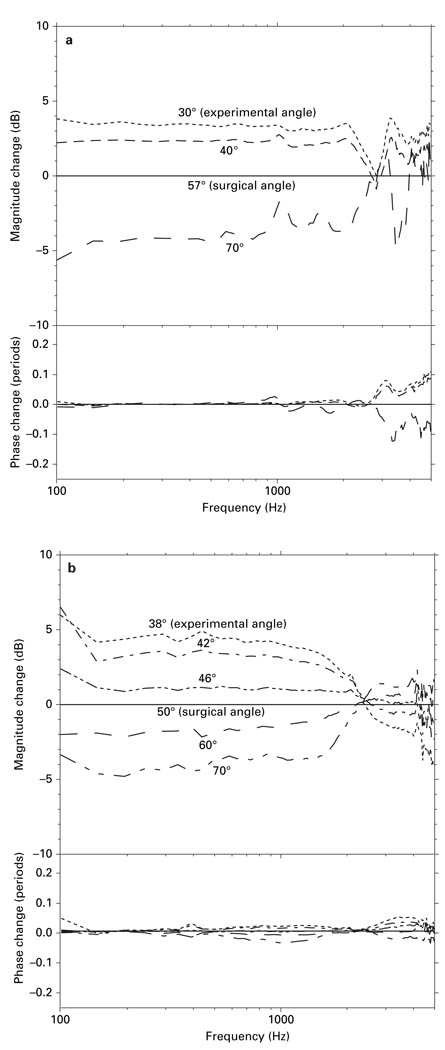
Figure 9 shows the effect of changing measurement angle on measured Vs in 2 bones that had been prepared by the ‘experimental’ approach. These figures show the ΔVs relative to the Vs measured with the ‘surgical’ angle (the ‘surgical’ angle was the smallest angle available with the ‘surgical’ approach) when the measurement angle was gradually changed from large to small with respect to the axis of piston-like stapes motion. In both figures, at lower frequencies (below 2–2.5 kHz), the smaller the measurement angle, the higher the measured Vs, as might be expected if stapes motion is piston-like. In one bone, a reduction in Vs magnitude of ~8 dB was observed by varying the nominal measurement angle from 30 to 70° (fig. 9a), while in another bone, a reduction in Vs magnitude of ~9 dB was observed by varying the measurement angle from 38 to 70° (fig. 9b). The change in measured Vs shown in figure 9a correlated closely with the cosine of the measurement angle, whereas the change in measured Vs shown in figure 9b was larger than what would be expected from the cosine of the measurement angle. Errors in the estimation of the measurement angle (as described in the Methods) could explain the difference in the relationship between ΔVs and measurement angle in these bones: if the actual measurement angles in figure 9b were 5–10 degrees larger than estimated, the ΔVs predicted by the cosine would be larger.
Fig. 9.
a The ΔVs in one temporal bone (8R in figure 10) when the measurement angle was changed from large to small with respect to the axis of piston-like stapes motion. All measurements were normalized by the ‘surgical’ angle measurement in this bone (57°). b The ΔVs in one temporal bone (12R in figure 10) when the measurement angle was changed from large to small with respect to the axis of piston-like stapes motion. All measurements were normalized by the ‘surgical’ angle measurement in this bone (50°).
Above 2–2.5 kHz, the measurement angle had a much smaller effect on the magnitude of the measured Vs. There were minimal phase changes associated with changing the measurement angle below 2–2.5 kHz in both figures; whereas around 3 kHz, changing the measurement angle caused a −0.1−0.1 period phase change in figure 9a, and a −0.025−0.05 period phase change in figure 9b.
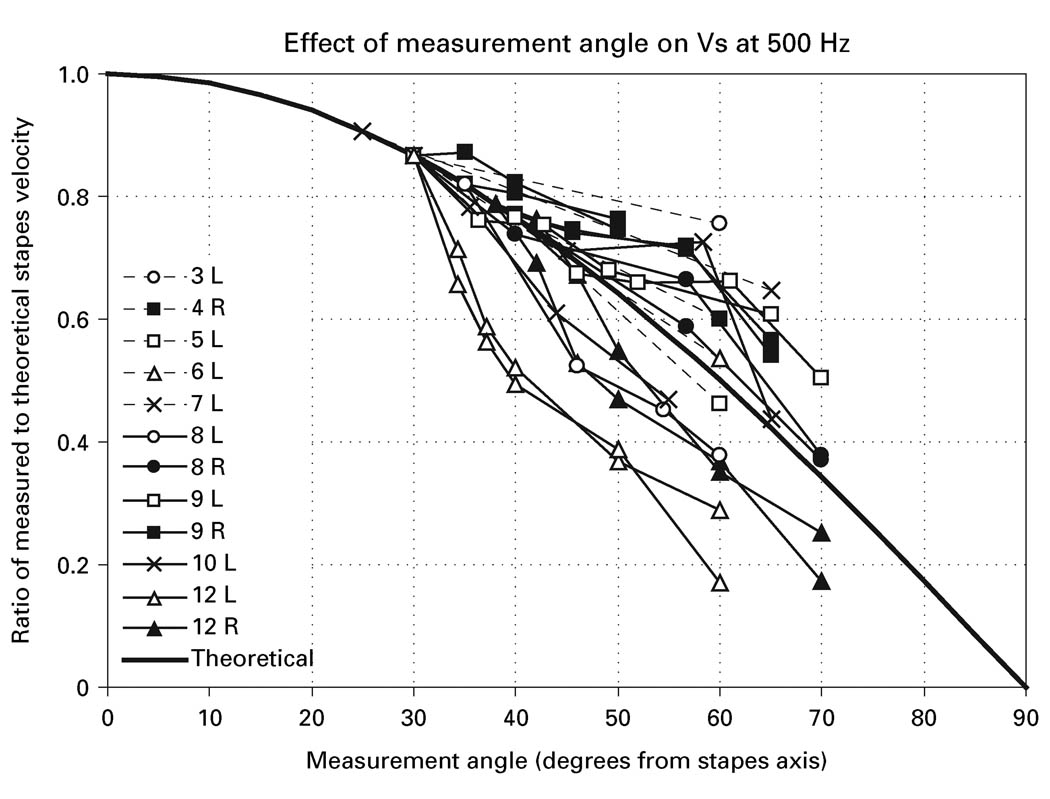
The relationship between low-frequency measured Vs and measurement angle illustrated in figure 9 was observed in all bones. Figure 10 shows the relationship between ΔVs at 500 Hz and the measurement angle in all 12 bones. In this figure, the theoretical Vs in the direction of piston-like stapes motion (0°) was computed by dividing Vs measured at the ‘experimental’ angle by the cosine of the ‘experimental’ angle, and ΔVs is the Vs measured at various angles normalized by this theoretical value. In some bones, Vs was measured from only the ‘surgical’ and ‘experimental’ directions; in others, measurements were made at several additional angles (as in figure 9). In several of the bones, the angle series were repeated with observed inter-measurement differences of generally less than 1 dB [e.g., see the two data sets from bone 12L (the open triangles) and bone 12R (the filled triangles), although the repeated measurements in 12R made at a nominal angle of 45° varied by 2 dB]. The thick solid line is the cosine of the measurement angle. (Because the theoretical Vs were computed relative to the Vs measured at the ‘experimental’ angle, all ΔVs at the ‘experimental’ angle fall on the line.)
Fig. 10.
The difference in measured Vs at 500 Hz in 12 temporal bones at various measurement angles (symbols and thin lines) compared with the theoretical difference in Vs computed as the cosine of the measurement angle (thick solid line). ΔVs is computed relative to piston-like stapes motion (0°) predicted from Vs measured at the experimental angle as described in the text.
The measured Vs at 500 Hz decreased in all bones as the measurement angle increased, and the relationship between ΔVs at 500 Hz and measurement angle was similar to the predicted relationship for changes in viewing angles with simple piston-like stapes motion: all data are near the theoretical line, and the slope of all ΔVs curves is similar to that of the line. Though not all ΔVs data fall on the theoretical line, they are roughly evenly distributed around it. Possible explanations for the difference between the theoretical and measured values in these measurements include: (1) Systematic errors in the measurement angle estimate caused by errors in the judgment of the horizontal plane of the footplate, that would shift each data curve along the x-axis. The data of figure 10 indicate that shifts of ± 10° or less would greatly improve the fit of all of the data to the theoretical line. (2) Errors in the estimate of the angle from the axis of piston-like stapes motion of individual measurements, that would shift individual points to the left or right. Figure 10 suggests that such errors are generally small, since the data curves are generally parallel to the theoretical curve. (3) Stapes motion at 500 Hz may not be completely perpendicular to the footplate. Large motions of the stapes in non-piston-like directions could compromise the cosine relationship between measured Vs magnitude and angle of observation. Nevertheless, the general similarity of our measured changes in velocity to the cosine curve of the measurement angle is consistent with piston-like stapes motion and shows that correcting measured Vs at low frequencies by the cosine of the measurement angle is likely to produce valid predictions of actual Vs.
On the other hand, the lack of change in the measured Vs with measurement angle that is observed at frequencies > 2 kHz (fig. 8, 9) is inconsistent with a simple piston-like motion. The relative insensitivity to changes in viewing angle instead suggests the presence of other modes of stapes vibration at those higher frequencies [Gyo et al., 1987; Heiland et al., 1999; Voss et al., 2000; Hato et al., 2003; Decraemer and Khanna, 2004], and indicates that correcting for measured Vs by the cosine of the measurement angle is invalid above 2 kHz.
Discussion
The validity of using cadaveric temporal bones to study human middle-ear mechanics has been the subject of some controversy. Though cadaveric ears appear to be a good model of live ears for middle-ear input (e.g., umbo velocity, input immittance), the story for middle-ear output (e.g., Vs) is less clear: data are scarce and possibly not representative of healthy ears. Reasons for this state of affairs include: (1) A small candidate patient population for live stapes measurement. Most procedures involving exposure of the stapes are performed in ears that have had middle-ear disease. Therefore, the most useful subjects are patients with normal middle ears undergoing cochlear implantation. (2) The limited time available for measurements during surgery. (3) Adverse measurement conditions – the stapes (and other ossicles and the tympanic membrane) may be partially covered with fluid and/or blood, and the use of targets to increase reflection for laser vibrometer measurements is not an option.
In the single extant study of middle-ear output in 7 live patients [Huber et al., 2001], Vs was reported to be lower than that in cadaveric ears at low frequencies, but similar at frequencies above 2 kHz. The consequent change in frequency response has led some investigators to conclude that ‘there are substantial differences between in vivo and most post-mortem measurements (of Vs)’ [Ruggero and Temchin, 2003]. In this study, we demonstrate that there can be substantial viewing-angle-dependent differences in the measured Vs at frequencies below 2 kHz. In the following paragraphs we will argue that much if not all of the differences observed in the Vs between live and cadaveric ears can be attributed to differences in viewing angle, thus the mechanical function between cadaveric and live ears is similar.
Comparison of Vs Measured by ‘Surgical’ and ‘Experimental’ Approaches to Published Vs Measurements in Live and Cadaver Ears
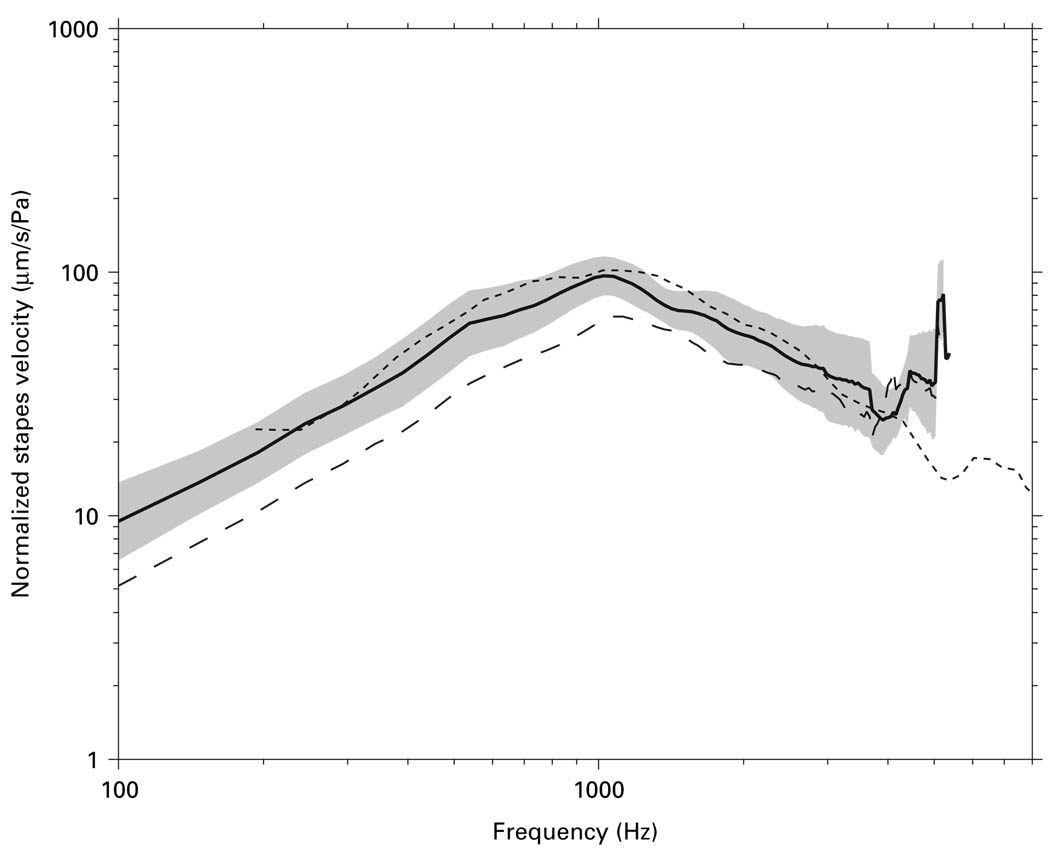
Are Vs measurements by the ‘experimental’ approach in this study representative of other Vs measurements in cadaveric temporal bones? Figure 11 shows that our mean Vs measured by the ‘experimental’ approach with the ‘experimental’ angle (solid line) is similar in magnitude to the mean Vs measured in 22 cadaveric temporal bones by Asai et al. [1999]: Differences in Vs magnitude are at most a factor of 1.2 (2 dB) below 4.5 kHz and are statistically insignificant. (Asai et al. did not report Vs phase.) In contrast, the mean Vs magnitude measured by the ‘surgical’ approach in the present study is significantly lower below 2 kHz: the mean is lower in magnitude by a factor of 1.5–2 (4–6 dB). Our ‘experimental’ Vs are typical of previous measurements in cadaveric temporal bones; our ‘surgical’ Vs are significantly lower.
Fig. 11.
Mean Vs magnitude measured by the ‘experimental’ approach with the ‘experimental’ angle in the present study (solid line) and the 95% CI around the mean (shaded area) compared with the mean Vs measured in 22 cadaveric temporal bones by Asai et al. [1999] (dotted line). The mean Vs measured by the ‘surgical’ approach in the present study (dashed line) is also shown.
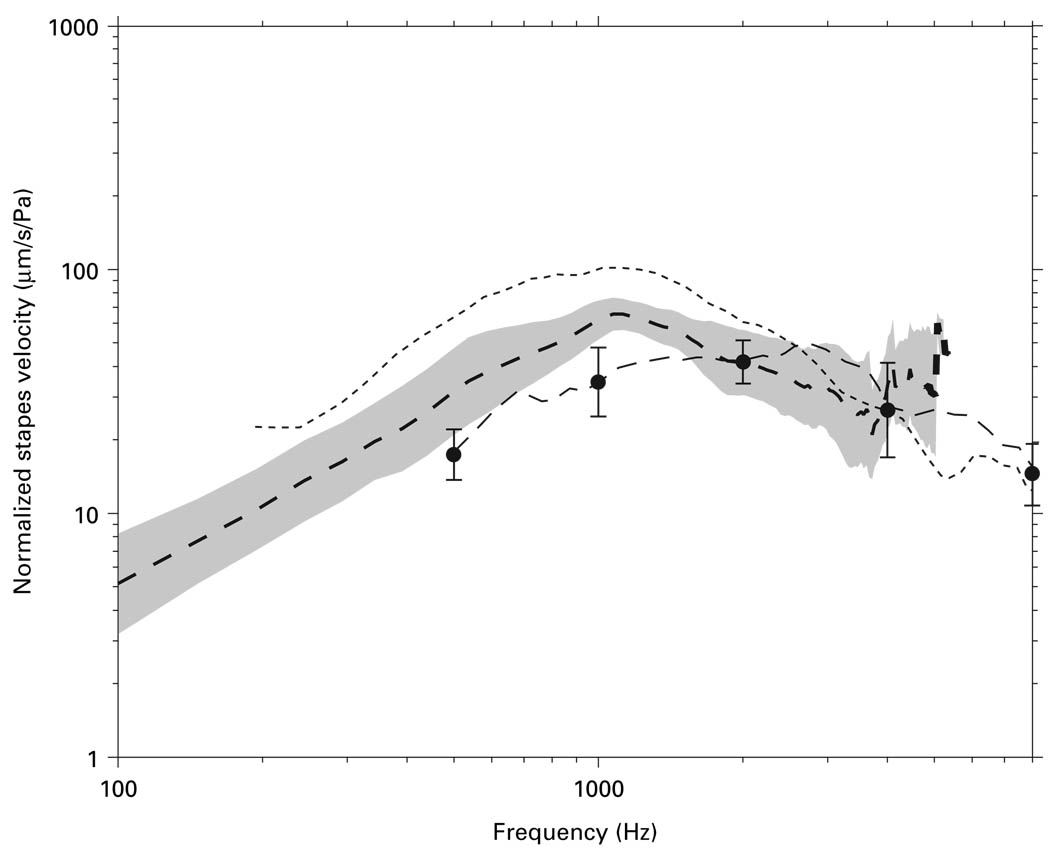
Are Vs measurements by the ‘surgical’ approach similar to Vs measured in live patients? Figure 12 shows that our mean Vs measured by the ‘surgical’ approach is intermediate in magnitude between the mean Vs measured in 7 live ears by Huber et al. [2001] and the mean Vs in cadaveric ears by Asai et al. [1999] at low frequencies and similar to both at high frequencies. (Huber et al. also did not report Vs phase). Our mean ‘surgical’ Vs lies above the 95% CI computed from the published live Vs data between 700 and 1500 Hz, which implies a significant difference in this frequency range; nevertheless, our ‘surgical’ Vs is closer in magnitude to Vs in live ears than previously-reported cadaveric Vs measurements are. Our mean ‘surgical’ Vs are similar to the Vs measured in live ears above 1.5 kHz.
Fig. 12.
Mean Vs magnitude measured by the ‘surgical’ approach (dashed line) and its 95% CI (shaded area) of the present study compared with the mean live Vs measured by Huber et al. [2001] (dot-dashed line). The 95% CIs for live Vs at 500, 1000, 2000, and 4000 Hz are shown as the error bars. The mean cadaveric Vs measured by Asai et al. [1999] (dotted line) is also included for comparison.
We have recently begun to make Vs measurements in live patients undergoing cochlear implantation, using the equipment and protocols described for the ‘surgical’ approach in the present study. Preliminary data suggest that the ‘surgical’ angle achievable intraoperatively is ~60–80° with respect to the axis of piston-like stapes motion, which is greater than the ‘surgical’ angle (40–60°) used in the present study. The reason for this disparity is that live patients have soft tissue and pinna attached to the ear canal and their neck mobility is limited; whereas in cadaveric temporal bones, the soft tissue and pinna are dissected away, and the temporal bone can be placed in any orientation to facilitate velocity measurements. Both factors contribute to a larger ‘surgical’ angle in live patients in the operating room compared to the ‘surgical’ angle used in cadaveric temporal bones in the present study. This clearly has implications for explaining the differences in Vs measurements between live and cadaveric ears, as discussed later.
Contributions of Differences between ‘Surgical’ and ‘Experimental’ Approaches
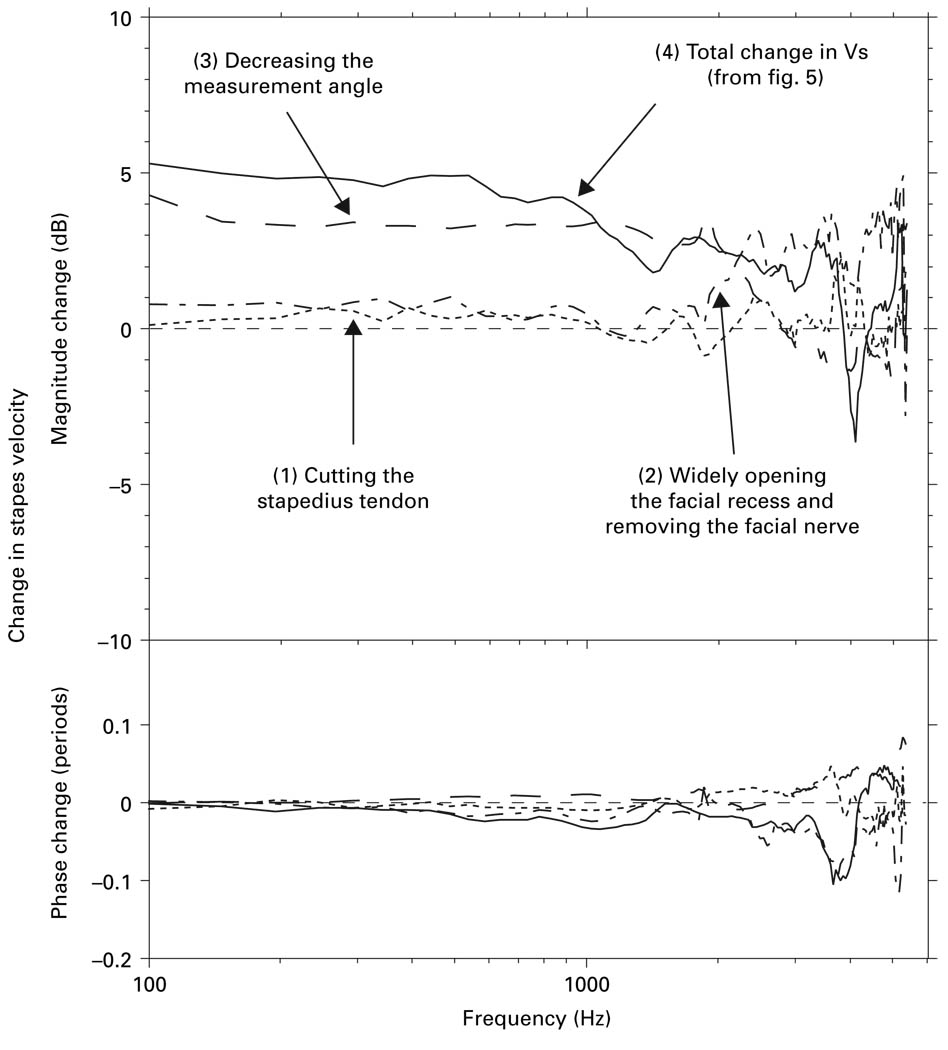
The differences in Vs measured by the ‘surgical’ and ‘experimental’ approaches, which mimic Vs measurement methods in live and cadaveric temporal bones, respectively, can be explained mostly by the differences in measurement angle. In the ‘surgical’ approach, as in live ears, the stapedius tendon and the mastoid segment of the facial nerve are preserved; whereas in the ‘experimental’ approach, as in other studies using cadaveric ears, these structures are routinely removed and the facial recess is opened widely. The wide facial recess opening in cadaveric ears allows for Vs measurements to be made at a small angle with respect to the axis of piston-like stapes motion, whereas the small facial recess opening (and other factors described above) in live ears permits Vs measurements only at a large angle. In the present study, we explored the effects on Vs produced by different steps of the preparation procedure. Figure 13 shows that, though the mean effect of some of the steps was small over part or all of the frequency range of measurement, cumulatively their effects were substantial: cutting the stapedius tendon (curve 1) increased Vs magnitude slightly at low frequencies; removing the facial nerve and widely enlarging the facial recess (curve 2) also increased Vs magnitude slightly at low frequencies; and decreasing the measurement angle (curve 3) increased Vs magnitude substantially at low frequencies. Comparing each of these contributions to the overall difference in Vs between ‘experimental’ and ‘surgical’ approaches (curve 4) shows that the overall ΔVs is attributed primarily to the change in measurement angle (curve 3) below 2 kHz.
Fig. 13.
Contributions of mean changes in Vs to the total Vs between ‘experimental’ and ‘surgical’ approaches by different steps in the preparation procedure: (1) cutting the stapedius tendon; (2) removing the facial nerve and opening the facial recess widely; (3) decreasing the measurement angle. Total change in Vs (4) is taken from figure 5.
Functional vs. Geometric Measurement Angle Correction
Because middle-ear anatomy generally precludes measuring Vs along the stapes axis, Vs in the direction of piston-like motion (axial) must be estimated from measurements from a non-axial direction. Axial Vs is commonly estimated from single-point velocity measurements by dividing the magnitude of the measured Vs by the cosine of the measurement angle [e.g., Heiland et al., 1999]. This estimation method assumes that the stapes moves in a piston-like fashion across the entire frequency range of measurement. The result of this geometric ‘cosine correction’ is that Vs magnitude is shifted upward, while the phase of Vs remains unchanged.
In the present study we found that the effect of changing measurement angles on Vs varied with frequency: The change in the measured Vs from different angles can be explained by the ‘cosine correction’ at low frequencies (fig. 10), but above 2 kHz the magnitude change is much smaller than expected and a phase change can be introduced (fig. 9). This finding demonstrates that the practice of geometrically ‘correcting’ for measurement angles across the entire frequency range gives inaccurate Vs estimates above 2 kHz.
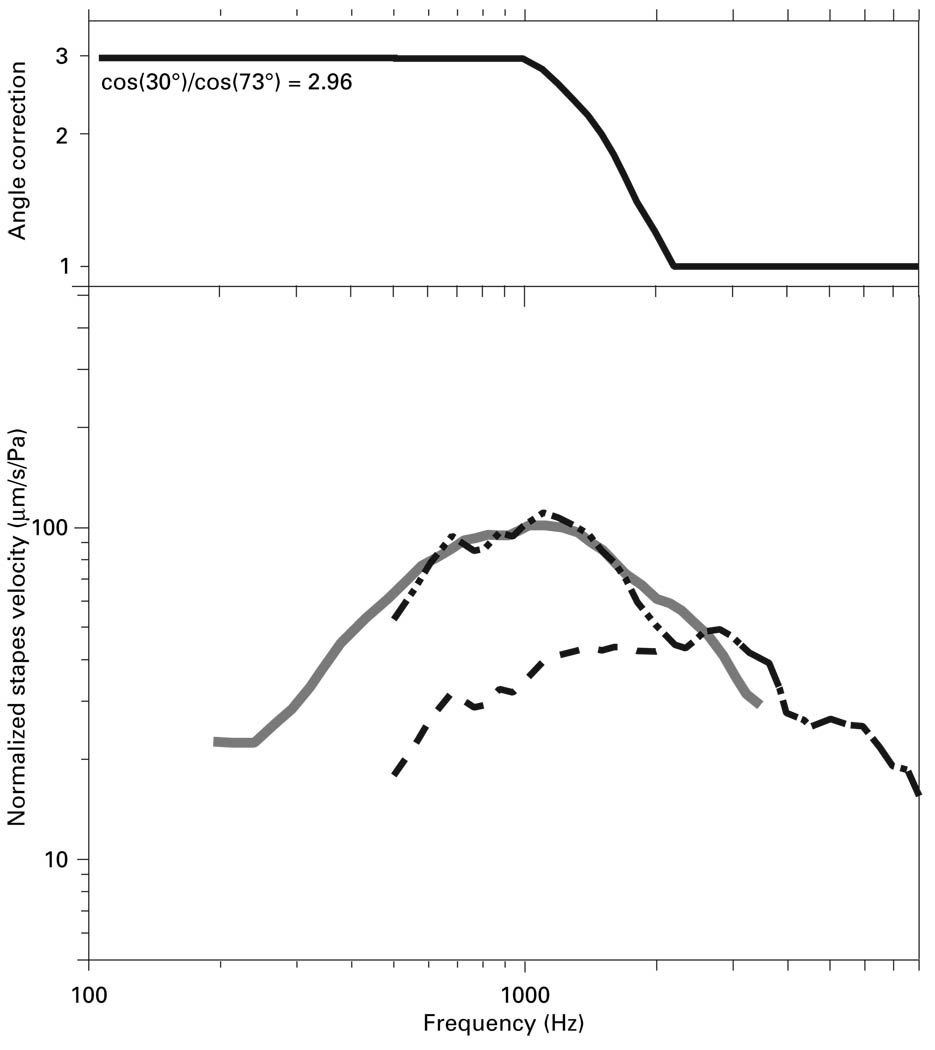
The frequency-dependent effect of measurement angle on measured Vs may explain the differences in frequency response shape between Vs measurements in live vs. cadaveric ears. In figure 14 we have applied a functionally-based frequency-dependent correction to the mean Vs measured in live ears by Huber et al. [2001]: We assumed that the cadaveric Vs measurements from Asai et al. [1999] were made at a 30° angle (Asai et al. did not report measurement angle), which was within the range of our ‘experimental’ angles of 25–45°. We then calculated the change in measurement angle needed to explain the roughly factor-of-3 difference between the mean cadaveric Vs from Asai et al. [1999] and the mean live Vs from Huber et al. [2001] at frequencies below 1 kHz (fig. 1, 12), using the cosine dependence curve from figure 10: Increasing the measurement angle from 30° to 73° would reduce measured Vs magnitude by a factor of 3 (cos 73°/cos 30°). This proposed surgical measurement angle of 73° is consistent with our preliminary intraoperative Vs measurements, where the measurement angle was found to be between 60–80°. Since we have shown that the measured Vs magnitude is independent of measurement angle above 2 kHz, no angle correction is necessary in this frequency range.
Fig. 14.
Effect of a frequency-dependent measurement angle correction on Vs measured in live ears. Top panel: The multiplicative correction factor is illustrated. At frequencies below 1000 Hz the correction has a magnitude of 2.96 (9.4 dB) as might occur if the ‘experimental’ and ‘surgical’ angles were 30° and 74°, respectively. No correction (a correction factor of 1) is applied at frequencies above 2000 Hz. A linear decrease in the correction factor is assumed between 1000 and 2000 Hz. Bottom panel: The cadaveric Vs data of Asai et al. [1999] (solid gray line) are compared with the original live Vs data of Huber et al. [2001] (dashed data curve) and the Huber data corrected by the multiplicative factor described in the top panel (the dot-dash line).
We computed a correction factor as follows: A factor of 3 (as described above) below 1 kHz, decreasing linearly to a factor of 1 at 2 kHz (to mimic the somewhat gradual reduction in the angle-induced changes observed in figures 9), and continuing at a factor of 1 (no correction) above 2 kHz. The solid line in figure 14 is the live Vs from Huber et al. [2001] with this correction factor applied. The similarity between the angle-corrected live Vs and the cadaveric Vs suggests that much if not all of the difference between live and cadaveric Vs may be due to the differences in the measurement angle between the two preparations.
Ongoing Work
We are in the midst of an ongoing study in live patients undergoing cochlear implantation in which Vs measurements are being made using the same equipment and protocols described for the ‘surgical’ approach in the present study. It is our hope that these additional Vs measurements in live ears, using the same equipment and techniques as for cadaver ears, will contribute to the understanding of the similarities and sources of differences in middle-ear output in cadaver vs. live ears.
Acknowledgements
We would like to thank Diane Jones, William Peake, Jocelyn Songer, and the staff at Eaton-Peabody Lab for their support and inputs. Funded by NIDCD (grant No. R01 DC047998 to S.N.M.), Anne and Monte Wallace, and the Silverstein Young Investigator Award (to W.C.).
References
- Asai M, Huber A, Goode R. Analysis of the best site on the stapes footplate for ossicular chain reconstruction. Acta Otolaryngol (Stockh) 1999;119:356–361. doi: 10.1080/00016489950181396. [DOI] [PubMed] [Google Scholar]
- Decraemer WF, Khanna SM. Measurement, visualization and quantitative analysis of complete three-dimensional kinematical data sets of human and cat middle ear. In: Gyo K, Wada H, Hato N, Koike T, editors. Middle Ear Mechanics in Research and Otology. Singapore: World Scientific; 2004. pp. 3–10. [Google Scholar]
- Goode RL, Ball G, Nishihara S. Measurement of umbo vibration in human subjects – method and possible clinical applications. Am J Otol. 1993;14:247–251. [PubMed] [Google Scholar]
- Goode RL, Ball G, Nishihara S, Nakamura K. Laser Doppler vibrometer (LDV) – a new clinical tool for the otologist. Am J Otol. 1996;17:813–822. [PubMed] [Google Scholar]
- Gyo K, Aritomo H, Goode RL. Measurement of the ossicular vibration ratio in human temporal bones by use of a video measuring system. Acta Otolaryngol. 1987;103:87–95. doi: 10.3109/00016488709134702. [DOI] [PubMed] [Google Scholar]
- Hato N, Stenfelt S, Goode RL. Three-dimensional stapes footplate motion in human temporal bones. Audiol Neurootol. 2003;8:140–152. doi: 10.1159/000069475. [DOI] [PubMed] [Google Scholar]
- Heiland KE, Goode RL, Asai M, Huber AM. A human temporal bone study of stapes footplate movement. Am J Otol. 1999;20:81–86. [PubMed] [Google Scholar]
- Huber A, Linder T, Ferrazzini M, Schmid S, Dillier N, Stoeckli S, Fisch U. Intraoperative assessment of stapes movement. Ann Otol Rhinol Laryngol. 2001;110:31–35. doi: 10.1177/000348940111000106. [DOI] [PubMed] [Google Scholar]
- Mehta RP, Ravicz ME, Rosowski JJ, Merchant SN. Middle-ear mechanics of Type III tympanoplasty (stapes columella). I. Experimental studies. Otol Neurotol. 2003;24:176–185. doi: 10.1097/00129492-200303000-00009. [DOI] [PubMed] [Google Scholar]
- Merchant SN, Ravicz ME, Rosowski JJ. Acoustic input impedance of the stapes and cochlea in human temporal bones. Hear Res. 1996;97:30–45. [PubMed] [Google Scholar]
- Nakajima HH, Ravicz ME, Rosowski JJ, Peake WT, Merchant SN. Experimental and clinical studies of malleus fixation. Laryngoscope. 2005;115:147–154. doi: 10.1097/01.mlg.0000150692.23506.b7. [DOI] [PubMed] [Google Scholar]
- Ravicz ME, Rosowski JJ, Merchant SN. Mechanisms of hearing loss resulting from middle-ear fluid. Hear Res. 2004;195:103–130. doi: 10.1016/j.heares.2004.05.010. [DOI] [PubMed] [Google Scholar]
- Rosowski JJ, Davis PJ, Merchant SN, Donahue KM, Coltrera MD. Cadaver middle-ears as models for living ears: comparisons of middle ear input immittance. Ann Otol Rhinol Laryngol. 1990;99:403–412. doi: 10.1177/000348949009900515. [DOI] [PubMed] [Google Scholar]
- Rosowski JJ, Huber AM, Ravicz ME, Goode RL. Are temporal bones useful models for human middle ear mechanics? Abstracts 27th Midwinter Meet Assoc Res Otolaryngol, Daytona Beach. 2004 [Google Scholar]
- Ruggero MA, Temchin AN. Middle-ear transmission in humans: wide-band, not frequency-tuned? Acoust Res Lett Online. 2003;4:53–58. doi: 10.1121/1.1566924. [DOI] [PMC free article] [PubMed] [Google Scholar]
- Schuknecht H. Temporal bone removal at autopsy. Preparation and uses. Arch Otolaryngol. 1968;87:129–137. doi: 10.1001/archotol.1968.00760060131007. [DOI] [PubMed] [Google Scholar]
- Voss SE, Rosowski JJ, Merchant SN, Peake WT. Acoustic responses of the human middle ear. Hear Res. 2000;150:43–69. doi: 10.1016/s0378-5955(00)00177-5. [DOI] [PubMed] [Google Scholar]


