Abstract
A barrier in scaling laboratory processes into automated microfluidic devices has been the transfer of laboratory based assays: Where engineering meets biological protocol. One basic requirement is to reliably and accurately know the distribution and number of biological cells being dispensed. In this study, a novel optical counting technique to efficiently quantify the number of cells flowing into a microtube is presented. REH, B-lymphoid precursor leukemia, are stained with a fluorescent dye and frames of moving cells are recorded using a charge coupled device (CCD) camera. The basic principle is to calculate the total fluorescence intensity of the image and to divide it by the average intensity of a single cell. This method allows counting the number of cells with an uncertainty ±5%, which compares favorably to the standard biological methodology, based on the manual Trypan Blue assay, which is destructive to the cells and presents an uncertainty in the order of 20%. The use of a microdevice for vertical hydrodynamic focusing, which can reduce the background noise of out of focus cells by concentrating the cells in a thin layer, has further improved the technique. Computational fluid dynamics (CFD) simulation and confocal laser scanning microscopy images have shown an 82% reduction in the vertical displacement of the cells. For the flow rates imposed during this study, a throughput of 100–200 cells∕s is achieved.
INTRODUCTION
Biomicrofluidics has been widely cited as an emergent area of research over the past 10 years that has yet, to a large extent, to deliver the anticipated technological breakthroughs and wealth creation. The field is centered on scaling laboratory processes into automated microfluidic devices, exploiting the enhanced mass and energy transport phenomena and smaller reagent and sample sizes required for analysis at the reduced scale. Much of the recent development in microscopic fluid dynamics is connected with the need to improve biomedical research and clinical diagnostics, such as cancer diagnostics.1 A barrier in scaling laboratory processes into automated microfluidic devices has been the transfer of laboratory based assays: Where engineering meets biological protocol. Biological cells often adhere, disintegrate, clump, coagulate, and even mutate in a complex and unpredictable manner. Because of this, the ostensibly straightforward task of dispensing a consistent and accurate number of cells is not trivial. Considerable temporal and spatial variabilities in the distribution of cells to inlet channels can be experienced, hindering the commercial development of biomicrofluidic platforms. Moreover, in the past few years, there has been a growing interest in developing alternative methods for animal testing; for any sort of cell toxicity tests, for instance, the need to accurately know the number of cells under investigation is a primary concern. In order to overcome these problems, an automation of the standard biological protocol that previously required manual operations is performed. In the Trypan Blue assay, the percentage of cell suspension that is viable is calculated from a sample of the entire cell population,2 which exhibits a high degree of variability.
Several techniques and patents have been established to address the counting problem and most of them require the addition of chemical solutions into the suspension or the use of sophisticated apparatus. The Coulter counter,3 developed in the 1950s, is one of the most widely used apparatus for counting and sizing cells. Cell quantification is derived from the change in electric conductance of a small aperture when media containing cells pass through. Several attempts have been made to apply the Coulter counter principle to the microscale. Gawad et al.4 reported a microscale chip device for particle and cell sizing. Human erythrocyte and erythrocyte ghost cells were discriminated through electric impedance measurements. Counting and sizing of bioparticles were carried out by Zhe et al.5 using a micro-Coulter counter with multiple sensing microchannels. A key issue in Coulter counters has been clogging of the apertures and because the operating range is less than 40% the aperture size, there is a need to modify the aperture size to extend the operating range. Nieuwenhuis et al.6 developed a two-dimensional (2D) liquid aperture controlled Coulter counter and achieved a 25% modulation in signal compared to 0.5% without the aperture control.
The importance of optically visualizing the cells that are going to be tested, however, is becoming highly important, especially in morphological studies and long-term monitoring of cells, bacteria,7 and micro-organisms.8 Visually counting the cells is a tedious process, requiring tens of hours for several minutes of video. Automated approaches have been developed for detecting9 and tracking10 B-cells in vivo and in vitro,11 but are computationally expensive, requiring many hours for one single video. Recently, Boyer et al.12 enhanced the tracking process using a Compute Unified Device Architecture (CUDA)-capable graphics processing unit (GPU), improving the process 200-fold. Phukpattaranont and Boonyaphiphat13 developed a method to automatically count single images of breast cancer cells using a segmentation method. The image is first preprocessed, where the image color is changed and an anisotropic diffusion is applied, then divided into single cells using watershed segmentation. Sizto and Dietz14 patented a device which quantifies cells using a peak identification procedure. Cells are discriminated by a peak amplitude comparison with adjacent pixels. However, this method fails to distinguish overlapped cells and clusters of cells.
In this paper a simple alternative optical method is presented, based on the integration of a fluorescence detection system, composed of a microscope and a charge coupled device (CCD) camera, with a simple script. The basic idea is to quantify the number of cells by dividing the total fluorescent intensity of an image by the average intensity of a single cell. The error associated with this system is in the order of ±5%, which is mainly caused by the different fluorescent intensities of the cells. This is because cells may be located at different depths in the microchannel and the intensity is proportional to their distance from the focal plane. To achieve a uniform cell intensity, hydrodynamic focusing can be applied.
Hydrodynamic focusing has been employed in many applications including flow cytometry,15 cell sorting,16 and micro particle image velocimetry (micro-PIV).17 The original design of macroflow cytometers18 was axisymmetric where a high gauge blunt needle was placed concentrically within a glass capillary tube. The limitation in fabrication capability at the small scale has resulted in adapting this design to more simplified planar ones.19 In planar 2D microflow cytometers, the sample stream is focused in one direction by two high-flow-rate sheath flows. The first application of 2D focusing to the microscale was made by Knight et al.,20 who developed a micromixer able to control the sample width from 10 μm to 50 nm. Lee et al.21 investigated the parameters controlling the profile of the sample flow into a microchannel, showing that the size of the focused stream can be reduced to the same order of magnitude as that of 20 μm microbeads. In classic 2D hydrodynamic focusing microdevices,21 cells are only compressed on the horizontal dimension; therefore they may not pass the focused stream in a single file, even though its width has the same order of magnitude as that of the cells size due to the wide vertical distribution of the cells. Furthermore, many detection devices are often unable to detect cells if their depth in the sample is out of the focal plane; those cells generate background noise and reduce the signal-to-noise ratio. To overcome these problems Simonnet and Groisman22 applied the hydrodynamic focusing technique to the vertical dimension in a polydimethylsiloxane (PDMS) microdevice, squeezing the sample flow into a region equal to 10% of the channel height. Recently, Lin et al.23 numerically investigated two possible geometries to confine cells in a small vertical displacement.
A microdevice has been developed to compress the flow both in the vertical and the horizontal directions, and the two focusing can be obtained independently. Computational fluid dynamics (CFD) simulations and confocal laser scanning microscopy images are compared to demonstrate that if vertical hydrodynamic focusing is applied, cells will be constrained in a small region in the center of the channel. The reduction in the z displacement of the cells should lead to a more uniform intensity distribution and improve the signal-to-noise ratio, thereby reducing the uncertainty of the method.
This paper is structured as follows. First, the cell line and culturing method along with the experimental apparatus and the device used within this study are described. The optical counting technique is explained in Sec. 2C. This is followed by results demonstrating the performance using B-lymphoid leukemia cells.
METHODS
Cell culturing and staining
A REH suspension cell line, B-lymphoid precursor leukemia, was cultivated in vitro in RPMI 1640 (Sigma Aldrich, Ireland) medium, with 1% L-glutamine 200 mM, 1% penicillin streptomycin, and 10% fetal bovine serum. Cells were routinely incubated at 37 °C and 5% CO2. Prior to testing, cells were stained with a Celltracker Green CMFDA dye, supplied by Invitrogen, Ireland (ab 492, em 517). 5-chloromethylfluorescein diacetate (CMFDA) is colorless and nonfluorescent until it reaches the center of a viable cell, therefore only living cells emit a fluorescent signal.
Testing and simulation
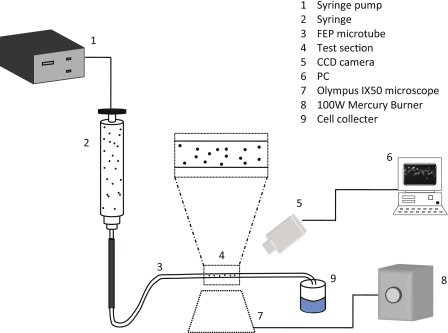
REH cells experiments were carried out using a 200 μm inner diameter (ID) Teflon fluorinated ethylene propylene (FEP) microtube (Upchurch Scientific, Oak Harbor, WA), which is introduced into a microchamber. To facilitate imaging, the chamber and outer surface are filled with an index matching liquid (mixture of water and glycerine). The cell culture media, RPMI 1640, containing cells were utilized as the working fluid and the flow was controlled by a syringe pump (Harvard Apparatus, UK). High velocity values can cause disruption of the cell membrane and lysis of the cell,24 therefore the flow rate used was 0.5 μl∕min, which provides an average velocity of 0.0264 cm∕s and a Reynolds number of 0.05, indicating laminar flow. The microchamber is placed on the top of an Olympus IX50 inverted stage microscope (Olympus, UK), as shown in Fig. 1, and the illumination beam is produced by a 100 W mercury burner, a continuous illumination source, emitting light across a bandwidth of 250–600 nm. Images of the cell flow are recorded using a CCD camera and analyzed with a MATLAB script, R2008a. A dispenser assembly is used to avoid cell aggregation and to inject a uniform number of cells per unit of time.
Figure 1.
Schematic showing the test facility composed of a CCD camera, an inverted stage microscope and a mercury burner.
Figure 2 shows a schematic of the microdevice used within this study for confocal experiments, with four inlets and one outlet. The device was manufactured from two layers using a soft lithographic method, with a base of polymethyl methacrylate (PMMA) and multiple depositions of SU-8 on top. The main channels are 380×400 μm2 in size and cells are injected from inlet B. For the application to the optical counting technique the sample flow is vertically focused by sheath flows A and C, with a small horizontal focusing effect applied by sheath flow D. CFD simulations showed that the spacing between channels B and C, specified at 500 μm, had no significant influence.
Figure 2.
(a) Schematic representation of the microdevice used for vertical focusing, (b) with one sample inlet, three sheath flow inlets (A, C, and D), and (e) one outlet. Channels’ dimensions: H=380 μm, W=400 μm, and L=200 μm. The spacing between channels B and C is 500 μm. (b) Photograph of the manufactured device.
Confocal images were performed on the microdevice for hydrodynamic focusing experiments using an inverted confocal laser scanning microscope (LSM710, Zeiss, Inc., Thornwood, NY). The microscope was equipped with a 1 mW helium neon laser (543 nm) and a 25 mW argon laser (488 nm). The first excitation source was used to visualize the sample fluid. The second excitation source was used to visualize the walls of the microdevice made of SU-8, to give a reference of the position of the sample in the channel. Cross-sectional images of the microchannels were scanned using a 10× [numerical aperture (NA) of 0.30] objective lens. Images were acquired at a resolution of 1024×1024 pixels and 410 μm sectioning was scanned at 4 μm per z-sectioning step. The sample fluid contained 10 μM dextran conjugated AlexaFluor-555 (Invitrogen) in de-ionized (DI) water, and DI water was used for the sheath fluids. Confocal images were compared to CFD simulations performed with COMSOL MULTIPHYSICS 3.4 using the incompressible Navier–Stokes and diffusion modules.
Optical counting technique
The standard biological counting technique is the Trypan Blue exclusion assay.2 The protocol of the Trypan Blue assay consists of a series of steps: First, preparation of a cell suspension of the cells to be assayed (about 106 cells∕ml). A 1:1 dilution of the suspension mixed with 0.4% Trypan Blue is then loaded onto the counting chambers of a hemocytometer (Bright-Line, Hausser Scientific, Horsham, PA) and the number of stained cells and total number of cells are counted. The calculated percentage of unstained cells represents the percentage of viable cells on the suspension.
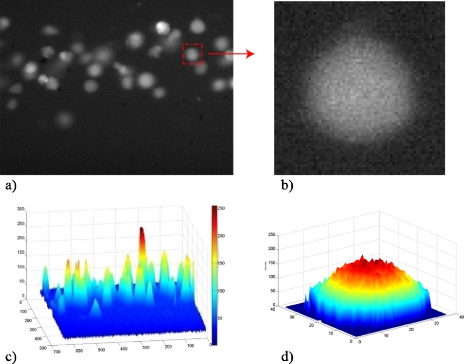
Alternatively, on the method proposed, cell quantification is derived from an intensity count of the image using a MATLAB script. The different steps required to obtain the cell quantification are shown in Fig. 3, where (a) and (b) are the original images taken by the camera and (c) and (d) are the pixel intensity of (a) and (b). A load of cells at a concentration of 2×10⁶ cells∕ml is injected into the tube. A sequence of frames is recorded using a CCD camera at a sampling frequency of 30 Hz and exposure time of 33 333 μs. The image resolution is 640×480 pixels, corresponding to a field of view of 364×300 μm2 with a 10× objective lens. The original image is converted into a pixel intensity image and a threshold is applied to remove background noise and irregularities. The total fluorescent intensity of the image is calculated by summing the intensity of every pixel in the image. The total fluorescent intensity value is then divided by the average intensity of a single cell to give the number of cells in that particular image. The average fluorescent intensity of a single cell is found by converting an original image of a cell, Fig. 3b into a pixel intensity image, Fig. 3d. Due to the variability in size and shape of cells in motion, as described in Sec. 3, this count is repeated three times, considering cells of different dimensions, and the mean value is taken. This technique allows the number of cells in the field of view of the camera to be determined at regular time intervals. This can be done because the average velocity with which the cells travel through the field of view is known. On average it takes 1.5 s for the cells to pass through the field of view. By taking 45 frames at a frame rate of 30 Hz (i.e., 1.5 s), the average number of cells passing through the field of view can be found for this time interval by taking the average number of cells in each of the 45 frames. This approach takes into consideration both the size and the intensity of the cell.
Figure 3.
Counting technique: (a) Fluorescent image of the flowing cells, (b) zoom on a single cell of the same image, (c) pixel intensity image, and (d) intensity of a single cell.
In a laminar regime, due to the parabolic velocity distribution, cells at different z position in the tube have different velocity magnitude; hence two cells can be overlapped within the flow, resulting as a single cell twice brighter than the others. The method, considering both pixels and intensities, is able to count the two separated cells even if they are overlapped, as shown from the comparison of Figs. 3a, 3c. Figure 3c also shows the wide range of pixels intensity associated to the cells due to their different vertical position in the channel. If the distribution of pixel intensity of the different cells is too broad, the linear superposition of individual cell intensity is invalidated. By reducing the z distribution of the cells activating only the vertical focusing of the microdevice, the measurement accuracy should improve.
RESULTS AND DISCUSSION
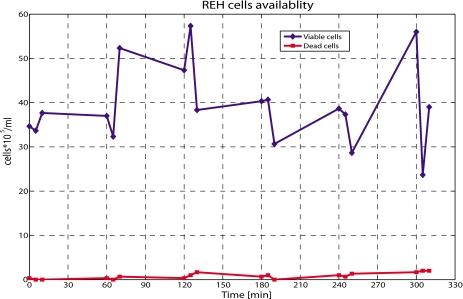
Discussed first is the validation of the Trypan Blue exclusion assay, shown in Fig. 4 where the cell availability is calculated from a manual count. REH cells were injected into a 200 μm ID microtube at 0.5 μl∕min, and every 60 min, for 5 h, one sample was collected at the outlet and counted in triplicate using a hemocytometer. Variability of approximately 50% was found from the triplicate measurement belonging to the same sample. Even if the mean value was relatively constant, the fluctuation was significant. Moreover, the exact concentration of cells cannot be quantified. Results also show that viability is not an issue, as the concentration of dead cells, i.e., not fluorescing cells, is negligible. This suggests that the shear force exerted by the flow on the cells is insufficient to cause lysis. For these reasons, availability of cells, rather than viability is an issue, and in the following, viability will not be considered. The results only give a rough approximation of the number of cells present in the sample taken from the cell preparation, before or after the injection. This indicates that a different methodology should be used to quantify the number of cells under test.
Figure 4.
Plot of cell availability with time. Test performed using the Trypan Blue exclusion assay. Cells are collected at the outlet of a microtube and quantified in triplicate every hour. Variability from 15% to 50% is obtained at every time step. On the x axis the exact time when the samples were collected is indicated.
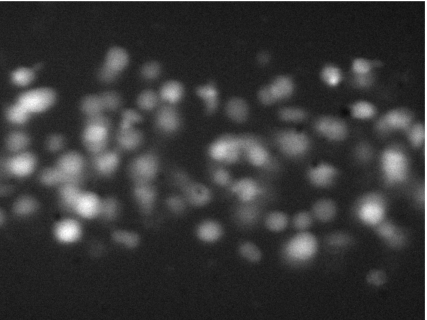
The approach proposed, as opposed to the manual technique, is based on the analysis of recorded images of cells in motion. Figure 5 shows a typical fluorescent image of the moving cells. The fluorescent intensity of the cells is not constant, which is attributed to the following two factors.
Cells can be sited at different vertical positions in the tube and their intensity varies with the location.
The intensity of overlapped cells is the linear superposition of their individual intensity.
Figure 5.
The different intensities associated to the cells flowing into the microtube. Brightest cells are caused by overlapped cells in the flow.
In most studies cells are simplified as spherical particles, but their shape and size can change due to different reasons, such as the cell cycle phase or the flow rate imposed. Loiko et al.25 gave a statistical distribution of the B-cells size using a flow cytometric technique. On the analysis of over 3000 lymphocytes (B and T cells), the size varied in the range from 4.8 to 12.0 μm. The mean value was found to be 7.8 μm, with a standard deviation of 0.7 μm. A pixel count of the acquired images confirmed similar values: B cell size ranging from 12 to 26 pixels, equal to 6.5–14 μm.
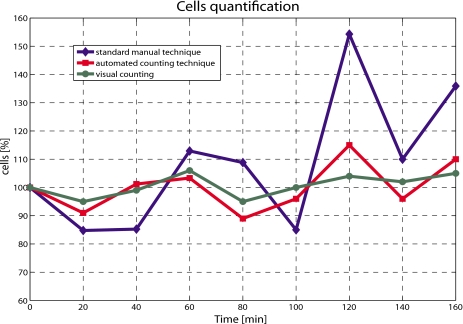
The cell count obtained using the automated technique is compared to both the manual approach and to the visual count of the cells from the digital picture, and the results are shown in Fig. 6. Results from the manual technique are again acquired every 20 min for 3 h, and the average of the three values is plotted against time. Visual manual counting is considered most accurate owing to the “unbeatable combination of the human eye and brain,”26 but is time consuming and not practical. To compare together the different results obtained from different tests, all the experimental profiles were normalized with respect to the initial concentration at time zero, before injection.
Figure 6.
Comparison between standard and automated counting techniques. Visual counting served as reference.
The method proposed shows an average error of 4.7%, with a maximum value equal to 11% obtained after 2 h. Moreover, for the first hour, the scatter is lower than 3%, giving sufficient time for a test to be run on the cells. On the other end, the average error associated to the manual technique is ≈18.7%, with a maximum value of approximately 51%. The automated and the manual techniques also vary in trend, where the automated approach follows the trend of the visual counting, as opposed to the manual which varies significantly. After the first hour, size and shape of the cells introduce an additional effect on the measurements. Due to the continuous stress applied by the syringe pump and the time spent out of the ideal growing conditions, size and shape distributions change much more, hence influencing the cell detection. Moreover, due to the physical properties of the cells, their distribution along the tube is not constant with time.
As previously mentioned, the intensity of overlapped cells is the linear superposition of their individual intensity. However, if more than three cells overlap, saturation of the pixel occurs. The fluorescent intensity of four cells overlapped, for instance, is the same of that of three cells. The use of a sensor with a different response, such as a complementary metal-oxide-semiconductor (CMOS) sensor with a LinLog curve may overcome this problem. In addition, the distribution of B-lymphoid cells along the full height of the microtube increases the range of fluorescent intensities, as seen in Fig. 3c. Out of focus cells, up to 100 μm from the center of the tube, reduce the reliability of the automated method and increase the measurement error, hence this should be avoided. The fluorescent intensity of in focus cells can be two times greater than the fluorescent intensity of cells on top or bottom of the tube. To solve both issues, the width of focus of the stream of cells can be reduced. The application of vertical hydrodynamic focusing,23 using the microdevice described in Sec. 2C, to the automated counting technique should reduce the error associated to the method. Furthermore, many detection devices are often unable to detect cells if their depth in the sample is out of the focal plane; those cells generate background noise and reduce the signal-to-noise ratio. In the classical 2D focusing, cells are often compressed horizontally; therefore, they can overlap on the vertical dimension and result in a wide range of cell intensity. In order to reach a high throughput and the best performance, it is important to maximize the number of cells per image within the smallest z displacement, thereby vertical focusing is an ideal solution.
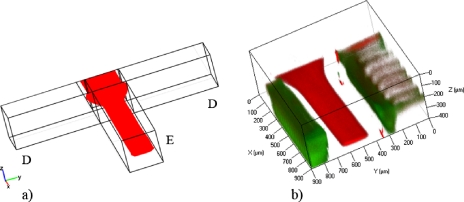
Confocal experiments have been carried out to validate the use of the microdevice with the optical counting technique, and results are in good agreement with the CFD simulations. Size and position of the focused profile downstream the intersection with channel D are shown in Fig. 7, where the three-dimensional (3D) views of CFD (a) and confocal (b) images are compared. The sample, in red, was vertically focused by the sheath fluids A and C, and then horizontally focused by sheath flow D, following the principle introduced by Chang et al.27 In green, the walls of the microchannel are shown.
Figure 7.
3D view of the vertical focusing into the microdevice: (a) CFD simulation and (b) confocal image. Both images are acquired downstream of the intersection with channel D.
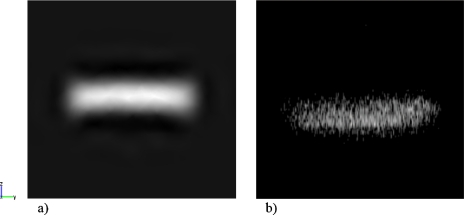
The size of the focused stream after the vertical focusing process is approximately 68 μm, 18% of the entire channel height, Fig. 8. The cross sectional profiles in Figs. 8a, 8b differ for the position of the center of the focused stream, which was shifted down the vertical axis in (b). Flow rates used for both simulations and experiments were Qa=Qc=7 μl∕min, Qb=1 μl∕min, and Qd=2 μl∕min, with a velocity in main channel E of 0.186 cm∕s, which is a velocity achieved in most microflow cytometers.7, 28 By varying the flow rate ratios of sample and sheath fluids, the size of the focused profile can be controlled and therefore the throughput of the optical counting technique. An optimum can be found for a specific application between less focusing∕more cells and more focusing∕less error associated with the method. For the values used within these experiments, the throughput is around 100–200 cells∕s, based on the delivered flow rate from the dispenser and the cell density determined over the measurement volume (i.e., from a cell count per unit volume). The density of cells being delivered is higher than expected based on the cell dilution in the dispenser and is caused by cell sedimentation in the dispenser device. The range is consistent with the operation of Nieuwenhuis et al.,6 who used hydrodynamic focusing in a microfluidic Coulter counter. Their upper flow rate limit was 10 μl∕s at which stage unstable flow occurred. The present device is similarly restricted but can operate at lower flow rates than the minimum 0.5 μl∕s limit in the equivalent Coulter device. This is because the technique is not influenced by ion diffusion. The throughput is lower than dielectrophoretic devices, such as that of Cheng et al.7 who achieved a throughput of approximately 500 cells∕s in sorting a mixture of three bacterial strains. The present device, however, has been demonstrated to count only one cell type, but this is achieved with a less complex manufacture, negating the need for embedded electrodes, and using a readily implemented optical setup to interface with the device.
Figure 8.
Cross sections of the vertical focused stream in channel E, downstream the intersection with channel D for Qa=Qc=7 μl∕min, Qb=1 μl∕min, and Qd=2 μl∕min: (a) CFD simulation and (b) confocal image. A small horizontal focusing effect is applied. The size of the focused sample is 68 μm in height and 300 μm in width.
CONCLUSIONS
An automated optical counting technique was developed to efficiently quantify the number of cells being investigated. REH, B-lymphoid precursor leukemia, are used within this study and frames of moving cells are recorded using a CCD camera. The method is based on a pixel intensity count of cells in motion in a digital image and presents an averaged uncertainty of 4.7%, compared to the Trypan Blue assay, with an error margin of 18.7% observed by this study on replicate counting. Visual manual count of the cells from the digital picture is used as reference. The efficiency of the method can be further improved with the application of a microdevice for vertical hydrodynamic focusing, which will reduce the range of cell intensity and the risk of overlapped cells. An 82% reduction in the vertical distribution of the cells was found for the flow rate imposed. By varying the flow rate ratios of sample and sheath fluids, the size of the focused stream can be controlled and therefore, the throughput of the optical counting technique. For the values used within these experiments, the throughput is around 100–200 cells∕s. This device can also be integrated upstream a detection system, such a microflow cytometer, and will add the potential to accurately and reliably quantify and analyze the cells being delivered.
ACKNOWLEDGMENTS
The authors gratefully acknowledge Dr. Kevin Nolan for his help with the development of this technique and the European Commission under the Marie Curie Early Stage Training Fellowship (Grant No. MEST-CT-2004-505101) and the Mid-Western Cancer Foundation, Limerick, Ireland for their financial support.
References
- Dittrich P. S. and Manz A., Nat. Rev. Drug Discovery 5, 210 (2006). 10.1038/nrd1985 [DOI] [PubMed] [Google Scholar]
- Freshney R. I., Culture of Animal Cells: A Manual of Basic Technique (Wiley-Liss, New York, 1994). [Google Scholar]
- Coulter W., U.S. Patent No. 2,656,508 (1953).
- Gawad S., Schild L., and Renaud P., Lab Chip 1, 76 (2001). 10.1039/b103933b [DOI] [PubMed] [Google Scholar]
- Zhe J., Jagtiani A., Dutta P., Hu J., and Carletta J., J. Micromech. Microeng. 17, 304 (2007). 10.1088/0960-1317/17/2/017 [DOI] [Google Scholar]
- Nieuwenhuis J. H., Kohl F., Bastemeijer J., Sarro P. M., and Vellekoop M. J., Sens. Actuators B 102, 44 (2004). 10.1016/j.snb.2003.10.017 [DOI] [Google Scholar]
- Cheng I. F., Chang H. C., Hou D., and Chang H. C., Biomicrofluidics 1, 021503 (2007). 10.1063/1.2723669 [DOI] [Google Scholar]
- Ma H., Jiang L., Shi W., Qin J., and Lin B., Biomicrofluidics 3, 044114 (2009). 10.1063/1.3274313 [DOI] [PMC free article] [PubMed] [Google Scholar]
- Dong G., Ray N., and Acton S. T., IEEE Trans. Med. Imaging 24, 910 (2005). 10.1109/TMI.2005.846856 [DOI] [PubMed] [Google Scholar]
- Ray N., Acton S. T., and Ley K., IEEE Trans. Med. Imaging 21, 1222 (2002). 10.1109/TMI.2002.806291 [DOI] [PubMed] [Google Scholar]
- Anderson C. M., Georgiou G. N., Morrison I. E. G., Stevenson G. V. W., and Cherry R. J., J. Cell. Sci. 101, 415 (1992). [DOI] [PubMed] [Google Scholar]
- Boyer M., Tarjan D., Acton S. T., and Skadron K., 23rd International Parallel and Distributed Processing Symposium, Rome, 2009.
- Phukpattaranont P. and Boonyaphiphat P., ECTI Trans. on Electrical Eng., Electronics and Communication 5, 158 (2007). [Google Scholar]
- Sizto N. L. and Dietz L. J., U.S. Patent No. 5,556,764 (1996).
- Lin C. H. and Lee G. B., J. Micromech. Microeng. 13, 447 (2003). 10.1088/0960-1317/13/3/315 [DOI] [Google Scholar]
- Wolff A., Perch-Nielsen I. R., Larsen U. D., Friis P., Goranovic G., Poulsen C. R., Kutter J. P., and Telleman P., Lab Chip 3, 22 (2003). 10.1039/b209333b [DOI] [PubMed] [Google Scholar]
- Mielnik M. and Saetran L., Exp. Fluids 41, 155 (2006). 10.1007/s00348-005-0103-8 [DOI] [Google Scholar]
- Crosland-Taylor P. J., Nature (London) 171, 37 (1953). 10.1038/171037b0 [DOI] [PubMed] [Google Scholar]
- Walsh P. A., Walsh E. J., and Davies M. R. D., Int. J. Heat Fluid Flow 28, 44 (2007). 10.1016/j.ijheatfluidflow.2006.05.006 [DOI] [Google Scholar]
- Knight J. B., Vishwanath A., Brody J. P., and Austin R. H., Phys. Rev. Lett. 80, 3863 (1998). 10.1103/PhysRevLett.80.3863 [DOI] [Google Scholar]
- Lee G. -B., Chang C. -C., Huang S. -B., and Yang R. -J., J. Micromech. Microeng. 16, 1024 (2006). 10.1088/0960-1317/16/5/020 [DOI] [Google Scholar]
- Simonnet C. and Groisman A., Appl. Phys. Lett. 87, 114104 (2005). 10.1063/1.2046729 [DOI] [Google Scholar]
- Lin T. A., Hosoi A. E., and Ehrlich D. J., Biomicrofluidics 3, 014101 (2009). 10.1063/1.3055278 [DOI] [PMC free article] [PubMed] [Google Scholar]
- Recktenwald D. and Radbruch A., Cell Separation Methods and Applications (Dekker, New York, 1997). [Google Scholar]
- Loiko V. A., Ruban G. I., Gritsai O. A., Gruzdev A. D., Kosmacheva S. M., Goncharova N. V., and Miskevich A. A., J. Quant. Spectrosc. Radiat. Transf. 102, 73 (2006). 10.1016/j.jqsrt.2006.02.069 [DOI] [Google Scholar]
- Cloud G. L., Optical Methods of Engineering Analysis, 1st ed. (Cambridge University Press, New York, 1995). 10.1017/CBO9780511575013 [DOI] [Google Scholar]
- Chang C. C., Huang Z. X., and Yang R. J., J. Micromech. Microeng. 17, 1479 (2007). 10.1088/0960-1317/17/8/009 [DOI] [Google Scholar]
- Lee G. B., Lin C. H., and Chang S. C., J. Micromech. Microeng. 15, 447 (2005). 10.1088/0960-1317/15/3/004 [DOI] [Google Scholar]


