Abstract
We describe design and miniaturization of a polymeric optical interface for flow monitoring in biomicrofluidics applications based on polydimethylsiloxane technology, providing optical transparency and compatibility with biological tissues. Design and ray tracing simulation are presented as well as device realization and optical analysis of flow dynamics in microscopic blood vessels. Optics characterization of this polymeric microinterface in dynamic experimental conditions provides a proof of concept for the application of the device to two-phase flow monitoring in both in vitro experiments and in vivo microcirculation investigations. This technology supports the study of in vitro and in vivo microfluidic systems. It yields simultaneous optical measurements, allowing for continuous monitoring of flow. This development, integrating a well-known and widely used optical flow monitoring systems, provides a disposable interface between live mammalian tissues and microfluidic devices making them accessible to detection∕processing technology, in support or replacing standard intravital microscopy.
INTRODUCTION
Phenomena occurring in microfluidic devices, such as DNA processing,1 particle encapsulation,2 fluids mixing,3 or analysis of in vivo conditions, such as red blood cell (RBC) flow,4 platelet motion5 in the microcirculation, involve the visualization of cells, gas bubbles, or liquid droplet transport through micrometric channels. The need therefore arises for accurate two-phase flow characterization at the microscale level, requiring noninvasiveness and real-time performance.
Developments in microfluidics have resulted in a wide range of flow diagnostics techniques, in part based on the analysis of dynamics of optical properties of two-phase fluid flow. Monitoring issues concern temporal dynamics of particles, bubbles or droplets, velocity, and spatial flow distribution in microchannels.
Local flow information or two-dimensional (2D) flow profiles (dynamic images) can be obtained by means of standard optoelectronic technology for the magnification and acquisition of images and the analysis of optical signals. The applicability of this approach has been expanded by recent microtechnology developments in miniaturization of optical components leading to the implementation of micro-optofluidics. This utilizes integrated devices including microfluidic networks for handling fluids and particles, and micro-optics designed ad hoc for optical data acquisition.6, 7
Both technologies utilize automated measurement techniques to extract flow information to characterize two-phase flow or, in general, particle flow in microchannels. The optical Doppler intravital velocimetry, both in standard8 and in micro-optics solutions,6 is used in microfluidic channels of all sizes, although it presents difficulties in measuring flow in microchannels located in different layers, and may yield average readings over an imprecise number of microvessels. Another method for pointwise flow detection, the dual slit methodology, is based on the optical properties of the fluids components.9 This technique exploits the optical contrast between different phases of the fluids, or between fluids and particles, and is used for measuring the transit time between two optical windows of particles [i.e., RBCs)] or, in general, of two-phase fluids. It yields flow velocity on a single channel∕vessel with a spatial resolution, which is flexible and dependent on the characteristics of the optical setup. Moreover, compared to other methodologies, the implementation of the dual-slit method is based on a relatively simple experimental setup, involving optical magnification, detection (photodetectors), and processing units performing cross-correlation between signals; this renders it suitable for real-time velocity evaluation in in vitro devices and in experimental animal preparation.10
Methods generating 2D profiles of microfluidic flow are also considered suitable for characterizing spatiotemporal dynamics in the microfluidics environment. An example of these techniques based on the Doppler principle, enhanced high resolution-laser Doppler imaging, performs flow measurements using the principle of light scattering and the spectral analysis of the scattered signal.11, 12 An alternative method is particle imaging velocimetry (PIV) algorithms, a CPU-based implementation applied to digital images acquired by a high speed digital camera. PIV assesses particle flow velocity profiles and has been used extensively in experimental fluid mechanics.13, 14 Real-time image processing based on parallel analog processing (cellular nonlinear networks) has also been found to be suitable for microfluidic environment characterization.15
These techniques are based on optical access to the fluid under study: They require optical magnification interfaces, i.e., standard microscopy, in order to obtain the highest spatial and temporal velocity resolution and match with the dimensions of optic sensors. They may also need a complex experimental setup in order to obtain optical alignment to the microcirculation field and to allow simultaneous measurements, such as oxygen distribution,16 together with morphological analyses, such as vessel network functional density and dynamic vessel diameter.17
Conversely, micro-optic technologies offer direct access to optical information since their characteristic sizes match with the microfluidic phenomena ones. Examples are optical interferometry for flow detection,7 the miniaturization of laser Doppler velocimetry,6 or devices implementing different microfluidic analyses, such as immunoassay using chromatography and other optical characterization for fluids and particle chemical properties.1, 2 Such applications present advanced methodologies and technologies, which are, however, rigidly coupled to the microfluidic structures because these are embedded in the same chip.
The modular optical design and technological solution proposed here are suitable for a wide range of microfluidic geometries and applications. It consists in disposable polymer-based optical interfaces that may be applied directly to the microfluidic process in both in vivo and in vitro experimentation,18 in order to permit single channel∕vessel flow characterization. It exploits the optical properties of polymers and integrates microgeometries of fiber optics and optical detectors.19, 20, 21
Moreover, such a design, compared to others, responds to the practical need for a disposable optical interface which, superimposed on the microfluidic sample, either in vitro or in vivo, allows other optical measurements to be performed simultaneously without interfering with their experimental setup.
This paper describes the design and testing of a micro-optical interface implemented for flow dynamics characterization in in vitro and in vivo microfluidic environments. The device is based on single layer polydimethylsiloxane (PDMS) technology22, 23 and is biologically compatible. Its design would provide a practical solution for integration and bidirectional optical interaction and light guiding in the microfluidic processes, both being a source and a detector interface.
THE MICRO-OPTICAL INTERFACE: DESIGN AND FABRICATION
The aim of this design is to detect optical information and to leave the area under observation accessible to other types of optical processing and analysis. The device is based on a low cost material, PDMS, known for its biocompatibility and high optical transmittance in the UV-near infrared (UV-NIR) region.
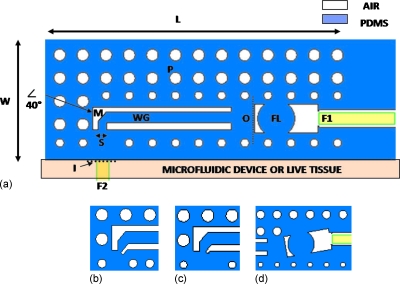
The design of the micro-optical interface (Fig. 1) includes an optical slit (S), a mirror (M) angled at 40°, a PDMS∕air total internal reflection (TIR) waveguide (WG), a biconvex lens (FL), and a fiber optic self-alignment system (F1), as described in Fig. 1a. PDMS cylinders, called here as pillars (P), surround the entire device in order to protect the functional part, consisting in the slit and mirror, from environmental light, while providing it with mechanical robustness. Such a configuration would allow work at any angle of light direction, being mechanically robust and having a reproducible fiber optics self-alignment system. The air∕PDMS structure of the device makes it transparent and, therefore, makes both the microfluidic area for the in vitro and the live tissue optically accessible by simply changing the observation focal plane. Moreover, design variations are shown in Figs. 1b, 1c, 1d.
Figure 1.
Section of the device (with L=2.5 mm, W=1 mm and with thickness T=120 μm). S is the slit (70 μm). M is the 40° mirror; WG is the TIR optical waveguides (100 μm width). FL is the biconvex focusing lens (160 μm radius of curvature). F1 is the fiber optic insertion and self-alignment system (125 μm diameter). F2 is the fiber optic positioned in front of the slit. P is the pillar mirror. O is the output surface. I is the input surface. [(b) and (c)] Variations in the slit design with slit orientation angle at 40°. (b) S=25 μm and (c) S=50 μm. (d) Variation in the orientation of the FL according to the angle of the rays coming from the waveguide.
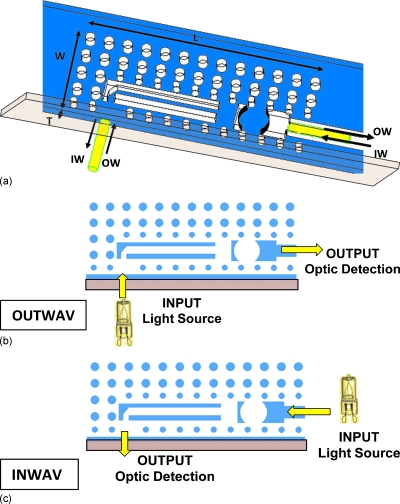
The structure has two functional configurations [Fig. 2a] allowing light guiding for bidirectional interaction as detection or as source interface between the device and the microfluidic environment.
Figure 2.
Micro-optic interface functional configurations. (a) 3D view of the device and of the direction of the optical information. (b) OW configuration. (c) IW configuration.
The first configuration, outwav (OW), is the interface between the microfluidic flow target to be analyzed and the detectors [Fig. 2b]. The second functional configuration, inwav (IW), converts the device into an interface between a light source and a target [Fig. 2c].
Light path
OUTWAV
The optical information is generated by a light source (F2) that backlights the area under analysis and is captured inside the slit (“S”=70 μm). Light is reflected by the micro-air-mirror (M) (angled at 40°) and is confined in the waveguide (WG), which directs it toward the output fiber optic insertion (F1) passing through a focusing biconvex lens (FL) to correct the numerical aperture (NA) of the rays and make them suitable for fiber optics detection (F1).
INWAV
The light can be emitted by any source and then inserted through fiber optics into the alignment system insertion (F1). The light is guided through the waveguide (WG) and then mirrored (M) in the direction of the targeted microfluidic system through the slit (S).
Design variations
In the detection configuration (OW), the slit size can be designed to regulate the amount of light that the device can capture. Figures 1b, 1c represent two variations in the size and geometry of the basic slit design in Fig. 1a. In these variations, the slits are smaller [(b) S=25 μm and (c) S=50 μm] and are tilted at an angle of 40° in order to be selective and to reflect away the beam of light not coming from the microfluidic spot to be measured. Further design variations are possible for the OW configuration, in order to optimize the collection of light by the focusing lens (FL) and by the fiber optic positioned in the alignment system (F1). The orientation of this lens [Fig. 1d] can be designed in accordance with the angle of the light beam coming from the waveguide.
Fabrication
The device was fabricated through soft lithography22 using SU8 masters, as described elsewhere.23, 24 Additionally, in this work, the technological simplicity was kept to one photolithographic level.23 Scanning electron microscope (SEM) pictures of the SU8 master (thickness of 120 μm) are shown in Fig. 3. In particular, the walls of the critical optical components, such as the mirror [Fig. 3b] and the lenses [Fig. 3c], are required to be smooth and straight, in order to avoid undesired light scattering when replicating this master in PDMS.
Figure 3.
SEM image of the SU8 master with 120 μm thickness and slit S=70 μm. (a) Picture of the entire functional geometry. (b) Details of the slit (S=70 μm) and of the mirror (M). (c) Details on the focusing lens (FL).
EXPERIMENTAL CHARACTERIZATIONS AND OPTICAL OPTIMIZATION
Experimental measurements were performed for static characterization and the results were compared to the ray tracing simulations (TracePro®, Lambda Research Corp., Littleton, MA ).
The simulated ray-traced light path was determined for both configurations, considering the OW as a detector interface and the IW as a light source interface. In the simulation, the source fiber optics were approximated with a cone of light with NA=0.22 and a source area corresponding to the core size with diameter of 105 μm. Results shown in this section, in Figs. 457, represent the light rays that have a power of at least 70% of the source power and that are incident on the output surface.
Figure 4.
Static optical characterization for PDMS device in OW configuration (S=70 μm and thickness T=120 μm). (a) Ray tracing simulation of the light path. (b) Picture of the light path on the PDMS device.
Figure 5.
Static optical characterization for PDMS device in IW configuration (S=70 μm and thickness T=120 μm). (a) Ray tracing simulation of the light path (only rays with a power of at least 70% of the source power). (b) Picture of the light path on the PDMS device.
Figure 7.
Ray tracing simulation for OW configuration with slit sizes (a) S=25 μm and (b) S=50 μm with tilted slit, and (c) S=70 μm with straight slit.
The experimental setup consists of a tungsten halogen lamp used as light source (Ocean Optics, H-2000, Dunedin, FL), the light being inserted into the device through a multimode fiber optic with a core diameter of 105 μm and NA=0.22 (M15L01 SMA-SMA Fiber Patch Cable, Thorlabs, Dachau∕Munich, Germany); a second identical fiber optics was used as light collector. The positions of the fiber optics acting as source and as light collector are described in Figs. 2b, 2c according to the configurations used (OW and IW). The experimental photographs of the light path can be interpreted considering the fact that the light spots visible to the camera are the ones related to light, which is not guided, while the areas where light propagation is not visible are the ones where light is properly guided toward the output.
Light path
OUTWAV
The OW configuration simulation [Fig. 4a] shows that only the fraction of light from the source (F2) that passes through the slit is captured and then mirrored. It is then confined inside the waveguide and projected on the focusing lens, and directed to the output fiber optic (F1) with the appropriate NA.
The OW experimental path in Fig. 4b shows, in accordance with the simulation, how the light coming from the source fiber optics (F2) is selected and captured by the slit (S), then reflected and bent by the mirror (M) and confined in the waveguide (WG) reaching the output surface (O) at a specific angle. The lens (FL) then focuses and redirects light to the output fiber optics (F1).
INWAV
Conversely, simulation of the IW source interface configuration [Fig. 5a] shows how light coming from the fiber optics (F1) is focused and coupled into the waveguide by the focusing lens and subsequently redirected by the mirror, at an angle close to 90°.
The IW configuration experiment in Fig. 5b shows the inverse path of light coming from the source in F1, focused and confined in the WG by the lens FL. According to the simulation, part of the light is reflected by the mirror (M) toward the slit (S) and toward surface I of the fiber optics F2 at a specific angle.
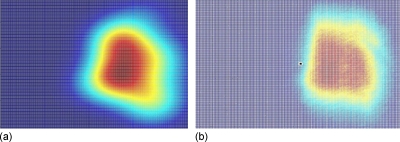
As an additional analysis of the device design in the IW configuration, a simulated near field of the light emerging from the slit [surface I in Fig. 1a] is shown in Fig. 6a. It can be seen that the predicted profile has an approximately rectangular shape corresponding to the thickness T and slit size S (120×70 μm2). This was experimentally visualized by means of an objective (10×) positioned on surface I to capture and magnify the light coming from the slit and projected onto a charge coupled device (CCD) array (Pixelfly, PCO Imaging, Kelheim, Germany). Figure 6b shows a normalized spatial profile in a color-coded 2D visualization consistent with simulation of the near field profile.
Figure 6.
Color-coded light spatial profile on surface I [Fig. 1a] for IW configuration. (a) Ray tracing simulation. (b) Experimental light profile collected by a 10× objective and a CCD camera.
Design optimization
Simulations were performed to optimize parameters, such as the orientation angle of the slit in design variations [Figs. 1b, 1c] and the tilting angle for the lens FL. In particular, we show simulation light paths for a variation in the design considered to regulate the amount of light captured by the slit. The configurations shown in Fig. 7 include the slit sizes (a) S=25 μm and (b) S=50 μm with slit tilting angle at 40° [Fig. 1b] and the (c) S=70 μm with straight slit. The slit angle allows for a more efficient rejection of rays. The input rays are, in fact, reflected out with a certain angle instead of being transmitted as in the case of a regular slit with no angle of tilting.
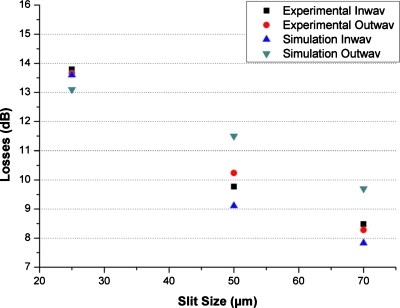
In addition, static measurements on the efficiency of the light collection were performed and total losses in the OW and IW were measured. The losses were calculated by comparing the power of the light rays, incident to the output fiber optic with the power of the light beam coming from the source fiber optics. The losses thus take into account the selectivity of the slits and, therefore, the losses graph shows a clearly decreasing trend when the slit size increases (Fig. 8). This confirms the result that the slit is selective to light and filters out unwanted information. The simulation and the experimental results are consistent. Slight differences might be due to the fact that in simulation, the geometries are ideal with sharp corners, while in the PDMS devices, the geometric angles are smoothed due to soft-lithography fabrication limitations.
Figure 8.
Losses (dB) vs the slit size: experimental and simulated.
DYNAMIC OPTIC RESPONSE TOWARD FLOW MONITORING
The static optical characterization permits assessment of the efficacy of the proposed micro-optical device, both as a detector and as a source interface, in the microfluidics environment. Results are presented here for the dynamic characterization of two-phase flow in both the in vitro and the in vivo experimental setups in relation to the OW configuration.
In vitro microfluidics flow detection
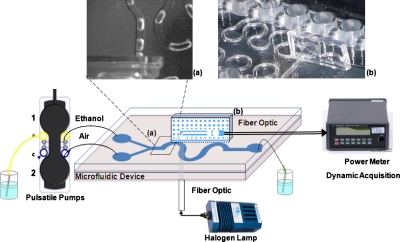
The dynamic response of the device as detector interface (OW configuration) was tested, measuring light variation due to air bubble passage in ethanol in a microfluidic mixer.
A diagram of the setup for dynamic two-phase flow detection is shown in Fig. 9. It consists of a microfluidic y-junction serpentine mixer with 640×640 μm2 section (SnakeMix Slide, ThinXXS, Zweibrücken, Germany), whose inputs are connected to two pulsatile piezoelectric pumps (TwinPump Slide, ThinXXS, Zweibrücken, Germany) injecting ethanol and air, respectively. A white tungsten halogen lamp was used as light source (LH-2000, Ocean Optics) and the light was projected onto the microfluidic device through a multimode fiber optic with a core diameter of 105 μm and NA=0.22 (M15L01 SMA-SMA Fiber Patch Cable, Thorlabs); a second identical fiber optic was used as light collector and then connected to a power-meter (model 1930 F-SL, Newport, Irvine, CA) for light power detection. Details of the experimental setup are shown in Figs. 9a, 9b.
Figure 9.
Experimental setup for dynamic characterization of two-phase flow in a microfluidic device. Photographs of details in (a) upper view of the two-phase ethanol/air flow in the microfluidic device; (b) the micro-optic interface in the OW configuration positioned on the microfluidic mixer.
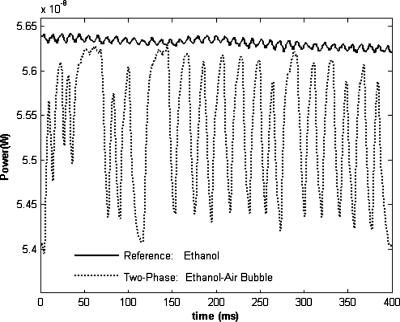
The dynamically recorded light power variation due to the bubble passage is shown in Fig. 10. The comparison between a reference experiment with a single-phase flow (ethanol) into the channel, and a two-phase flow (ethanol-air) experiment, shows the ability of the device to detect optical fluctuations with a signal to noise ratio S∕N∼16 dB and its suitability for multiphase flow detection and characterization.
Figure 10.
Light power dynamic response due to the bubble flow measured by the power meter.
Toward in vivo microcirculation flow monitoring
Flow dynamics of blood in experimental microcirculation was evaluated to test the efficacy of the micro-optical interface in non-noise-controlled environments, as an alternative to standard microscopy.
The microcirculation was observed in surgical animal preparations.25, 26Optical access to microvessels was obtained through a transparent window chamber surgically implemented in the dorsum of hamsters (skinfold chamber). Fur was removed as well as some of the skin layers in order to make the skinfold transparent to light and suitable for in vivo microvascular experimentation. The hamster is placed in a tube to minimize movements and the tube is fixed to the stage under the microscope objective.
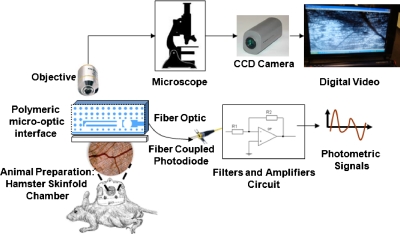
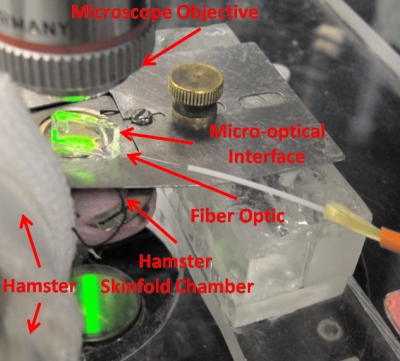
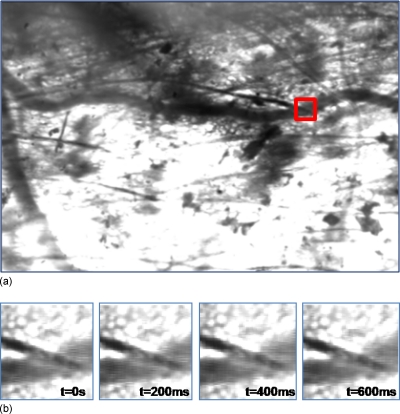
Observation of the transilluminated animal tissue was simultaneously performed by means of intravital standard microscopy and by positioning the polymeric microinterface on the tissue, as shown in Figs. 1112. The microscopic vision allowed dynamic recording of image sequences of microvessels through a CCD camera and supported the positioning process of the micro-optic device on the microvessel. A micromanipulator was used to position the device on a specific microvessel, and then removed to allow the measuring process to be performed (Fig. 12). The alignment of the optical interface with the microcirculatory location under observation is obtained by means of microscopic upper views of the microdevice superimposed on the live tissue and taken using different focuses. The variation in focus exploits the transparency characteristic of the polymeric technology, allowing visualization of the device during the positioning and aligning processes. Figure 13a shows the approximate position (red square is the region of interest) of the optical-interface slit. This setup allows the performance of simultaneous image recordings without interfering with optical measurements in the microcirculation field. The frame sequence [Fig. 13b] extracted from the video recording with intervals of 200 ms, and related to the region of interest, shows how the optical fluctuations are not visible to the naked eye.
Figure 11.
In vivo flow monitoring systems.
Figure 12.
In vivo flow monitoring system photograph. Micro-optical interface on live hamster tissue for the acquisition of photometric signals.
Figure 13.
Microcirculation fields under the polymeric device with digital 70×70 μm2 slit. (a) Entire frame and region of interest (red square). (b) Frame sequence related to the region of interest at intervals of 200 ms.
Optical signals from the polymeric microinterface, used as detector in the OW configuration and superimposed on the live tissue in correspondence to a microvessel, are acquired by connecting the output fiber optics (F1) to a fiber coupled photodiode detector [PDA100A Si visible-NIR (400–1100 nm), Thorlabs]. They are subsequently digitalized through an acquisition board (NI PCIMIO16E, National Instrument, Austin, TX, USA) and filtered using a low pass filter with a bandpass frequency of 40 Hz to reduce power line noise.
The microvessel under observation was simultaneously imaged by microscopy and dynamic video for flow dynamics characterization. Image processing was performed in order to obtain a dynamic optical intensity signal related to the region of interest, where the polymeric interface slit was positioned (red square on image in Fig. 13).
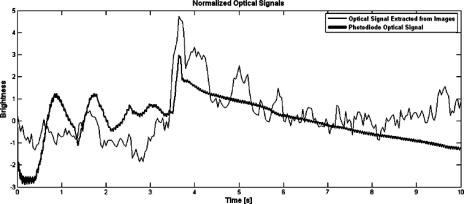
Figure 14 shows the result of comparing the photodiode signal from the micro-optical interface in OW configuration, and the optical signal obtained from the video by averaging the digital intensity information on the slit area (70×70 μm2). The bold line represents the photodiode signals and the thin line is the optical information obtained from the video, considering the sample rate as 30 Hz. For comparison purposes, both signals were postprocessed to obtain a zero mean and standard deviation equal to one.
Figure 14.
Comparison between the normalized optical signals resulting from photodiodes acquisition and the digital slit obtained from image sequence analysis.
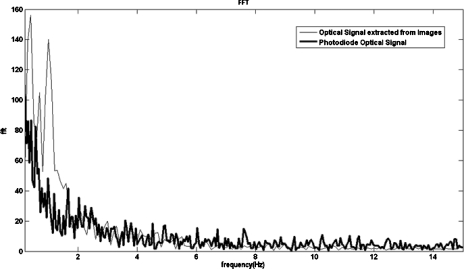
These signals provide information on the blood flow in the selected optical slit and other low frequency physiological phenomena, such as heart rate, vasomotion, and muscle activity. Both signals show oscillations at low frequencies, in the range between 0 and 10 Hz (Fig. 15).27
Figure 15.
Spectral components of the photodiode signal and of the time series extracted from the image sequence.
The effect of the natural movements usually present in in vivo tissue as well as other biological and instrumentation noises may be avoided by the improvement of the setup. Also, power line noise analog filters and a controlled transillumination light might be at the basis of a better discrimination of the blood flow signal over the background phenomena.
CONCLUSIONS
The design of the polymeric optical interfaces proposed here represents a miniaturization and optimization of standard optical setup designs that can be integrated in the implementation of flow monitoring systems in biomicrofluidics and that, in general, offer possibilities for new optical setups and technologies for monitoring and controlling microfluidic systems. The device designed presents two functional configurations allowing for bidirectional interaction, as a detector or as a source interface between the device and the microfluidic environment; it was fabricated using low-cost technology, requiring only one photolithographic step to define all its components.
The realization of the proposed device prototype provides a proof of concept and demonstrates its efficiency in both simulated and experimental tests, in in vitro and in vivo experimentations, for static optical characterization and for dynamic flow monitoring.
The polymeric micro-optic interface, exploiting an advanced configuration, includes light mirroring, guiding, focusing, and collimation, and aims to work at any angle of light direction, with a robust fiber optics self-alignment system, in order to leave the area under observation accessible to other types of optical processing and analysis. Furthermore, the air∕PDMS structure of the device makes it transparent and, therefore, renders both the microfluidic area for the in vitro and the live tissue optically accessible, simply by changing the focal plane for observation. Thanks to such features, the device design, compared to others, responds to the practical need for a disposable optical interface which, superimposed on the microfluidic sample, either in vitro or in vivo, allows other optical measurements, such oxygen concentration, functional capillary density, or other morphological measurements, to be performed simultaneously without interfering with their experimental setup.
Such a complete approach represents an advancement in solving issues related to interface to microfluidics. The design of these polymeric optical interfaces, in fact, makes them portable and easily attachable to microfluidic devices or to animal skin, thus providing the opportunity for a continuous monitoring of the flow processes, regardless of the experimental setup and disturbances. They would allow laboratories without specific or advanced optical equipment to start research activity on fluid and particle flow in microfluidic processes
Concluding, this paper is a proof of concept, demonstrating that the device is efficient and shows high signal to noise ratio in controlled conditions (in vitro dynamic experimentation); it also presents encouraging results, however, in the extremely noisy in vivo environment. We consider these results, along with the idea of integrating two or more interfaces for dual slit method implementation, a significant basis for continuing work in this direction toward a surely ambitious target of flow monitoring in an in vivo environment.
ACKNOWLEDGMENTS
This work was partially supported by the PRA to M.B. scheme funded by the University of Catania. It was also supported by the GICSERV program, funded by the “ICTS Access Program” of the Spanish Minister of Science and Innovation. The fabrication and the experimental results were obtained through access to the CNM-IMB “Integrated nano- and micro-electronics Clean Room” ICTS.
References
- Barry R. and Ivanov D., J. Nanobiotechnology 2, 2(R) (2004). 10.1186/1477-3155-2-2 [DOI] [PMC free article] [PubMed] [Google Scholar]
- Aldridge S., Genetic Engineering and Biotechnology News 25 (2005), http://www.genengnews.com/gen-articles/agilent-advances-lab-on-a-chip-technique/869/.
- Bringer M. R., Gerdts C. J., Song H., Tice J. D., and Ismagilov R. F., Philos. Trans. R. Soc. London, Ser. B 362, 1087 (2004). [DOI] [PMC free article] [PubMed] [Google Scholar]
- Fung Y. C. and Zweifach B. W., Annu. Rev. Fluid Mech. 3, 189 (1971). 10.1146/annurev.fl.03.010171.001201 [DOI] [Google Scholar]
- Ruggeri Z. M., Microcirculation (Philadelphia) 16, 58 (2009). 10.1080/10739680802651477 [DOI] [PMC free article] [PubMed] [Google Scholar]
- Seto R., Matsuoka F., Soh T., Itoh T., Okada H., Masuda T., Umeda T., Maeda I., Tsukamoto K., Suzuki K., Kimura Y., Onoe A., Higurashi E., Maeda R., Iwasaki W., and Sawada R., Transducers 2009, Denver, CO, 21–25 June 2009.
- Markov D. A., Dotson S., Wood S., and Bornhop D. J., Electrophoresis 25, 3805 (2004). 10.1002/elps.200406139 [DOI] [PubMed] [Google Scholar]
- Borders J. L. and Granger H. J., Microvasc. Res. 27, 117 (1984). 10.1016/0026-2862(84)90047-5 [DOI] [PubMed] [Google Scholar]
- Wayland H. and Johnson P. C., J. Appl. Physiol. 22, 333 (1967). [DOI] [PubMed] [Google Scholar]
- Sapuppo F., Bucolo M., Intaglietta M., Johnson P. C., Fortuna L., and Arena P., IEEE Trans. Instrum. Meas. 56, 2663 (2007). 10.1109/TIM.2007.907959 [DOI] [Google Scholar]
- Linden M., Golster H., Bertuglia S., Colantuoni A., Sjoberg F., and Nilsson G., Microvasc. Res. 56, 261 (1998). 10.1006/mvre.1998.2095 [DOI] [PubMed] [Google Scholar]
- Golster H., Linden M., Bertuglia S., Colantuoni A., Nilsson G., and Sjoberg F., Microvasc. Res. 58, 62 (1999). 10.1006/mvre.1999.2150 [DOI] [PubMed] [Google Scholar]
- Tsukada K., Minamitani H., Sekizuka E., and Oshio C., Physiol. Meas 21, 459 (2000). 10.1088/0967-3334/21/4/303 [DOI] [PubMed] [Google Scholar]
- Sugii Y., Nishio S., and Okamoto K., Physiol. Meas 23, 403 (2002). 10.1088/0967-3334/23/2/315 [DOI] [PubMed] [Google Scholar]
- Sapuppo F., Bucolo M., Intaglietta M., Fortuna L., and Arena P., Nanotechnology 17, S54 (2006). 10.1088/0957-4484/17/4/009 [DOI] [PubMed] [Google Scholar]
- De Francisci M., Bucolo M., Intaglietta M., Arena P., and Fortuna L., Proceedings of the 26th Annual International Conference of the IEEE EMBS, San Francisco, CA, 1–5 September 2004.
- Salazar Vázquez B. Y., Hightower C. M., Sapuppo F., Tartakovsky D. M., and Intaglietta M., J. Biomed. Opt. 15, 011102 (2010). 10.1117/1.3280270 [DOI] [PMC free article] [PubMed] [Google Scholar]
- Bucolo M., Cadarso V. J., Esteve J., Fortuna L., Llobera A., Sapuppo F., and Schembri F., Proceedings of the 12th Conference on Miniaturized Systems of Chemistry and Life Science (microTAS08), 2008, pp. 1579–1581.
- Chang-Yen D. A., Eich R. K., and Gale B. K., J. Lightwave Technol. 23, 2088 (2005). 10.1109/JLT.2005.849932 [DOI] [Google Scholar]
- Llobera A., Demming S., Wilke R., and Büttgenbach S., Lab Chip 7, 1560 (2007). 10.1039/b704454b [DOI] [PubMed] [Google Scholar]
- Cadarso V. J., Llobera A., Villanueva G., Seidemann V., Buttgenbach S., and Plaza J. A., Sens. Actuators, A 145–146, 147 (2008). [Google Scholar]
- Xia Y. and Whitesides G. M., Angew. Chem., Int. Ed. 37, 550 (1998). [DOI] [PubMed] [Google Scholar]
- Duffy D. C., Cooper McDonald J., Schueller O. J. A., and Whitesides G. M., Anal. Chem. 70, 4974 (1998). 10.1021/ac980656z [DOI] [PubMed] [Google Scholar]
- Llobera A., Wilke R., and Buttgenbach S., Lab Chip 5, 506 (2005). 10.1039/b416633g [DOI] [PubMed] [Google Scholar]
- Menger M. D., Laschke M. W., and Vollmar B., Eur. Surg. Res. 34, 83 (2002). 10.1159/000048893 [DOI] [PubMed] [Google Scholar]
- Sckell A. and Leunig M., Methods Mol. Biol. 305 (2009). 10.1007/978-1-59745-241-0_19 [DOI] [PubMed] [Google Scholar]
- Ursino M., Colantuoni A., and Bertuglia S., Microvasc. Res. 56, (Issue 3), 233 (1998). 10.1006/mvre.1998.2106 [DOI] [PubMed] [Google Scholar]


