Abstract
Progress in microelectrode-based technologies has facilitated the development of sophisticated methods for manipulating and separating cells, bacteria, and other bioparticles. For many of these various applications, the theoretical modeling of the electrical response of compartmentalized particles to an external field is important. In this paper we address the analysis of the interaction between cells immersed in rf fields. We use an integral formulation of the problem derived from a consideration of the charge densities induced at the interfaces of the particle compartments. The numerical solution by a boundary element technique allows characterization of their dielectric properties. Experimental validation of this theoretical model is obtained by investigating two effects: (1) The influence that dipolar “pearl chaining” has on the dielectrophoretic behavior of human T lymphocytes and (2) the frequency variation of the spin and orbital torques of approaching insulinoma β-cells in a rotating field.
INTRODUCTION
The development of noncontact methods, using ac electric fields, for manipulating microscale and nanoscale biological particles, has produced a new area of research dealing with the mechanisms of interaction of bioparticles with electric fields. A variety of devices based on dielectrophoresis (DEP) has been proposed in the past years for separation, handling, and trapping of cells, viruses, and biomolecules.1, 2, 3, 4 Besides, there has been a great development of methods for the detection and identification of bioparticles without the use of labels or tags.5, 6, 7 Similarly, electrorotation (ER) produced by a rotating electric field has been used to characterize the properties of cell membrane and cytoplasm and to provide a monitor for cell viability.8, 9, 10
The theoretical understanding of these phenomena is crucial both for the design of electrokinetic devices and the identification and characterization purposes using such devices. The basic theory of dielectrophoresis and cell electrorotation is well established and its application is traditionally based on analytical solutions for idealized models of isolated single cells. These models consider multishelled spheres or spheroids characterized by sets of electrical parameters, each describing the complex conductivity (or permittivity) of an individual phase (e.g., the cell membrane, cytoplasm, nucleus, and extracellular medium).11 While such models provide simple analytical solutions, they have significant limitations in dealing with real cells which do not conform to those idealized geometries (e.g., the discoid shape of erythrocytes or platelets). They also fail to include cases where cell-cell interactions or associations occur. For example, cells in electric fields can interact to form characteristic “pearl chains” oriented along the field lines.12 Although the basic dipole-dipole forces controlling the formation of cell chains are well understood, this effect is usually ignored in the discussion of DEP experiments. However, the DEP behavior of isolated cells can be different from those that form doublets, triplets, or higher order aggregates. The DEP force between two lossy dielectric particles polarized by an external field was studied by Sancho et al.13 using multipole expansions centered in both spheres and solving the resulting linear system of equations. A similar approach was used by Jones12, 14 for chains of dielectric spheres with extension to the case of magnetic particles in a magnetic field. Huang et al.15 proposed a multiple image approximation to study the polarization spectra of a pair of colloidal particles. All these studies are restricted to plain spherical particles, aligned with the direction of the electric field. The practical calculation of the interaction requires truncation of expansions at some finite number of terms and is affected by convergence problems when particles have high dielectric constant or they are closely spaced. Using the dipole approximation for shelled particles, Giner et al.16 analyzed the formation of longitudinal and transverse chains of yeast and latex particles in an electric field, observed in the experiments. The effect of mutual interactions on cell electrorotation in rotating fields has not been generally considered. However, the rotation produced by the interaction between two cells in a linearly polarized field was described by Mahaworasilpa et al.17 An interesting technique based on this coupled electrorotation of two dielectric microspheres was investigated both theoretically and experimentally by Simpson et al.18, 19
Numerical computations, based on finite element methods (FEMs) or boundary element methods (BEMs), enable the modeling of realistic structures and shapes of bioparticles, as well as the interaction effects between them, in all orders of multipole expansion. However, the different size scales involved in the problem (nanometers for the membrane thickness and micrometers for the cell diameter) lead to inaccurate solutions unless very dense grids and sophisticated adaptive meshing techniques are used. Furthermore, the primary solution of standard BEMs or FEMs is the potential distribution so that the polarizabilities of the cells have then to be deduced using mathematical treatments that involve inaccurate numerical differentiation.20 In this paper we apply a special BEM version that fits the needs of modeling for interpreting many DEP and ER experiments.
We present two experiments related to cell interactions in DEP aggregation of human T lymphocytes and ER of rat insulinoma β-cells. In the first one, we study the influence of the cell chaining due to cell attraction on the measured crossover frequency. In the second case we interpret the observed mutual orbital rotation between pairs of cells. There is a good agreement between observations and our numerical modeling in both experiments.
NUMERICAL METHOD
The average dielectrophoretic force experienced by a cell in a nonuniform field in the effective dipole moment approximation is
| (1) |
where E is the field intensity and α is the complex polarizability of the particle, defined as the ratio between the induced dipole and the corresponding electric field. Equation 1 is valid for small particle sizes compared to the distance along which the electric field varies appreciably.
For a spherical cell of radius r,
| (2) |
and are complex permittivities of the cell and surrounding medium, respectively, and fCM is the Clausius–Mossotti factor.12 When the influence of neighboring cells cannot be ignored, Eq. 1 is not valid and a multipolar approach should be used instead, taking into account the successive induced moments between them. In the present study we propose an accurate computation of the field distribution in both particles and medium using numerical methods. To this purpose we will apply a special BEM approach based on an integral formulation of Laplace’s equation, derived from a consideration of the charge densities induced at the interfaces of a compartmentalized dielectric particle.21 On solving the integral equation for the charge densities, both the particle polarizability and the force produced by an external field will be obtained directly, including the effect of multipole contributions. Next we summarize the main steps of the derivation.
An integral expression for the electric potential produced by a polarized dielectric body subjected to an external field, in quasistatic approximation, is
| (3) |
where ϕ0(r) is the potential produced by the external sources and σ(r′) is the charge density located on the interface S (that can be a nonconnex surface as is the case for a layered or multishelled particle). G(r,r′) is the electrostatic Green’s function; for a three-dimensional: Geometry, G(r,r′)=1∕|r−r′|. An important point to note is that since, in general, the media are conductive, σ(r′) and ϕ(r) are complex magnitudes, reflecting phase shifts with respect to the applied potential ϕ0(r).
Denoting by Eij the normal component of the electric field at a point defined by r, at the interface between media i and j (pointing from medium i to medium j), we obtain the following from Eq. 3:
| (4) |
where the contribution of the singularity of the integrand at r=r′ is explicitly included. From Eq. 4 and using the relation between induced charge density and electric field, the following Fredholm integral equation is obtained:
| (5) |
where , , and denote the complex permittivities of material phases i,j in contact at point r of the interface.
To obtain a numerical solution for Eq. 5 the interfaces first have to be divided into small domains of area ΔSi. On each of the surface elements the charge density is assumed to be approximately constant. Thus, the integral equation is converted into a linear algebraic system that is solved by a standard triangular factorization method. From the calculated charge densities, the electrical response of the cell and its ponderomotive behavior can be readily obtained. Thus the effective dipolar moment and the corresponding polarizability are calculated from
| (6) |
where the sum extends to all subareas of the considered cell. As the polarization charges are supposed to be in the vacuum, the dipole moment has been multiplied by the real part of the medium permittivity εm to get its effective value in that medium.
In the case of cells immersed in a rotating circularly polarized field, E0=E0(ux+juy), dipole moment and electric field are phase shifted so there is a torque on each cell that produces cell electrorotation. Thus, the average spin torque on the cell is12
| (7) |
On the other hand, considering two interacting particles the force and torque on one cell can be directly computed as the superposition of the stresses at each subarea. Then, the average net force on cell 1 can be written as
| (8) |
where the symbol ∼ means complex conjugated and each sum extends to the interfaces pertaining to cells 1 and 2, respectively. Furthermore, there exists an orbital torque, acting on cell 1 with respect to the center of the other cell, at the distance r, given by
| (9) |
and similarly for particle 2.
RESULTS AND DISCUSSION
In this section we present some results regarding two electrokinetic experiments in which the interaction effects are noticeable and can be interpreted using our proposed BEM.
Dipolar chaining effects in DEP response of cells
This first example concerns the experimental observations of the dielectrophoretic behavior of isolated and clusters of Jurkat E6-1 T-cells, which form pearl chains. DEP experiments were performed by pipetting cell suspensions (∼106 cells∕ml) into chambers containing microelectrodes fabricated using standard photolithography. The procedure and apparatus have been described elsewhere.5, 7, 22 In summary, sequences of ac voltages at preset frequencies in the frequency range from approximately 5 kHz to 100 MHz, and at five discrete steps per decade of frequency, were applied to the microelectrodes to generate a sequence of alternate positive and negative DEP forces. If the average DEP crossover frequency for a population of test cells was known in advance, the full frequency range was reduced and more discrete steps were used, centered on the crossover frequency. Images of the DEP-induced motions of the cells were captured at 30 frames∕s. The location of each cell was continuously tracked, and their velocities were computed to an accuracy of ±0.1 μm∕s and normalized with respect to the variation of the electric field strength and field gradient between the electrode edges. The diameter of each cell was also determined (±0.25 μm) from the average value obtained from the images collected over the time (∼5 min) of each experiment run. After application of the electric field, some of the cells interacted with others to form doublets, triplets, or higher order pearl chains. The frequency—where each cell, or two or more cells forming a chain, exhibited a transition between negative and positive DEPs (the so-called DEP crossover frequency fx0)—was computed from interpolation of the DEP frequency responses from either side of the crossover frequency.
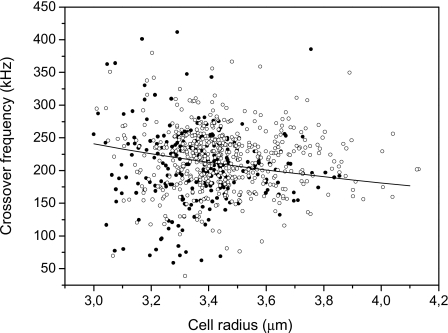
The experimental values of crossover frequencies fx0 and the corresponding cell radii obtained for T-cells are shown in Fig. 1. We used a shelled sphere for modeling the dependence of single cell fx0 on radius. The following electrical and geometrical parameters of a typical T-cell were chosen: Membrane thickness δ=4.5 nm, permittivity and conductivity of cytoplasm εcyt=50ε0 and σcyt=1 S∕m, specific membrane conductance Gm=100 S∕m2, and capacitance Cm=6 mF∕m2. Permittivity and conductivity of the suspending medium were the experimental values εmed=79ε0 and εmed=40 mS∕m. The corresponding curve obtained as a function of cell radius is also displayed in Fig. 1. The scattering of experimental dots shows the variability of the morphology and physiological characteristics of the cell population, besides some random experimental errors.
Figure 1.
Experimental DEP crossover frequencies for single T-cells (solid circles) and cells connected in chains (open circles). The solid line represents the theoretically modeled crossover frequency vs radius for a typical single cell.
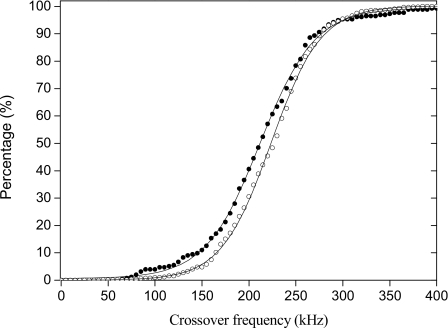
These experimental fx0 data fit to Gaussian distributions and corresponding sigmoid cumulative curves. Figure 2 shows the cumulative distribution of cells displaying a crossover frequency for single cells and for cells connected in chains. Cells forming chains have DEP fx0 shifted toward higher frequencies. The average shift was 10.7 kHz. This effect can be understood as a consequence of the mutual polarization effect between neighboring cells.
Figure 2.
Cumulative distributions of experimental DEP crossover frequencies fx0 for single cells (solid circles) and cell chains (open circles). Solid lines are sigmoidal fits.
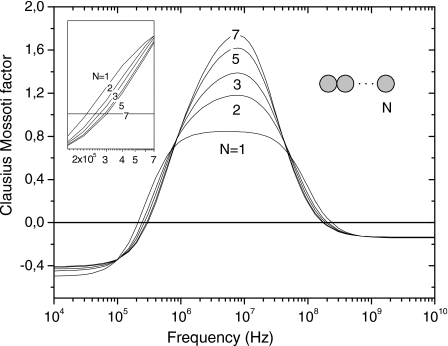
For the numerical modeling, we apply Eq. 5 to the set of N cells forming a chain and from the computed charge densities, we calculate the dipole moment and the effective polarizability αeff of each cell. Figure 3 shows calculated DEP spectra for linear chains of N cells. Peaks of dielectrophoretic response increase with the number of interacting cells because of the induced electrical images produced by neighbors. (Note that the effective Clausius–Mossotti factor per cell can be greater than 1.0 because of these mutual interactions.) The theoretically derived shift of fx0 qualitatively agrees in sign and order of magnitude with the experimentally observed effect shown in Fig. 2.
Figure 3.
Normalized effective polarizability spectrum of the central cell as a function of frequency, in a linear chain of N cells.
The value of 6 mF∕m2 taken for Cm is typical for a smooth surfaced biological membrane.23 However, it has been recognized that such membrane surface features as microvilli, blebs, folds, and ruffles can contribute to larger values of membrane capacitance.7, 23 The morphological heterogeneity accounts for the large standard deviations of fx0 observed for the different cells shown in Fig. 2.
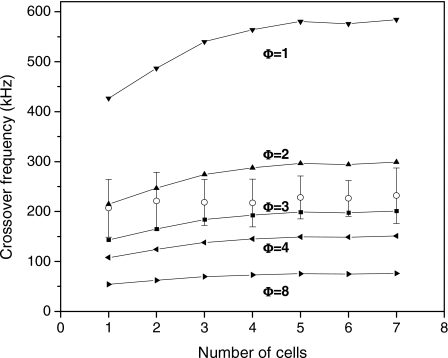
To further investigate this effect, we have used the concept of membrane topography parameter Φ,24 which represents the ratio of capacitances of the actual cell membrane to that of a perfectly smooth shell with the membrane composition, covering the cytoplasm. This parameter physically includes not only the effect of a greater surface area but also other possible molecular or simply geometrical factors that increase the effective membrane capacitance. Figure 4 shows calculated and experimental fx0 values versus cell radii for different topography parameter values. Theoretical values of fx0 for each N value are computed using cell radii equal to the average radius measured for cells in chains with the same N. The comparison between the theoretical curves and experimental results suggests a topographical factor in the range from Φ=2 to Φ=3. In previous work, Jurkat T-cells were found to have a topography factor of mean value Φ=2.2.7 The results shown in Fig. 4 for single cells and doublets are in good agreement with this. Murine erythroleukemia (DS19) cells have been found to have similar Φ values,24 while values as high as Φ=5 have been reported for rat kidney cells.25 From Fig. 4 we find that the experimentally observed rate of increase of fx0 with an increasing number of connected cells is low compared to the slope of the theoretical curves. These lower values of the observed fx0 shifts probably reflect that the electrical interaction between close rough surfaces is not as strong as for smooth membrane surfaces, thus producing less mutual polarization of the cells in the chain.
Figure 4.
Crossover frequencies fx0 for pearl chains with N cells and different topography factors Φ. Open circles represent experimental average values with standard deviation bars.
Cells: ac rotating field interaction
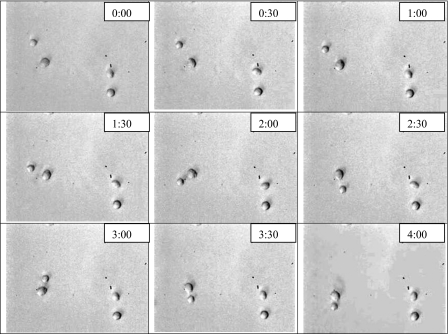
In this case we address the analysis of the interaction between insulinoma β-cells immersed in a rotating ac field, as illustrated in Fig. 5. We perform a numerical analysis, based on BEM, to account for the multipole interactions at all orders. Results for spin and orbital torques as functions of the frequency are presented and compared to the measured data. The procedure and experimental setup have been described elsewhere.26, 27 In short, INS-1 (rat insulinoma β-cells) were grown, centrifuged, and washed twice in the media to be used in the ER measurements. Cell suspending solutions of physiological osmolarity were prepared with controlled conductivity in the range from 11.5 to 42.5 mS∕m. The conductivities were measured, to within ±0.25%, and adjusted using KCl. Digitally generated voltages with 8 Vp.-p., in phase quadrature, of frequencies between 10 kHz and 10 MHz were applied to quadrupole electrodes. The microelectrodes of so-called “bone” design were manufactured by photolithography in a clean room onto glass microscope slides, with a 5 nm chrome adhesion layer covered by a 70 nm gold layer. The cells, at a working concentration of 2×10⁵ cells∕ml or lower, were pipetted directly onto the electrode assembly and secured with a cover slip. At this concentration most of the suspended cells remained apart during the ER experiments. The electrokinetic responses of the cells were visualized using a Zeiss Axioskop and recorded at 30 frames∕s for later analysis, with a final magnification of 750 on a TV monitor. Electrorotation rates were obtained mainly by simple timing with a stopwatch. When better accuracy was required, the video-captured frames were analyzed using an image processing method described previously.28 The exact distance between opposite electrode faces (e.g., 393 μm for the nominal 400 μm bone electrodes) was used as the scale to determine cell diameter to an accuracy of ±0.3 μm.
Figure 5.
Images of a pair of β-cells (left side of the frames) rotating counterclockwise in an electrorotation experiment at a frequency of 200 kHz.
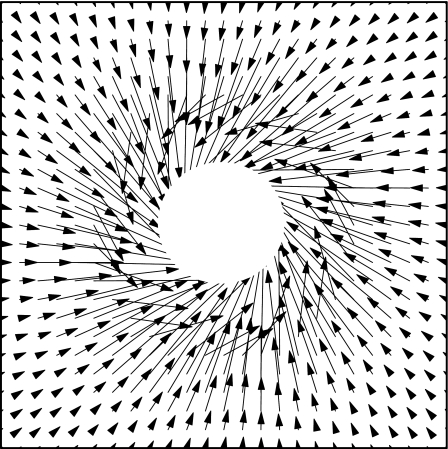
Forces between a pair of identical β-cells have been calculated using Eq. 8. Geometrical and electrical parameters of the cells taken from the captured images and ER analysis are average radius a=3.5 μm, membrane thickness of 10 nm, membrane capacitance of 10.4 mF∕m2, membrane conductance of 50 S∕m2, cytoplasm permittivity of 50ε0, and cytoplasm conductivity of 0.5 S∕m. The pattern of forces on each cell shows a rotational component in agreement with experiments, as can be seen in Fig. 6.
Figure 6.
Force produced by a polarized cell in a rotating field (f=200 kHz). The radius of the exclusion (white area) is imposed by the closest distance 2a.
The case is representative of two interacting cells, with coordinate origin taken at the position of one of them. The force on the second cell is plotted at different positions around the first one; it is attractive and this explains why the distance between both cells in Fig. 5 slowly reduces, but has also a rotating component, especially at short distances, which is responsible for the orbital rotation of the second cell around the first one. The resulting torque (with respect to the center of the first cell) diminishes when the distance between cells increases.
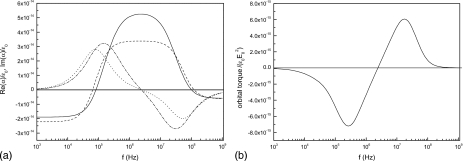
Curves in Fig. 7a represent spectra of real and imaginary parts of the polarizability for a cell in a touching pair, obtained using a shelled sphere model. We have first studied the dipole moment of each sphere produced by the external field and the field of the other sphere29 and then compared the result with that obtained by applying the numerical BEM. It can be seen that the dipole approximation underestimates the magnitude of the cell polarization. We tested that at long distances both calculations—dipole theory and BEM—give the same spectrum. Figure 7b shows the behavior of the orbital torque for the same interval of frequencies. The orbital rotation can be cofield or antifield in analogy with the spin movement. Having in mind that the spin torque is proportional to −Im(α), we observe that both torques follow similar curves, crossing the axis at the same frequency f=2.5 MHz.
Figure 7.
(a) Normalized polarizability spectra of two β-cells in contact. Continuous line: Re(α) from BEM computations. Dashed line: Re(α) from dipolar approximation. Dashed-dotted line: Im(α) from BEM. Dotted line: Im(α) from dipolar approximation. (b) Orbital torque spectrum.
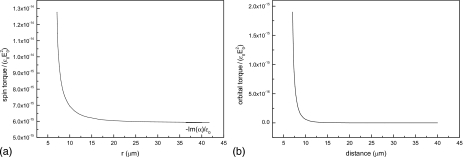
Figures 8a, 8b show the dependence of both spin and orbital torques on the distance between interacting cells. As the distance increases, the spin torque tends to the value of −Im(α) for the isolated cell. The curve shows that the spin torque differs from this asymptotic value by 10% when the distance between cells is approximately 1.6 times their diameter. The orbital torque also decreases sharply with increasing distance between cells (more than one order of magnitude when cells separate from contact, r=2a, to r=3a), in qualitative agreement with experimental observations.
Figure 8.
(a) Computed average spin and (b) orbital torques as functions of the distance between cells (f=800 kHz).
The physical model of the cells rotating in the electric field must include the consideration of the viscous forces acting on the spheres. We will assume that these forces are given by the simple Stokes law.30 In consequence, the rotation rate νrot is proportional to the acting torque, T1=cνrot. In a first approximation, neglecting hydrodynamic interactions, we will assume that the proportionality constant c is independent of distance and will assume it as an adjustable parameter in the theory.
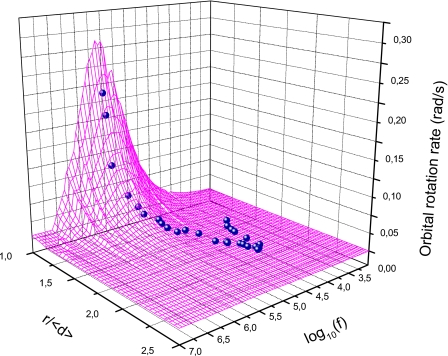
We have considered the experiments performed on β-cells and selected 10.6 and 10.3 μm diameter cell doublets at different distances. Fitting of the theoretical predictions to the experimental values of rotation rates, by least square deviation, gives the 3D diagram represented in Fig. 9. The graph depicts a maximum of rotation speed at frequencies of the order of 3.5×10⁵ Hz, for cells in contact. The high frequency cofield rotation region has not been explored in this experiment and it is not shown in the figure.
Figure 9.
Orbital rotation rate in a doublet as a function of frequency and normalized distance between cells. Small spheres are experimental data and the wire-frame surface represents the theoretical values, obtained using the best fit condition. r is the distance between cell centers and ⟨d⟩ is the average cell diameter.
CONCLUSIONS
Interactions between cells influence all the electrokinetic experiments. Therefore, careful analyses of cell-to-cell forces are of importance for the design of devices and especially for analytical applications. It has been experimentally determined that the formation of pearl chains influences the DEP collection spectra and particularly the frequencies where a transition between positive and negative DEPs may occur. Furthermore, in ER experiments it has been observed that pairs of cells rotate around each other, at the same time that they spin because of the applied rotating field. We have described quantitatively the phenomenon and found that it depends on field frequency and distance between cells in a similar way to that of the spin rotation.
All these characteristics are explained by the electrical interaction between polarized cells. The dipole approximation provides a good description at long distances but we have shown that a numerical approach is needed at distances of the order of the cell diameter. The special version of the boundary element method described here allows interpretation of the experimental data obtained for both examples, giving a good agreement with the theory.
The analysis of the influence of cell chaining on the crossover frequency can be useful in devising DEP-based cell separation protocols, especially for cases of high cell concentrations, where field-induced pearl chains can be more dominant than the existence of single cells.
In addition, the effect of orbital rotation could be used as a complementary method for the dielectric characterization of cells. Fitting of the theory to the experimental spectra would give the permittivity and conductivity of the different cell compartments. It also has the advantage of an easy automation of measurements.
In conclusion, the combination of both experiments on cells interactions with rf fields and numerical tools for interpreting results allows a progress in the understanding of these mechanisms as well as of the electrical nature of biological cells.
ACKNOWLEDGMENTS
This work was partially supported by the Universidad Complutense de Madrid (UCM) under Project No. 910305 for “Bioelectromagnetics” Research Group. We acknowledge the financial support provided by The British Council and the UCM to facilitate exchange visits by M.S. and R.P. during this project. We thank Dr. Anoop Menachery for his assistance with microelectrode fabrication and cell culturing.
References
- Gascoyne P. R. C. and Vykoukal J., Electrophoresis 23, 1973 (2002). [DOI] [PMC free article] [PubMed] [Google Scholar]
- Du J., Juang Y., Wu J., and Wei H., Biomicrofluidics 2, 044103 (2008). 10.1063/1.3037326 [DOI] [PMC free article] [PubMed] [Google Scholar]
- Hwang H., Lee D., Choi W., and Park J., Biomicrofluidics 3, 014103 (2009). 10.1063/1.3086600 [DOI] [PMC free article] [PubMed] [Google Scholar]
- Yang F., Yang X., Jiang H., Bulkhaults P., Wood P., Hrushesky W., and Wang G., Biomicrofluidics 4, 013204 (2010). 10.1063/1.3279786 [DOI] [PMC free article] [PubMed] [Google Scholar]
- Pethig R., Bressler V., Carswell-Crumpton C., Chen Y., Foster-Haje L., García-Ojeda M. E., Lee R. S., Lock G. M., Talary M. S., and Tate K. M., Electrophoresis 23, 2057 (2002). [DOI] [PubMed] [Google Scholar]
- Basuray S. and Chang H., Biomicrofluidics 4, 013205 (2010). 10.1063/1.3294575 [DOI] [PMC free article] [PubMed] [Google Scholar]
- Pethig R., Lee R. S., and Talary M. S., J. Assoc. Lab. Autom. (JALA) 9, 324 (2004). 10.1016/j.jala.2004.08.006 [DOI] [Google Scholar]
- Arnold W. M. and Zimmermann U., Z. Naturforsch [C] 37, 908 (1982). [Google Scholar]
- Hölzel R., Biophys. J. 73, 1103 (1997). 10.1016/S0006-3495(97)78142-6 [DOI] [PMC free article] [PubMed] [Google Scholar]
- Goater A. D., Burt J. P. H., and Pethig R., J. Phys. D: Appl. Phys. 30, L65 (1997). 10.1088/0022-3727/30/18/001 [DOI] [Google Scholar]
- Irimajiri A., Hanai T., and Inouye A., J. Theor. Biol. 78, 251 (1979). 10.1016/0022-5193(79)90268-6 [DOI] [PubMed] [Google Scholar]
- Jones T. B., Electromechanics of Particles (Cambridge University Press, New York, 1995). 10.1017/CBO9780511574498 [DOI] [Google Scholar]
- Sancho M., Martínez G., and Llamas M., J. Electrost. 21, 135 (1988). 10.1016/0304-3886(88)90025-3 [DOI] [Google Scholar]
- Miller R. D. and Jones T. B., J. Phys. D: Appl. Phys. 21, 527 (1988). 10.1088/0022-3727/21/3/024 [DOI] [Google Scholar]
- Huang J. P., Karttunen M., Yu K. W., Dong L., and Gu G. Q., Phys. Rev. E 69, 051402 (2004). 10.1103/PhysRevE.69.051402 [DOI] [PubMed] [Google Scholar]
- Giner V., Sancho M., Lee R. S., Martínez G., and Pethig R., J. Phys. D: Appl. Phys. 32, 1182 (1999). 10.1088/0022-3727/32/10/316 [DOI] [Google Scholar]
- Mahaworasilpa T. L., Coster H., and George E. P., Biochim. Biophys. Acta 1281, 5 (1996). 10.1016/0005-2736(95)00271-5 [DOI] [PubMed] [Google Scholar]
- Simpson G. J., Wilson C. F., Gericke K. H., and Zare R. N., ChemPhysChem 3, 416 (2002). [DOI] [PubMed] [Google Scholar]
- Wilson C. F., Wallace M. I., Morishima K., Simpson G. J., and Zare R. N., Anal. Chem. 74, 5099 (2002). 10.1021/ac0258599 [DOI] [PubMed] [Google Scholar]
- Gerald C. F. and Wheatley P. O., Applied Numerical Analysis (Addison-Wesley, New York, 1989). [Google Scholar]
- Sancho M., Martínez G., and Martín C., J. Electrost. 57, 143 (2003). 10.1016/S0304-3886(02)00123-7 [DOI] [Google Scholar]
- Sanchis A., Sancho M., and Pethig R., Proceedings of the 27th Annual International Conference, IEEE Engineering in Medicine and Biology, Shanghai, 2005. [DOI] [PubMed]
- Pethig R. and Kell D. B., Phys. Med. Biol. 32, 933 (1987). 10.1088/0031-9155/32/8/001 [DOI] [PubMed] [Google Scholar]
- Wang X. B., Huang Y., Gascoyne P. R. C., Becker F. F., Hölzel R., and Pethig R., Biochim. Biophys. Acta 1193, 330 (1994). 10.1016/0005-2736(94)90170-8 [DOI] [PubMed] [Google Scholar]
- Huang Y., Wang X. B., Becker F. F., and Gascoyne P. R. C., Biochim. Biophys. Acta 1282, 76 (1996). 10.1016/0005-2736(96)00047-8 [DOI] [PubMed] [Google Scholar]
- Pethig R., Jakubek L., Sanger R. H., Heart E., Corson E., and Smith P. J. S., IEE Proc.: Nanobiotechnol. 152, 189 (2005). 10.1049/ip-nbt:20050040 [DOI] [PubMed] [Google Scholar]
- Sancho M., Martínez G., and Pethig R., Proceedings of the Fifth International Workshop on Biological Effects of EM Fields, Palermo, 2008.
- Zhou X. F., Burt J. P. H., and Pethig R., Phys. Med. Biol. 43, 1075 (1998). 10.1088/0031-9155/43/5/003 [DOI] [PubMed] [Google Scholar]
- Sancho M., Giner V., and Martínez G., Phys. Rev. E 55, 544 (1997). 10.1103/PhysRevE.55.544 [DOI] [Google Scholar]
- Iliescu C., Tresset G., and Xu G., Biomicrofluidics 3, 044104 (2009). 10.1063/1.3251125 [DOI] [PMC free article] [PubMed] [Google Scholar]


