Abstract
We describe a system for the isolation, concentration, separation, and recovery of human osteoblast-like cells from a heterogeneous population using dielectrophoretic ring traps. Cells flowing in a microfluidic channel are immobilized inside an electric field cage using negative dielectrophoresis. A planar ring electrode creates a closed trap while repelling surrounding cells. Target cells are identified by fluorescent labeling, and are trapped as they pass across a ring electrode by an automated system. We demonstrate recovery of small populations of human osteoblast-like cells with a purity of 100%, which in turn demonstrates the potential of such a device for cell selection from a heterogeneous population.
INTRODUCTION
The use of human stem cells, including skeletal stem cells and adult cell based therapies, offers significant promise for orthopedic reparative medicine. However, to date there remains a paucity of information both on the presence, activity, location, and distribution of skeletal stem cells in vivo, as well as a lack of unique skeletal stem cell markers, preventing the isolation of pure stem cell populations.1 Development of technologies to facilitate the identification and isolation of specific cell types to provide sufficient stem∕progenitor cell populations for tissue regeneration remains a significant clinical need. Current technologies for cell isolation include fluorescence activated cell sorting2 and magnetic activated cell sorting.3 These techniques are not particularly suitable for the selection of individual cells from a bulk population, however, and neither return a 100% pure sorted population. The application of microfluidic techniques for isolation and characterization of individual cells offers a potential approach for the selection of pure cell populations for regenerative medicine, as well as offering new methods for characterization of selected cell populations.
Microfluidic devices offer ways of manipulating and trapping a single cell and have numerous applications in cell processing. Microfluidic cell separation devices include electrokinetic,4, 5, 6 optical,7 acoustic,8 and hydrodynamic devices.9 Typically, these devices operate in one of two ways: cells can be separated laterally across a fluid flow (e.g., deflection of the fluid using dc electro-osmosis) before the flow is split between different outputs, or cells can be separated longitudinally along the fluid stream by trapping or delaying particular cell populations while unwanted cells are removed.10 Lateral separation has the advantage of potentially higher throughput as cells are not stored. Work on the separation of E. Coli expressing green fluorescent protein (GFP),5 for example, demonstrated that bacterial cells could be sorted at a rate of up to 44 cells∕s and enriched by up to 89 times, although the maximum purity of the recovered populations was low at only 9.5%. Furthermore, longitudinal separation allows cell concentration and retention in a chip for further analysis. In addition, longitudinal separation affords ease of cell recovery in the absence of the need to divide the fluid stream accurately as is typically required to recover populations from a lateral system.
Particles or cells can also be manipulated locally within a microdevice using dielectrophoresis (DEP), which is the force produced by a spatially nonuniform electric field on a polarizable particle.11 Negative DEP is when cells are repelled from high-field regions at the edge of electrodes while positive DEP describes the motion of cells toward high electric field regions. Negative DEP is the preferred method of trapping cells, since cells can be manipulated in physiological medium and cells are trapped away from high field regions, which can induce cell damage. Many different designs of dielectrophoretic trap have been used to immobilize cells and particles within a microfluidic device.12, 13, 14 The number of electrical connections required per trap can limit the scalability of a design, making it difficult to construct a device with large numbers of independently controllable traps. Negative DEP traps have also been used to pattern cells—planar microelectrode arrays were used to create potential energy wells for trapping single cells against a surface.15 Such traps were not designed to be individually addressable; rather, multiple traps are connected in series. Technologies for fabricating large arrays of traps include silicon CMOS technology.16 Combinations of different electrodes were switched on and off to dynamically create traps, or to move particles around on the surface.
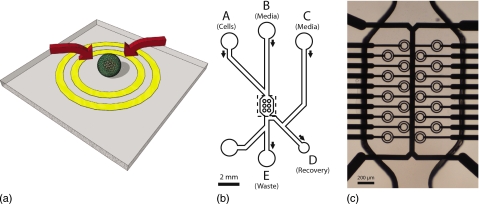
We previously demonstrated the potential of dielectrophoretic ring electrode traps to immobilize single cells in physiological media.17 Closed dielectrophoretic cages are created using planar concentric ring electrodes, the innermost being driven with a sinusoidal voltage and the outer being connected to ground (Fig. 1). This arrangement draws a cell toward the center of the ring, trapping it against the substrate. Other cells outside the trap are repelled, so that each trap only holds a single cell. In this study, we demonstrate the use of an array of ring electrodes to separate fluorescently labeled human osteosarcoma cells from a heterogeneous population. The target cells are identified by an automated control system from a fluorescent signal, and selectively trapped in the ring electrodes. Fluorescently labeled cells are retained while other cells are carried away in the fluid, and are subsequently released from the traps and recovered for further analysis.
Figure 1.
(a) Concept drawing of a single cell dielectrophoretic trap. The DEP force (arrows) directs the cell down and toward the center of the ring electrodes. (b) Diagram of the microfluidic channel on the device. The channel is 95 μm deep, 350 μm wide increasing to 950 μm around the ring electrodes. (c) Photograph of the ring electrodes and microfluidic channel in the center of the device (dashed region in B).
EXPERIMENTAL
GFP-transfected MG63 cells (green) were separated from fluorescent red stained MG63 cells by trapping the green cells in DEP ring electrodes. Immortalized human MG-63 cells (osteosarcoma—ATCC, CRL-1427) were established as monolayer cultures in Dulbecco’s Modified Eagle Medium (DMEM) plus 10% fetal calf serum (FCS). Cells were maintained at 37 °C with 5% CO2 and passaged at preconfluence for maintenance or use in experiments. Populations of GFP-MG63 cells (“positive” or target cells) were established by transfection with recombinant pmaxGFP® (Amaxa Nucleofector System). Vybrant DiD red cell labeling solution (Invitrogen, V-22887, excitation 644 nm, emission 665 nm) was used to stain “negative” cell populations.
The construction and operation of a ring electrode as a single cell dielectrophoretic trap has been reported previously.17 Briefly, platinum electrodes were fabricated on a glass substrate by photolithography. Multilayer structures were separated by a 700 nm silicon nitride dielectric. The substrate was diced into 20 mm×20 mm squares, each containing an array of 20 ring electrodes. An enlarged view of the ring electrodes and associated interconnects is shown in Fig. 1.
Anisotropic conductive film (ACF) bonding was used to connect the electrodes on the glass substrate to an external circuit board through a flexible printed circuit board (PCB). The ACF interface simultaneously produces up to 70 electrical connections at a 200 μm pitch, although only 24 are required for this particular device.
A microfluidic channel was fabricated in polydimethylsiloxane (PDMS) by molding around a layer of Ordyl SY355 dry film resist (Elga Europe), patterned using techniques based on those described by Vulto.18 PDMS (Sylgard, Dow Corning) prepolymer mixed with curing agent in the ratio 10:1 was poured on to the mold, degassed in a vacuum chamber for 20 min, and cured in an oven at 75 °C for 3 h. The PDMS gasket was cut from the surrounding material in a 15 mm×20 mm section, and apertures (∼400 μm diameter) were punched through using a hollow corer. Access ports were drilled in a 15 mm×20 mm×0.7 mm glass lid using electrochemical spark erosion. The glass lid, molded PDMS microchannel (depth of 95 μm), and the glass substrate with electrodes were manually aligned under a microscope using a drop of ethanol to separate the surfaces, and the assembly was cured by heating in an oven at 60 °C for 30 min. The entire assembly was held in a custom-made holder.
Cells were observed using a custom-built fluorescent microscope with a color digital video camera (uEye 2230c) and a Nikon PlanFluor ×4 objective lens. Diascopic illumination was provided by a “white” LED (5500K CCT—Lumiled Luxeon); red (635 nm, 200 mW) and blue (473 nm, 30 mW) lasers (Laserglow) were used for epifluorescence observations with a dual-band polychroic mirror (FITC∕CY5—Chroma, USA) and emission filter (FF01–538∕685-25—Laser 2000, U.K.).
Ring traps were driven with a 10 Vpp, 5 MHz signal from a function generator (TTI TG2000) switched between the traps using a relay board (Omega CRB-48). Traps were controlled by automated control scripts written in MATLAB (Mathworks) through an interface board (National Instruments USB-6051). Live images grabbed from a digital video camera were compared with a stored background image and passed through a real time feature-recognition algorithm. The size, color, and intensity of each object were determined, and traps activated as positively identified cells passed overhead.
A diagram of the microfluidic channel geometry is shown in Fig. 1b. Macroscopic fluidic connections are provided through a manifold via 1∕16 in. PFA tubing (internal diameter of 800 μm) and valves on each inlet and outlet. A syringe pump (Cole Parmer 79000 series) was connected to the inlets (A–C) via a multiway valve. Outlet D (recovery) was connected to a length of tubing that was used to dispense 40 μl droplets containing the recovered cells into a 384-well microplate. Outlet E (waste) was connected to a waste collection jar. The remaining port was not used.
The fluidic device was cleaned and sterilized by flushing through (5 ml at 1 ml min−1) with ethanol and 10% sodium hypochlorite. A sterile 0.2 μm filter was fitted to the system, and all subsequent fluid entering the system (except cell samples, which were injected through a different inlet) passed through the filter to ensure sterility. Ethanol and sodium hypochlorite were removed by flushing through with phosphate buffered saline (PBS), followed by PBS with 5% bovine serum albumin (BSA) (see below), incubated for 30 min in the system and rinsed with PBS. Finally, DMEM+4% Dextran-70 was flushed through the system in preparation for the introduction of cells.
A common problem encountered in developing microfluidic systems for cell isolation is unwanted attachment of cells to surfaces within the device. This was minimized using the following methods:
-
(i)
BSA was flushed through the device and incubated for 30 min, as described above.
-
(ii)
Dextran-70 was added to the medium (4%) to increase its buoyancy, thereby increasing the time taken for cells to sediment out of solution.
-
(iii)
The device was cooled to 10 °C. Experiments (data not shown) determined that this significantly reduced cell attachment to glass surfaces.
Green “target” cells were mixed with red “negative” cells at a ratio of approximately 1:4, resuspended in DMEM+4% Dextran-70, and introduced into the device at a concentration of approximately 106 cells ml−1. A cell injection protocol was developed to maximize the recovery of the trapped cells and minimize the potential for contamination with unwanted cells. Fluid valves were connected to each inlet∕outlet to control the flow of fluid. The sequence of operation is depicted in Fig. 2:
-
(i)
Cells were introduced into the system through A.
-
(ii)
Cells pumped through the system at a constant rate and trapped in the ring electrodes. At the same time the recovery channel was washed (C–E) with cell-free medium.
-
(iii)
Untrapped cells flushed through the device from B.
-
(iv)
Cells that remained in the inlet channel were removed by flushing medium back toward A.
-
(v)
Cells released from the traps (the voltage was turned off) and flushed toward the recovery outlet (D).
-
(vi)
Cells recovered onto a microplate by flushing fluid from C.
Figure 2.
Valve operation sequence during the sorting [(i) and (ii)], washing [(iii) and (iv)], and recovery [(v) and (vi)] stages.
Cells were recovered from the device into a 384-well plate (Corning CellBind) by dispensing 40 μl droplets sequentially into microwells. 40 μl DMEM+20% FCS+penicillin∕streptomycin (1×) was added to each well, and the microplate placed in a cell culture incubator. The plate was examined by fluorescence microscopy (FITC and Cy5 filters) and counts obtained of the number of red and green-labeled cells after 24 h, and again after 72 h.
RESULTS
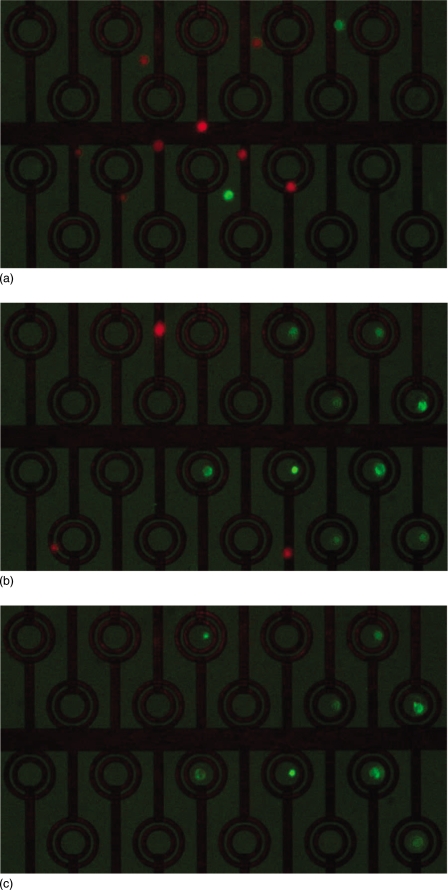
The microfluidic device was used to isolate and trap single cell types according to a fluorescent signal. Figure 3 shows a sequence of images demonstrating the capture of cells within the device; (a) shows cells moving through the device, (b) shows nine green cells trapped and untrapped red cells. Figure 3c shows the array after flushing indicating the retention of seven green cells. In a typical experiment, five to ten cells were captured from a mixed population with a ratio of 1:4 green to red cells. In a series of four separate experiments, 100% pure populations of green cells were recovered from each operation. This data is summarized in Table 1. After recovery of the trapped cells into a microplate, on average 70% of the cells that were trapped could be identified. The remaining cells were either not successfully recovered from the microfluidic device—having become lodged somewhere within the ancillary fluidic equipment, or could not be located within the microplate—possibly as a result of photobleaching of the fluorescent label.
Figure 3.
Still frames taken from the video at intervals during sorting of GFP+ MG63 cells from red labeled MG63 cells at a ratio of 1:4: (a) prior to trapping, (b) after trapping, and (c) after washing.
Table 1.
Summary of cell recovery 24 and 72 h after microfluidic isolation.
| Run no. | Green cells trapped | Red recovered | Green recovered | Green purity (%) | Red adhered after 24 h | Green adhered after 24 h | Red viable after 72 h | Green viable after 72 h |
|---|---|---|---|---|---|---|---|---|
| 1 | 4 | 0 | 4 | 100 | 0 | 2 | 0 | 2 |
| 2 | 6 | 0 | 5 | 100 | 0 | 4 | 0 | 5 |
| 3 | 7 | 0 | 3 | 100 | 0 | 1 | 0 | 0 |
| 4 | 4 | 0 | 2 | 100 | 0 | 1 | 0 | 1 |
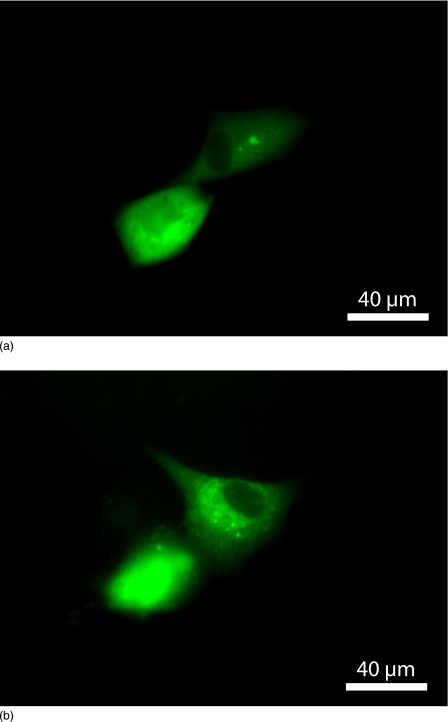
In experiments performed sorting the GFP-transfected cells, approximately 53% (range: 33%–80%) of the recovered cells were found to re-adhere within 24 h of trapping. Figure 4 shows recovered GFP+ cells in culture that adhered to the surface of a microplate. The sorted cells remained viable for at least 72 h, but did not proliferate in long term culture, as insufficient cells were recovered to restart a population of somatic cells—see below.
Figure 4.
Photomicrographs of GFP+ cell adhesion and spreading after (a) 24 and (b) 72 h.
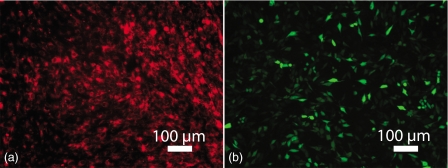
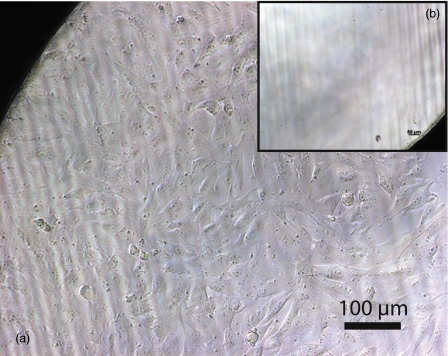
Figure 5 shows fluorescently labeled MG63 cells stained with Vybrant DiD stain or transfected with GFP before sorting. Cells stained using Vybrant™ DiD typically displayed a >90% staining efficiency. GFP transfection was 60%–70% efficient as determined by the percentage of cells expressing GFP. Cell viability was monitored by taking control samples at points throughout the experimental protocol. Aliquots of cell solution (40 μl) containing on average ten cells were plated onto tissue culture plastic and examined for viability after 24 h. Each well contained between 5 and 20 cells per well. Vybrant DID-stained populations exhibited an average of 90%–95% viability poststaining, while GFP populations exhibited an average of 60%–70% viability post-transfection (in line with typical results). Observation of cultures beyond 72 h demonstrated that maintenance and proliferation of viable populations required a seeding density of n>10 cells per well [Fig. 6a]. No proliferation was observed in wells containing n<10 cells, and the cells eventually detached from the surface [Fig. 6b].
Figure 5.
Fluorescent microscopy images of Vybrant DiD stained (a) and GFP-transfected (b) cells after 24 h in culture.
Figure 6.
(a) Photomicrographs of MG-63 control population after 12 days, demonstrating proliferation in wells seeded at >10 cells∕well, and (b) lack of proliferation, resulting in cell death and detachment in wells seeded at <10 cells∕well.
DISCUSSION
Previous studies of microfluidic cell separation have demonstrated enrichment of rare cells from a heterogeneous population, but the purity of recovered populations typically remained low.5, 9 In this study we have shown that individual human cells can be selected and manipulated from a much larger heterogeneous population, and recovered as a purified population. Four separate sorting operations all produced 100% pure populations. The use of video data in sorting enables more specific decisions to be made on the classification of cell types. Thus, cells can be identified by their size and geometric features as well as by their intensity, and can be rejected if they are part of a cell aggregate or if a negative cell has simultaneously been selected.
The number of cells recovered from the device is lower than other comparable techniques. In part, this was because a certain proportion of the trapped cells could not be recovered as they dislodged from the traps before the nontarget cells had been flushed from the device. There was also always a compromise to be reached between the number of cells trapped and the duration of each sorting operation—as with all sorting techniques, cell viability decreases as the cells spend more time out of culture. The number of recovered cells for each sorting operation typically represented less than 25% trap occupancy. However, the current design is highly scalable, and greater numbers of cells could be recovered and at higher sorting rates by increasing the number of traps on the device, and by distributing the traps to ensure greater coverage across the microfluidic channel.
Another useful advantage of the ring trap electrodes is that they concentrate cells during sorting. As an example, an array fully populated would have 20 cells within an 80 nl volume—equivalent to a density of 2.5×10⁸ cells ml−1. If cells were injected at a density of 5×10⁵ cells ml−1 as used in these experiments, this would result in an increase in concentration of 500 times. This is analogous to concentration by centrifugation, often performed on cells and particles on the macroscale. Of course, it is difficult to recover the concentrated cells from the device without diluting them, so this is most useful if cells are to be maintained within the microfluidic device.
Cells in contact with, or moving near a surface occasionally became attached. These cells could potentially detach at a later time when the flow rate was increased and contaminate the sample, leading to nontarget cells being recovered. The microfluidic network and flushing procedure implemented in this study was designed to remove contamination with unwanted cells. Separate inlets were used for injection of cells and medium, so that nontarget cells could be flushed away effectively. Additionally, separate outlets were used for recovery of target cells and waste (non-target cells). An additional washing inlet (C) was provided to flow medium into the device along the recovery outlet, preventing cells entering the recovery outlet until non-target cells had been sufficiently flushed out (Fig. 2). To limit cell-surface interactions, the microfluidic channel was designed so that it is constricted in areas away from the ring electrodes, increasing fluid velocity and reducing the likelihood of cell attachment.
Interestingly, cells had to be seeded at densities greater than ten cells per well to maintain a stable population and proliferate. Trapped GFP+ cells were recovered into a microplate by aliquoting 40 μl of the eluant per well. This resulted in cell densities of approximately 1–3 cells per well, too low to maintain a healthy population, although the majority of cells adhered.
The dielectrophoretic traps developed operate by producing a large gradient in the electric field in the region surrounding the traps, which can alter the electrical potential across the membrane of a cell. Numerical simulation of the electric field indicates that the traps are likely to impose a transmembrane potential of a few millivolts on an immobilized cell, which is unlikely to disrupt the cell membrane.19, 20 Localized heating of the medium around the electrodes will also occur, and this is often viewed as a limitation and concern. Simulations, however, indicate that the temperature rise, above the local ambient temperature in the center of a trap, should not exceed 10 °C for a densely populated array of traps (190 μm pitch), and is much less for an isolated trap.17
CONCLUSION
In conclusion, this study demonstrates that isolation and recovery of specific cells is possible using dielectrophoretic ring traps. While the low numbers of recovered cells hinder reestablishment of somatic cell populations, the approach offers a route for the isolation and recovery of pure populations of cells. With the determination of sufficient surface antigens to enable identification of stem cells with fluorescent markers, the system could potentially be used to isolate and recover stem cells from a heterogeneous population as they typically maintain viability and proliferation even when cultured as single cells. Furthermore, a greater trap density would permit recovery of sufficient cells to allow somatic cell populations to maintain viability and proliferation. These studies illustrate the potential of such a dielectrophoretic device for cell isolation from heterogeneous populations and the implications therein for cell sorting of somatic populations.
ACKNOWLEDGMENTS
The authors would like to express their thanks to Katie Chamberlain of Southampton Nanofabrication Centre and Nico Kooyman of Philips Research, Ltd., Eindhoven for fabrication of electrodes and microfluidic device. EPSRC Studentship funding for P.D.M., as well as a CASE award from EPSRC and Philips Research, Ltd. for R.S.W.T., is gratefully acknowledged. Funding from BBSRC (BB∕GO10579) is gratefully acknowledged.
References
- Tare R. S., Babister J. C., Kanczler J., and Oreffo R. O. C., Mol. Cell Endocrinol. 288, 11 (2008). 10.1016/j.mce.2008.02.017 [DOI] [PubMed] [Google Scholar]
- Radbruch A., Flow Cytometry & Cell Sorting (Springer-Verlag, Berlin, 1999). [Google Scholar]
- Miltenyi S., Muller W., Weichel W., and Radbruch A., Cytometry 11, 231 (1990). 10.1002/cyto.990110203 [DOI] [PubMed] [Google Scholar]
- Fu A. Y., Spence C., Scherer A., Arnold F. H., and Quake S. R., Nat. Biotechnol. 17, 1109 (1999). 10.1038/15095 [DOI] [PubMed] [Google Scholar]
- Fu A. Y., Chou H. P., Spence C., Arnold F. H., and Quake S. R., Anal. Chem. 74, 2451 (2002). 10.1021/ac0255330 [DOI] [PubMed] [Google Scholar]
- Holmes D., Sandison M. E., Green N. G., and Morgan H., IEE Proc.: Nanobiotechnol. 152, 129 (2005). 10.1049/ip-nbt:20050008 [DOI] [PubMed] [Google Scholar]
- MacDonald M. P., Neale S., Paterson L., Richies A., Dholakia K., and Spalding G. C., J. Biol. Regul. Homeost. Agents 18, 200 (2004). [PubMed] [Google Scholar]
- Johansson L., Nikolajeff F., Johansson S., and Thorslund S., Anal. Chem. 81, 5188 (2009). 10.1021/ac802681r [DOI] [PubMed] [Google Scholar]
- Wolff A., Perch-Nielsen I. R., Larsen U. D., Friis P., Goranovic G., Poulsen C. R., Kutter J. P., and Telleman P., Lab Chip 3, 22 (2003). 10.1039/b209333b [DOI] [PubMed] [Google Scholar]
- Kovac J. R. and Voldman J., Anal. Chem. 79, 9321 (2007). 10.1021/ac071366y [DOI] [PMC free article] [PubMed] [Google Scholar]
- Morgan H. and Green N. G., AC Electrokinetics: Colloids and Nanoparticles (Research Studies Press Ltd., Herts, England, 2003). [Google Scholar]
- Schnelle T., Muller T., Fiedler S., and Fuhr G., J. Electrost. 46, 13 (1999). 10.1016/S0304-3886(98)00055-2 [DOI] [Google Scholar]
- Gray D. S., Tan J. L., Voldman J., and Chen C. S., Biosens. Bioelectron. 19, 771 (2004). 10.1016/j.bios.2003.08.013 [DOI] [PubMed] [Google Scholar]
- Rosenthal A. and Voldman J., Biophys. J. 88, 2193 (2005). 10.1529/biophysj.104.049684 [DOI] [PMC free article] [PubMed] [Google Scholar]
- Mittal N., Rosenthal A., and Voldman J., Lab Chip 7, 1146 (2007). 10.1039/b706342c [DOI] [PubMed] [Google Scholar]
- Manaresi N., Romani A., Medoro G., Altomare L., Leonardi A., Tartagni M., and Guerrieri R., IEEE J. Solid-State Circuits 38, 2297 (2003). 10.1109/JSSC.2003.819171 [DOI] [Google Scholar]
- Thomas R. S., Morgan H., and Green N. G., Lab Chip 9, 1534 (2009). 10.1039/b819267g [DOI] [PubMed] [Google Scholar]
- Vulto P., Glade N., Altomare L., Bablet J., Del Tin L., Medoro G., Chartier I., Manaresi N., Tartagni M., and Guerrieri R., Lab Chip 5, 158 (2005). 10.1039/b411885e [DOI] [PubMed] [Google Scholar]
- Grosse C. and Schwan H. P., Biophys. J. 63, 1632 (1992). 10.1016/S0006-3495(92)81740-X [DOI] [PMC free article] [PubMed] [Google Scholar]
- Glasser H. and Fuhr G., Bioelectrochem. Bioenerg. 47, 301 (1998). 10.1016/S0302-4598(98)00146-9 [DOI] [Google Scholar]


