

Abstract
The goal of this study was to identify a set of hepatic genes regulated by ligand-dependent activation of the estrogen receptor in juvenile rainbow trout (Oncorhynchus mykiss). A custom rainbow trout oligo DNA microarray, which contains probes targeting approximately 1450 genes relevant to carcinogenesis, toxicology, endocrinology, and stress physiology was utilized to identify transcriptional fingerprints of in vivo dietary exposure to 17β-estradiol (E2), tamoxifen (TAM), estradiol + tamoxifen (E2 + TAM), diethylstilbestrol (DES), dehydroepiandrosterone (DHEA), dihydrotestosterone (DHT), and cortisol (CORT). Estrogen exposure altered the expression of up to 49 genes involved in reproduction, immune response, cell growth, transcriptional regulation, protein synthesis and modification, drug metabolism, redox regulation, and signal transduction. E2, DES, and DHEA regulated 18 genes in common, mostly those associated with vitellogenesis, cell proliferation, and signal transduction. Interestingly, DHEA uniquely regulated several complement component genes of importance to immune response. While the effect of TAM on E2-induced changes in gene expression was mostly antagonistic, TAM alone increased expression of VTG1 and other genes associated with egg development and immune response. Few genes responded to CORT treatment, and DHT significantly altered expression of only one gene targeted by the OSUrbt array. Hierarchical cluster and principal components analyses revealed distinct patterns of gene expression corresponding to estrogens and non-estrogens, though unique patterns could also be detected for individual chemicals. A set of estrogen-responsive genes has been identified that can serve as a biomarker of environmental exposure to xenoestrogens.
Keywords: estrogen, toxicogenomics, transcription profile, dehydroepiandrosterone, tamoxifen, genomics
Estrogens are essential for the normal growth, differentiation, development, and function of reproductive tissues. Moreover, these steroid hormones are important regulators of various physiological processes in other tissues considered nonclassical estrogen targets including bone, liver, kidney, cardiovascular system, spleen, lung, and brain. Most biological actions of estrogens in humans and other vertebrates are mediated by two distinct, differentially expressed intracellular receptors, estrogen receptor alpha (ERα) and estrogen receptor beta (ERβ), which are considered unusually promiscuous receptors having affinity for numerous environmental contaminants and pharmaceuticals. Human and animal exposures to xenoestrogens have been linked to reproductive tract and development abnormalities and increased risk of breast, ovary, and liver cancer (Damstra et al., 2002; Flötotto et al., 2001; Martin et al., 2007). Simple, standardized in vitro assays are available for preliminary screening of chemicals for possible carcinogenic or endocrine-disrupting properties including various ER gene reporter assays (Harris et al., 1997; Sanseverino et al., 2005). However, with recent advances in genomic technology, sophisticated experiments are now possible in which DNA microarrays are utilized to determine the expression level of hundreds to thousands of genes simultaneously. The potential of “omics” technologies applied to the field of toxicology is considerable and includes drug development, risk assessment of novel drugs, novel applications for existing drugs, discovery of diagnostic markers, and compound screening for potential toxic, carcinogenic, and/or endocrine-disrupting effects (Benninghoff, 2007; Hamadeh et al., 2002; Shirai and Asamoto, 2003). Researchers anticipate that DNA microarrays may be routinely used in the identification of a set of differentially regulated genes, a gene expression fingerprint, that would serve as a biomarker of specific chemical exposure and could be used in predicting adverse health effects based upon the apparent mode of action discerned from the gene expression data (Hamadeh et al., 2002). Several studies have described distinct gene expression patterns resulting from exposure to chemicals from multiple compound classes including heavy metals, polycyclic aromatic hydrocarbons, and xenoestrogens (Bartosiewicz et al., 2001; Hamadeh et al., 2002; Koskinen et al., 2004; Terasaka et al., 2004; Vezina et al., 2004; Wang et al., 2004). The knowledge of the potential mechanism of action of a suspect chemical can be very useful in the evaluation of potential hazards that xenobiotics may pose to human and environmental health.
Rainbow trout have been widely used as a research model in environmental toxicology studies for decades, and this species has been proposed as an appropriate animal model for studies in comparative ecotoxicogenomics (Denslow et al., 2007). Previously, researchers described the design, manufacture, and application of a custom oligonucleotide microarray (OSUrbt array) for trout (Tilton et al., 2005). The OSUrbt version 2 microarray contains 1676 elements representing approximately 1450 genes important for carcinogenesis, environmental toxicology, comparative immunology, stress physiology, and endocrinology. In the present study, the OSUrbt microarray was used to identify a set of hepatic genes regulated by ligand-dependent activation of the estrogen receptor in juvenile rainbow trout. We hypothesized that (1) the transcriptional profile resulting from exposure to model estrogen compounds would be distinct from that of non-estrogens, (2) a subset of genes commonly regulated by all estrogen treatments could be identified, and (3) the selective estrogen receptor modulator (SERM) tamoxifen (TAM) would antagonize estrogen-induced changes in expression of these fingerprint genes.
METHODS
Animal care
Mt Shasta strain rainbow trout were hatched and reared at the Sinnhuber Aquatic Research Laboratory at Oregon State University in Corvallis, Oregon. Fish were maintained in flow-through 375-l tanks with activated carbon water filtration, water temperature at 12°C, and a 12:12 h light:dark cycle. Each experimental group consisted of three tanks containing 15 juvenile trout approximately 15 months old with an average weight of 140 g. Fish were fed a maintenance ration (2.8% of body weight) of Oregon Test Diet, a semipurified casein-based diet with menhaden oil as the lipid (Lee et al., 1991), for 2 weeks prior to experimental treatments. All procedures for treatment, handling, maintenance, and euthanasia of trout used in this study were approved by the Oregon State University Institutional Animal Care and Use Committee.
Experimental exposures
Eight experimental treatments were selected to examine hepatic gene expression in response to estrogens, a SERM, and non-estrogens. Treatments and concentrations (calculated with respect to diet wet weight) are as follows: control (CON), 5 ppm 17β-estradiol (E2), 50 ppm TAM, 5 ppm E2 + 50 ppm TAM (E2 + TAM), 2 ppm diethylstilbestrol (DES), 500 ppm dehydroepiandrosterone (DHEA), 5 ppm dihydrotestosterone (DHT), and 5 ppm cortisol (CORT). Test chemicals were purchased from Sigma-Aldrich (St Louis, MO) and were added directly to the oil portion of the custom diet. Experimental treatments were administered for 14 days, and feeding occurred 5 days per week. The concentrations of E2 and DHEA were selected based upon their ability to significantly induce vitellogenin (Vtg) gene and protein expression (Tilton et al., 2006), and the concentration of DES was chosen based upon reported relative binding affinity for the trout estrogen receptor (Matthews et al., 2000). To examine potential agonistic and antagonistic effects of TAM, a 10-fold higher concentration of that chemical compared to E2 was tested alone and coadministered with 5 ppm E2. Finally, DHT and CORT were administered at concentrations equivalent to that of E2.
On day 15, trout were euthanized with an overdose (250 ppm) of tricane methanesulfonate. Four males were sampled from every experimental tank. Immediately after sacrifice, an approximate 200 mg portion of each liver was quick frozen in TRIzol reagent (Invitrogen, Carlsbad, CA) and stored at − 80°C. Body weight and liver weight were recorded at the time of sacrifice to calculate the hepatosomatic index (HSI = liver weight/body weight × 100), and blood sera E2 levels were measured using a commercial enzyme immunoassay kit (Cayman Chemical, Ann Arobor, MI).
RNA isolation and quality determination
Total hepatic RNA was extracted in TRIzol reagent according to supplier’s instructions. Equal amounts of RNA from each individual liver sample were subpooled according to tank (four males pooled per tank) resulting in three biological replicates for each treatment. A reference RNA pool was made by combining equal amounts of RNA from all individual male CON liver samples (12 liver samples in total). Following cleanup with the RNeasey Mini kit (Qiagen, Valencia, CA), RNA quantity and quality were ascertained using the NanoDrop ND-1000 UV-Vis Spectrophotometer (NanoDrop Technologies, Inc., Wilmington, DE) and the Bioanalyzer 2100 (Agilent, Palo Alto, CA), respectively.
Rainbow trout oligonucleotide microarray
Details on the development, manufacture, and quality control assessment of the OSUrbt microarray have been provided previously (Tilton et al., 2005) and will be only summarized here. Array printing and quality control analysis were conducted at the Center for Genome Research and Biocomputing at Oregon State University. Each element was printed in duplicate onto Corning UltraGap slides (Acton, MA). Additionally, 16 replicate sets (one for each array block) of 10 SpotReport Alien Oligos (Stratagene, La Jolla, CA) were also printed on each array. Inclusion of these control features allows for standardization across arrays and estimation of cDNA labeling efficiency, hybridization sensitivity, and intra- and interarray variability. Buffer-only spots were included as negative controls. Altogether, each array consists of 4096 spots. Array print quality (shape and alignment of features, missing features, etc.) was assessed by scanning for red reflectance using a ScanArray 4000 scanner (PerkinElmer, Boston, MA). One array per printing batch was subjected to quality control hybridization (SpotQC, Integrated DNA Technologies) to confirm absence or presence of DNA in appropriate features. Arrays were stored for less than 6 months prior to hybridization.
Microarray hybridization and scanning
For detection of gene expression on the OSUrbt array, the Genisphere 3DNA Array 350 kit (Hatfield, PA) was used in a dye-swap, reference sample design following the supplier’s protocol. During reverse transcription (SuperScript II, Invitrogen) of total RNA (7 μg) using the supplied Genisphere oligo d(T) primers, each biological sample was tagged separately with a capture sequence for one of two fluorescent dendromer reagents, Cy3 or Cy5. Each reverse transcription reaction also included spiked-in mRNA corresponding to the SpotReport Alien Oligo controls. Corresponding reference RNA was reverse transcribed with the capture sequence for the opposite reagent (Cy3 or Cy5). To account for any differences in dye labeling efficiency, technical replicates were performed for two of the three biological replicates so that the capture sequence tags for Cy3 and Cy5 were swapped between the sample and reference RNA (replicate A, reference is labeled Cy3 and sample is labeled Cy5; replicate B, reference is labeled Cy5 and sample is labeled Cy3). Five arrays per experimental treatment were processed, including the CON treatment.
Following reverse transcription, equal amounts of capture sequence–tagged sample and reference cDNA were combined, concentrated using the Millipore Microcon YM-30 (Billerica, MA), and treated with RNase cocktail (Ambion, Austin, TX) to degrade any remaining RNA. Hybridization of cDNA and capture reagents to the OSUrbt arrays was performed as described previously (Tilton et al., 2005) with a few modifications. Sterile 20× standard saline citrate (SSC) was prepared with 3 M sodium chloride and 0.3 M sodium citrate at a pH of 7.0; appropriate dilutions were made with sterile water for hybridization wash buffers. Sodium dodecyl sulfate (SDS) was also added to some hybridization wash buffers at a 0.1% (wt/vol) final concentration. Prior to hybridization, arrays were prewashed with gentle mixing on a rocking platform twice in 0.1% SDS for 5 min at room temperature (RT), twice in 2× SSC, 0.1% SDS for 10 min at 47°C, once in 0.1× SSC at RT for 5 min, and once in ultra-pure water for 5 min. Slides were dried by centrifugation. cDNA was hybridized to the arrays in formamide-based hybridization buffer (25% formamide, 4× SSC, 0.5% SDS and 2× Denhardt’s solution, Genisphere, Inc.) for 16 h at 47°C in a Hybex Microarray Incubation System (SciGene Corporation, Sunnyvale, CA). After hybridization, the arrays were rinsed in 2× SSC, 0.1% SDS for 10 min at 47°C in the Hybex water bath. Then, arrays were washed with gentle mixing twice in 2× SSC, 0.1% SDS for 5 min at 47°C, twice in 1× SSC for 5 min at RT, and twice in 0.1× SSC for 5 min at RT. Slides were dried by centrifugation and prewarmed to 49°C. Next, the 3DNA Cy3/Cy5 capture reagent mixture was hybridized to the arrays for 3 h at 49°C in the dark. After this second hybridization, the arrays were rinsed, washed, and dried again as previously described in SSC buffers containing 100 μM DTT dithiothreitol in the dark. All arrays were treated with DyeSaver2 Anti-fade Coating (Genisphere, Inc.) to preserve fluorescence of the capture reagent.
Within 24 h of hybridization, array images at a resolution of 5 μm were obtained using the ScanArray 4000 (PerkinElmer) with 90% laser power at 543 and 633 nm excitation wavelengths for Cy3 and Cy5, respectively. Photomultiplier tube settings were adjusted using the intensities of the SpotReport Alien Oligo controls to balance global intensities for the Cy3 and Cy5 fluors and to normalize across slides.
Image and data analyses
Array image files were processed, and spot intensities were quantified using QuantArray software (PerkinElmer); raw median signal and background values were obtained and uploaded to BioArray Software Environment (Saal et al., 2002) for database management and data normalization. For each array feature, raw median signal values were background corrected, LOWESS normalized, and exported to Excel (Microsoft Corp., Redmond, WA). Fold change in gene expression was determined by calculating the ratio of fluorescence intensity for the sample compared to the reference for each array feature. Average fold change values were calculated by determining the geometric mean for array technical replicates (duplicate spots for each element per array), treatment technical replicates (dye swaps), and finally for the biological replicates (n = 3) so that triplicate fold change expression values were available for every array element; these values were log2 transformed and uploaded to TM4 MultiExperiment Viewer (TMeV) (Saeed et al., 2003). Statistical analyses of gene expression were performed in TMeV using the normalized, geometric mean expression values for each biological replicate to compare experimental treatments to the control; a statistically significant change in gene expression was inferred when p < 0.05 (Welch’s t-test, between subjects and assuming unequal variances). Unsupervised, bidirectional hierarchical clustering and principal components analyses were performed in TMeV. Normalized data were also exported to GraphPad Prism 4 (GraphPad Software, Inc., San Diego, CA) for pairwise correlation analysis and for statistical comparisons of quantitative PCR expression data.
Gene annotation
Array feature annotation was performed by querying the Dana-Farber Cancer Institute (DFCI) R.trout Gene Index (http://compbio.dfci.-harvard.edu/tgi/) for the closest EST match to the array 70-mer sequence. Matching EST sequences were then BLASTX queried in the National Center for Biotechnology Information genome database. The top hit (lowest E-score) was selected as the matching gene. If an EST had no significant (E-value < 10−6) BLASTX hit, then the most significant BLASTN hit is shown. Additional information on the matching gene and BLASTX hit information are provided in Supplementary Table 3 including the DFCI accession number, the accession number for the corresponding GenBank nucleotide sequence and the species, E-value, % identity, and SwissProt accession number for the most significant BLASTX hit. For the proteins encoded by the putative trout homolog mRNAs, functional information was inferred from annotations in the Gene Ontology, Online Mendelian Inheritance in Man (OMIM), and SwissProt Protein Knowledgebase databases.
Real-time qRT-PCR
To validate changes in gene expression detected on the OSUrbt array, mRNA levels of select genes were evaluated by the quantitative real-time reverse transcriptase (qRT) PCR. Total hepatic RNA was used from the previous isolation as described above and treated with DNase (Invitrogen) following the supplier’s directions. Total RNA (1 μg) was reverse transcribed (Superscript II, Invitrogen) according to the supplier’s protocol with oligo d(T)18 primer and a final reaction volume of 50 μl. PCR was conducted using 1 μl of synthesized cDNA template, 0.3 μM each primer, and 1× SYBR Green PCR master mix (DyNAmo qPCR kit, Finnzymes, Finland) with a final reaction volume of 20 μl. Primer pairs were designed so that the PCR product contained the original 70-mer oligonucleotide sequence (unless noted otherwise), and the primer sequences are shown in Table 1. PCR was performed with a DNA Engine Cycler and Opticon 2 Detector (MJ Research, Waltham, MA) for 35 cycles with denaturation at 94°C for 10 s, annealing at the optimum temperature determined for each primer pair (54°C – 62°C) for 20 s and extension at 72°C for 18 s. For DNA quantification, the C(t) value was set to ensure that values were within the linear range of the fluorescence curve. PCR standards for each gene were prepared by gel purification of PCR products (QIAX II, Qiagen, Valencia, CA), quantified using the PicoGreen dsDNA Quantification Kit (Molecular Probes, Eugene, OR), and serially diluted for final concentrations ranging from 0.001 to 100 ng DNA.
TABLE 1.
Primer Set Sequences for Real-Time RT-PCR Validation of Gene Expression
| Gene (abbreviation) | Forward primer (5′ to 3′) | Reverse primer (5′ to 3′) | Size (bp) |
|---|---|---|---|
| β-actin (Act) | GTGCGGGATTATATCATTTACCCT | CCACGTAGCTGTCTTTCTGG | 221 |
| Cathepsin D (ctsD) | TCCACTATCCATCATCTACC | AGATCAGTGCATTTCAACTC | 272 |
| Complement component C5 (C5) | CTTCGGTAGTCAAGCGGAATA | CACACTGAGTCGGCAACCAG | 351 |
| Cytochrome P450 1A (CYP1A)a,b | TCAACTTACCTCTGCTGGAAGC | GGTGAACGGCAGGAAGGA | 85 |
| Cytochrome P450 2K5 (CYP2K5) | GTGTCAACTCTAATCTAGTGCCC | CCGTCCCTGATTGAAGTGAC | 368 |
| Estrogen receptor α (ESR1) | AGCTCCTGCTCCTGCTCT | GGAATGGGCATCTGGTCT | 310 |
| Estrogen receptor β (ESR2)a,c | GAGCATCCAAGGTCACAATG | CACTTTGTCATGCCCACTTC | 128 |
| Glyceraldehyde-3-phosphate dehydrogenase (GAPDH) | CCAACCAAACGCTACCGAAC | CCAGATTCCATCTCACCTT | 173 |
| Haptoglobin (hp1) | ATCTCCATTATGCCTTTGCT | AGGTGAAACATCAGAAACCA | 160 |
| Prostaglandin D synthase (PGDS) | CATAATGGGAGTTCTGCTGTG | TGGGATGTCAGTCTTCTTGG | 293 |
| Trout c-polysaccharide binding protein (tcpbp) | GGCCAAAGGAGACATCGTTT | TCCCAACCTACACCCTGACC | 155 |
| Vitellogenin (VTG1)d | TTGCCTTTGCCAACATCGAC | CGGACATTGACGTATGCTTT | 238 |
Primer pair does not surround the sequence for the corresponding 70-mer oligonucleotide on the OSUrbt array.
Glyceraldehyde-3-phosphate dehydrogenase (GADPH) and β-actin were selected as genes for normalizing the qRT-PCR data since neither microarray nor qRT-PCR analyses revealed significant treatment-induced changes in mRNA levels of these two housekeeping genes. All expression values obtained by qRT-PCR were normalized by the mean fold change of both genes. These normalization values were calculated from the ratio of pg cDNA for a biological replicate over the average pg cDNA for all three CON biological replicates for both β-actin and GADPH genes as follows: HSKGA = (ActA/Actavg) × (GADPHA/GADPHavg) where HSKGA indicates the mean fold change of the two housekeeping genes, A indicates the biological replicate, and avg indicates the average of three biological replicates. For comparison to microarray expression values, fold-change ratios were calculated for treated samples compared to the CON treatment.
Vtg ELISA
Blood samples from each donor animal were obtained at sacrifice. The plasma fraction of each sample was obtained by centrifugation at 850X g and then snap frozen at − 80°C. Blood plasma Vtg was measured following an ELISA procedure previously described (Donohoe and Curtis, 1996; Shilling et al., 2001) using a rabbit anti-chum salmon Vtg antibody graciously donated by A. Hara at Hokkaido University. Briefly, samples were incubated with the VTG antibody (1:1500) in 96-microwell plates for 24 h at 4°C and then were transferred to preblocked plates (1% bovine serum albumin) coated with purified rainbow trout VTG (25 ng per well) and incubated again for 24 h at 4°C. To develop the assay, the plates were first incubated with biotinylated donkey anti-rabbit IgG (1:1500, GE Healthcare, Buckinghamshire, U.K.) for 2 h at 37°C, then with streptavidin horseradish peroxidase conjugate (1:600, GE Healthcare) for 2 h at 37°C, and finally with 0.01% 3,3′5,5′-tetramethylbenzidine and 0.01% hydrogen peroxide in 0.5 M sodium acetate, pH 6.0, for 10 min at RT. Color development was stopped with 2 M sulfuric acid. Absorbance at 450 nm was measured on a SpectraMax 190 spectrophotometer with SoftMax Pro 4.0 software (Molecular Devices, Sunnyvale, CA). A Vtg standard curve (6.25–3200 ng/ml) was included in every assay plate, and the Vtg concentration of each sample was calculated from the linear portion of this curve (GraphPad Software). The interassay coefficient of variance was 8.4% with an assay detection limit of 6.25 ng/ml. Equal volumes (100 μl) of blood plasma from four males were pooled by tank so that each pool represented a biological replicate, as in the microarray experiment. Each sample was assayed in duplicate with a minimum of three dilutions (1:10 to 1:500 for samples with expected low Vtg levels; 1:5000 to 1:50 000 for samples with expected high Vtg levels) to ensure that absorbance values of unknowns were within the linear part of the standard curve.
RESULTS
Hepatosomatic Indices and Blood Plasma E2 Levels in Experimental Animals
The 14-day dietary exposure to the experimental treatments described above did not significantly alter body weight, although hepatosomatic indices were significantly increased in trout fed E2, E2 + TAM, and DHEA compared to control animals (Supplementary Fig. 1); HSI values were not significantly altered in animals treated with DES, TAM, DHT, or CORT. Blood sera levels of E2 in animals fed E2, E2 + TAM, or DHEA were also markedly elevated (Supplementary Fig. 2); DHEA did not significantly cross-react with the E2-specific antibody in the Enzyme immunoassay (data not shown).
Data Filtering and Comparison of Numbers of Genes Regulated by Experimental Treatments
All raw gene expression data are available at the Gene Expression Omnibus online microarray data repository (http://www.ncbi.nlm.nih.gov/geo/, accession GSE8226). Calculated fold-change ratios of experimental samples compared to reference after background subtraction and LOWESS normalization are provided in Supplementary Table 1. Quality control analysis of array hybridization using the SpotReport Alien oligos showed that, in general, intra- and interarray variability was low and that hybridization was consistent and reproducible (Supplementary Fig. 3).
Multiple criteria were used to reduce the original raw data sets to subsets of genes considered as significantly regulated by any one of the experimental treatments. Results of the stepwise application of these criteria are shown in Table 2. These criteria included filters for statistical significance (p value < 0.05 by Welch’s t-test with unequal variance), spot consistency (> 1.5-fold change in 9 out of the 10 biological and technical replicate features) and mean fold change (> 2-fold). Many more genes were identified as statistically significant by the Welch’s t-test than were included in the final gene list (Table 2). Inclusion of the 2-fold change criterion eliminated numerous genes that were modestly induced or repressed by the experimental treatments.
TABLE 2.
Summary of Array Data following Application of Filters for Significance, Consistency, and Level of Response
| Number of features passing indicated criterion | ||||
|---|---|---|---|---|
| Treatment | Welch’s t-testa | Mean 2-fold changeb | Spot consistencyc | All criteriad |
| CON | N/A | 0 | 0 | 0 |
| E2 | 229 | 76 | 74 | 49 |
| TAM | 65 | 18 | 10 | 6 |
| E2 + TAM | 98 | 29 | 23 | 16 |
| DES | 121 | 42 | 33 | 21 |
| DHEA | 202 | 89 | 55 | 43 |
| DHT | 52 | 3 | 2 | 1 |
| CORT | 56 | 10 | 8 | 3 |
Number of array features that were identified as significantly regulated by the Welch’s t-test ( p < 0.05) when comparing each experimental treatment to control (n = 3). Results of the Welch’s t-test are shown in Supplementary Table 2.
Number of array features that had a minimum 2-fold change in the geometric mean of biological replicates.
Number of array features for which 9 out of 10 spots (including all technical and biological replicates) were differentially regulated >1.5-fold.
Number of array features that met all three filtering criteria.
Genes that passed all three stringency criteria are listed in three tables categorized by the type of response or lack thereof to E2 exposure. Genes induced or repressed by E2 are listed in Tables 3 and 4, respectively. Genes that were not altered by E2 exposure, but were induced or repressed by one of the other experimental treatments, are listed in Table 5. Gene descriptions are provided based on sequence homology using the most significant (E < 10−6) BLASTX hit. While most OSUrbt array features represent unique genes, some elements represent distinct oligonucleotide sequences for the same gene (i.e., OmyOSU208 and OmyOSU222 array features both targeted vitellogenin). Thus, the average of the expression values for all features matching the indicated gene is reported (Tables 3–5); mean fold change values for each array element are available in Supplementary Table 3.
TABLE 3.
Genes Significantly Upregulated by Dietary Exposure to E2 Compared to Other Estrogen and Non-estrogen Treatments
| Mean fold change in gene expressionb |
||||||||
|---|---|---|---|---|---|---|---|---|
| Abbreviation | Gene description (DFCI accession/GenBank accession)a | E2 | TAM | E2 + TAM | DES | DHEA | DHT | CORT |
| Vitellogenesis, egg growth, and development | ||||||||
| VTG1 | Vitellogenin (TC94769/X92804)c | 63.6 | 21.85 | 45.1 | 48.9 | 45.4 | 2.00 | 1.15 |
| VEP | Vitelline envelope protein gamma (TC95127/AF231708) | 36.9 | 9.17 | 29.9 | 41.8 | 34.0 | 1.52 | 0.98 |
| ZRP | Zona radiata structural protein (TC128751/AF407574) | 36.2 | 14.5 | 22.4 | 38.9 | 28.0 | 1.44 | 1.40 |
| Signal transduction and regulation of transcription and protein synthesis | ||||||||
| ESR2 | Estrogen receptor beta (NP543968/AJ289883) | 38.5 | 3.93 | 23.2 | 19.9 | 21.3 | 1.16 | 1.00 |
| ikk1 | Inhibitor of nuclear factor kappa-B kinase subunit alpha (BE669068/BC051614)c | 12.0 | 1.07 | 4.02 | 2.95 | 4.95 | 0.97 | 0.89 |
| ESR1 | Estrogen receptor alpha (TC94766/AJ242740)c | 3.96 | 1.34 | 2.66 | 3.45 | 2.59 | 0.90 | 0.77 |
| tbp | TATA box–binding protein (TC108100/AY168633) | 5.70 | 1.00 | 2.03 | 1.74 | 2.09 | 0.93 | 0.97 |
| klf9 | Similar to Kruppel-like factor 9 (CA377027/XM_681155) | 2.59 | 1.33 | 2.65 | 2.32 | 3.11 | 1.06 | 1.17 |
| dmrt5 | Doublesex- and mab-3–related transcription factor 5 (TC97895/DQ335470) | 2.26 | 1.08 | 1.74 | 1.70 | 1.92 | 0.83 | 1.03 |
| rps11 | 40S ribosomal protein S11 (TC114276/AF304161) | 2.19 | 1.02 | 1.19 | 1.34 | 1.13 | 1.26 | 1.14 |
| pabpc1a | Poly A–binding protein, cytoplasmic 1 a (TC128934/BC099992) | 2.17 | 1.14 | 1.44 | 1.69 | 1.63 | 1.11 | 1.00 |
| calm1 | Calmodulin 1 (TC105394/AB222133) | 2.05 | 1.21 | 1.10 | 1.07 | 1.36 | 1.05 | 1.00 |
| wars | Tryptophanyl-tRNA synthetase (TC114439/BC049526) | 2.03 | 1.44 | 1.22 | 1.18 | 2.54 | 1.09 | 1.31 |
| Protein folding, transport and modification, and proteolysis | ||||||||
| ctsD | Cathepsin D (TC128395/U90321) | 3.70 | 1.07 | 1.71 | 1.68 | 2.34 | 1.05 | 0.99 |
| Sec61αB | Sec61 alpha subunit isoform B (TC118879/AF346601)c | 3.58 | 1.33 | 1.83 | 2.24 | 2.95 | 1.00 | 1.14 |
| GP96 | Chaperone protein GP96 (TC115491/BC063951) | 2.56 | 1.16 | 1.38 | 1.54 | 1.91 | 0.81 | 0.94 |
| psmN3 | Proteasome subunit N3 (CX124336/AF361366) | 2.55 | 1.12 | 1.40 | 1.53 | 2.00 | 1.12 | 1.14 |
| calrl | Calreticulin (BE859101/DQ535486) | 2.26 | 1.04 | 1.42 | 1.50 | 1.18 | 0.80 | 1.07 |
| tram | Translocating chain-associating membrane protein (TC113467/BC063238) | 2.22 | 1.15 | 0.96 | 1.43 | 1.62 | 0.85 | 1.05 |
| HSP47 | Heat shock protein 47(TC128039/AB196463) | 2.13 | 1.16 | 1.30 | 1.24 | 1.34 | 0.97 | 0.89 |
| xpnpep1 | X-prolyl aminopeptidase 1, soluble (TC106422/BC064889) | 2.12 | 0.96 | 0.90 | 1.26 | 1.05 | 1.44 | 1.01 |
| Sec61αA | Sec61 alpha subunit isoform A (TC109072/AF346600) | 2.09 | 1.04 | 1.25 | 1.12 | 1.41 | 0.96 | 0.91 |
| Cell cycle, growth, and proliferation | ||||||||
| cd82 | CD82 antigen (CA376182/CR760215) | 6.49 | 1.13 | 2.53 | 2.85 | 4.68 | 1.03 | 1.06 |
| TM4SF | Putative transmembrane 4 superfamily member protein (TC102320/AF281357) | 2.41 | 1.15 | 1.58 | 1.85 | 8.21 | 1.12 | 1.02 |
| Dip13b | DCC-interacting protein 13 beta (TC125843/AY113706) | 2.21 | 1.01 | 1.45 | 1.35 | 1.43 | 1.12 | 1.13 |
| Stress, immune response, and inflammation | ||||||||
| VHSV4 | VHSV-induced protein-4 (TC100075/AF483530) | 56.1 | 4.47 | 23.5 | 31.6 | 35.8 | 3.13 | 0.92 |
| VHSV6 | VHSV-induced protein-6 (TC109185/AF483532) | 7.69 | 1.67 | 4.43 | 5.11 | 5.43 | 1.09 | 1.06 |
| Vig1 | Viperin (TC96803/AF076620) | 3.22 | 1.09 | 1.26 | 1.69 | 2.11 | 1.03 | 1.05 |
| sdf2l1 | Stromal cell–derived factor 2–like 1 (TC127805/BC078401) | 2.78 | 1.23 | 1.61 | 1.74 | 1.90 | 1.06 | 1.09 |
| sarp | Putative serum albumin–related protein (TC102320/AF281358) | 2.50 | 1.24 | 1.13 | 1.71 | 1.80 | 1.10 | 1.26 |
| mbl | C-type mannose–binding lectin (TC116194/AM041212) | 2.30 | 1.28 | 1.71 | 2.60 | 1.63 | 0.87 | 0.83 |
| MHC1 | MHC class I heavy chain (TC94778/AF318187) | 2.26 | 1.41 | 1.89 | 1.50 | 2.32 | 1.77 | 1.28 |
| Miscellaneous | ||||||||
| UrdPase1 | Similar to uridine phosphorylase 1 (TC131311/XM_685152) | 4.29 | 1.41 | 2.51 | 2.97 | 3.02 | 1.06 | 1.04 |
| Syn2B | Synapsin 2B (TC125114/AY157995) | 3.04 | 1.21 | 1.27 | 1.52 | 1.85 | 0.78 | 0.76 |
| creld2 | Cysteine-rich with EGF-like domain protein 2 (TC100844/BC055626) | 2.43 | 1.29 | 1.82 | 1.53 | 1.77 | 0.96 | 1.12 |
| tubb | Beta tubulin (TC98663/AF255554) | 2.30 | 1.68 | 2.12 | 1.43 | 3.15 | 0.81 | 0.58 |
| sdha | Succinate dehydrogenase flavoprotein subunit A (TC106837/BC045885) | 2.24 | 1.22 | 1.89 | 2.19 | 1.78 | 1.10 | 1.04 |
| GH1 | Somatotropin 1 precursor (TC109753/M22731) | 2.03 | 1.02 | 1.26 | 1.45 | 1.43 | 1.00 | 1.13 |
| Unknown function | ||||||||
| RTN9-A2 | Reticulon 9-A2 (TC100257/BK005094) | 3.42 | 1.54 | 3.37 | 3.46 | 3.31 | 1.43 | 0.89 |
| RTN9-A1 | Reticulon 9-A1 (TC103467/BK005095) | 3.39 | 1.67 | 3.25 | 3.03 | 2.56 | 0.86 | 0.67 |
The most significant BLASTX hit is shown.
Geometric mean fold change values are shown (n = 3) and represent background corrected. Lowess normalized signal ratio calculated with respect to the reference control. Values in bold are considered statistically significant ( p ≤ 0.05 by Welch’s t-test) and passed all stringency criteria. Values in bold italics passed all stringency criteria, though were not statistically significant due to high biological variability. Values underlined were determined to be statistically significant but did not pass all stringency criteria. Standard deviation and p values for each expression measurement are available in the complete spreadsheet provided in Supplementary Table 2.
In some cases, unique array features targeted the same gene (i.e., OmyOSU208 and OmyOSU222 features both targeted vitellogenin). Thus, the average of the expression values for all features matching the indicated gene is shown for each experimental treatment. Individual mean expression values for each matching feature are available in Supplementary Table 3.
TABLE 4.
Genes Significantly Downregulated by Dietary Exposure to E2 Compared to Other Estrogen and Non-estrogen Treatments
| Mean fold change in gene expressiona |
||||||||
|---|---|---|---|---|---|---|---|---|
| Abbreviation | Gene description (DFCI accession/GenBank accession)a |
E2 | TAM | E2 + TAM | DES | DHEA | DHT | CORT |
| Signal transduction and regulation of transcription | ||||||||
| TRAF2 | Tumor necrosis factor receptor–associated factor 2 (NP814796/AJ548839) |
0.49 | 0.89 | 0.66 | 0.65 | 0.61 | 1.36 | 1.29 |
| dmrt2 | Doublesex- and mab-3–related transcription factor 2 (NP543963/AF209096) |
0.24 | 0.91 | 0.76 | 0.38 | 0.40 | 0.73 | 0.65 |
| Cell cycle, growth, and proliferation | ||||||||
| BMP7 | Bone morphogenetic protein 7 (AY928083) | 0.38 | 0.78 | 0.64 | 0.35 | 0.29 | 0.85 | 0.74 |
| BRMS1L | Breast cancer metastasis-suppressor 1–like protein (TC106070/BC097187) |
0.35 | 0.74 | 0.61 | 0.40 | 0.28 | 0.77 | 0.70 |
| Cdc2l1 | Cell division cycle 2–like 1 protein (TC105829/BC051012) |
0.23 | 0.92 | 0.77 | 0.42 | 0.42 | 0.90 | 0.90 |
| Extracellular matrix and vascularization factors | ||||||||
| mmp | Matrix metalloproteinase (TC107009/ AB043536) |
0.35 | 0.75 | 0.69 | 0.32 | 0.35 | 0.64 | 0.61 |
| EPD-1 | Ependymin precursor (TC126766/M93697) | 0.29 | 0.72 | 0.67 | 0.47 | 0.69 | 1.02 | 1.35 |
| ang | Similar to angiogenin (CA356156/XM_001339184) |
0.41 | 0.83 | 0.72 | 0.65 | 0.49 | 1.15 | 1.06 |
| Immune response | ||||||||
| cd80 | CD80-like protein (CA347121/AJ634728) | 0.44 | 1.08 | 0.90 | 1.00 | 0.50 | 1.36 | 1.04 |
| tcpbp | Trout C-polysaccharide–binding protein 1 (TC99535/AF281345)c |
0.37 | 0.60 | 0.27 | 0.51 | 0.25 | 0.79 | 0.79 |
| chmtxn | Chemotaxin (TC102213/AF271114) | 0.32 | 0.73 | 0.64 | 0.48 | 0.64 | 1.04 | 1.51 |
| Redox regulation, drug metabolism, and nitrogen compound metabolism | ||||||||
| cat | Catalase (TC101266/BC051626) | 0.47 | 1.03 | 1.00 | 0.69 | 0.44 | 0.92 | 0.68 |
| BTD | Biotinidase (TC125922/AF527754) | 0.38 | 0.79 | 0.72 | 0.43 | 0.31 | 0.93 | 0.70 |
| CYP2K5 | Cytochrome P450 2K5 (TC95312/AF151524) | 0.18 | 0.80 | 0.68 | 0.35 | 1.45 | 1.07 | 0.82 |
| Unknown function | ||||||||
| MGC86242 | Similar to MGC86242 protein (TC107670/XM_683913) |
0.48 | 0.78 | 0.57 | 0.41 | 0.47 | 0.79 | 0.68 |
The most significant BLASTX hit is shown.
Geometric mean fold change values are shown (n = 3) and represent background corrected, Lowess normalized signal ratio calculated with respect to the reference control. Values in bold are considered statistically significant ( p ≤ 0.05 by Welch’s t-test) and passed all stringency criteria. Values in bold italics passed all stringency criteria though were not statistically significant due to high biological variability. Values underlined were determined to be statistically significant but did not pass all stringency criteria. Standard deviation and p values for each expression measurement are available in the complete spreadsheet provided in Supplementary Table 2.
In some cases, unique array features targeted the same gene. Thus, for each experimental treatment, the average of the expression values for all features matching the indicated gene is shown. Individual mean expression values for each matching feature are available in Supplementary Table 3.
TABLE 5.
Genes Differentially Regulated by Estrogen or Non-estrogen Experimental Treatments, but Not Estradiol
| Mean fold change in gene expressionb |
||||||||
|---|---|---|---|---|---|---|---|---|
| Abbrev. | Gene description (DFCI accession/GenBank accession)a | E2 | TAM | E2 + TAM | DES | DHEA | DHT | CORT |
| Protein folding, transport and modification, and proteolysis | ||||||||
| zgc:64202 | Hypothetical protein zgc:64202 (HSP20 family) (CA375485/BC057441) |
0.74 | 0.83 | 0.76 | 0.91 | 2.02 | 1.00 | 0.80 |
| ctsS | Cathepsin S cysteine protease (BX318408/AY950578) | 0.66 | 0.84 | 0.76 | 0.89 | 0.47 | 1.00 | 0.98 |
| CHTRII | Chymotrypsinogen 2–like protein (TC118872/AY550949)c | 1.34 | 1.49 | 0.36 | 0.75 | 1.02 | 1.12 | 0.35 |
| sae2 | SUMO-activating enzyme subunit 2 (TC118263/BC055614) | 0.64 | 0.97 | 0.96 | 0.80 | 0.35 | 0.74 | 0.86 |
| Extracellular matrix and vascularization factors | ||||||||
| DPT | Hypothetical protein (dermatopontin precursor) (TC107683/BC135061)c |
0.79 | 1.10 | 0.77 | 1.19 | 2.26 | 0.86 | 3.06 |
| cd9 | CD9 antigen, platelet aggregation (TC107610/BC059691) | 0.66 | 1.03 | 1.07 | 0.91 | 2.33 | 1.00 | 0.94 |
| tf | Tissue factor precursor (TC94881/AJ295167) | 0.43 | 0.72 | 0.49 | 0.71 | 0.46 | 0.71 | 0.87 |
| Cytoskeleton and microtubule processes | ||||||||
| GTbalphaB | Alpha tubulin (CX136150/AF082027) | 1.26 | 1.39 | 1.47 | 1.43 | 2.49 | 1.22 | 1.01 |
| SPG4 | Spastin (TC127698/AF540879) | 0.56 | 0.72 | 0.73 | 0.48 | 0.77 | 0.86 | 0.60 |
| Stress, immune response, and inflammation | ||||||||
| gal8 | Galectin 8 (TC109627/DQ317974) | 0.71 | 1.09 | 0.92 | 1.09 | 1.89 | 0.89 | 2.92 |
| VHSV7 | VHSV-induced protein-7 (TC94860/AF396869) | 1.80 | 1.20 | 1.67 | 1.81 | 2.71 | 1.26 | 1.41 |
| hp1 | Haptoglobin 1 (TC125533/AF271114)c | 0.98 | 1.20 | 0.94 | 1.35 | 0.85 | 1.41 | 2.64 |
| hp2 | Haptoglobin fragment 2 (TC113043/AF281330) | 0.70 | 0.88 | 0.68 | 0.94 | 0.49 | 1.42 | 2.14 |
| MHC1 | MHC class I heavy chain (TC102113/AF296366) | 0.60 | 0.69 | 0.49 | 0.69 | 0.61 | 0.80 | 0.57 |
| c1r/c1s | C1R/C1S subunit of Ca2+-dependent complex (TC95862/AJ519930) |
0.91 | 0.94 | 0.93 | 0.87 | 0.49 | 0.83 | 0.95 |
| C3–3 | Complement component C3–3 (TC119516/U61753) | 0.59 | 0.81 | 1.07 | 0.95 | 0.36 | 1.00 | 1.13 |
| C3–4 | Complement component C3–4 (TC112320/AF271080) | 0.61 | 0.83 | 1.03 | 0.96 | 0.37 | 0.87 | 1.10 |
| C5 | Complement component C5 (NP543817/AF349001) | 0.67 | 0.87 | 0.79 | 0.68 | 0.27 | 0.56 | 0.80 |
| Redox regulation and drug metabolism | ||||||||
| sult1st6 | Sulfotransferase family, cytosolic sulfotransferase 6 (BX308426/BC075996) |
1.16 | 1.61 | 1.34 | 1.28 | 2.26 | 1.04 | 0.74 |
| gstt1 | Glutathione S-transferase, theta 1 (TC103737/BC056725) | 1.05 | 1.22 | 1.04 | 1.31 | 2.13 | 1.46 | 1.37 |
| cox6A1 | Cytochrome c oxidase polypeptide VIa, mitochondrial (TC116478/U83980) |
0.96 | 0.77 | 0.91 | 0.91 | 0.31 | 1.00 | 0.94 |
| Metabolism and/or transport of lipids, cholesterol, and carbohydrates | ||||||||
| fabp | Fatty acid–binding protein, heart type (TC122452/U95296) | 1.14 | 1.04 | 1.05 | 0.77 | 2.04 | 1.08 | 0.63 |
| h-fabp | Fatty acid–binding protein (TC105232/AF281344) | 0.85 | 0.85 | 0.67 | 0.47 | 2.56 | 0.98 | 1.17 |
| PGDS | Prostaglandin D synthase (TC98197/AF281353)c | 0.69 | 0.21 | 0.65 | 0.45 | 0.78 | 0.88 | 1.06 |
| Ion binding and/or transport | ||||||||
| icta | Ictacalcin (TC112785/DQ086184) | 0.94 | 1.29 | 1.26 | 0.84 | 4.03 | 1.03 | 0.82 |
| fth2 | Ferritin H2 (TC117190/D86626) | 0.56 | 0.78 | 0.79 | 0.86 | 0.42 | 1.01 | 1.19 |
| Miscellaneous | ||||||||
| gth2b | Gonadotropin subunit beta-2 (TC109123/AY515501) | 0.91 | 0.94 | 0.77 | 1.02 | 1.54 | 0.90 | 2.25 |
| NDK | Nucleoside diphosphate kinase (TC101340/AF350241) | 1.73 | 1.19 | 1.34 | 1.22 | 2.21 | 1.23 | 1.22 |
| CPSaseIII | Carbamoyl-phosphate synthetase III (TC112543/U65893) | 0.83 | 1.09 | 1.08 | 1.01 | 0.48 | 0.96 | 1.00 |
| Spp-24 | Secreted phosphoprotein 24 (CX260699/AJ580808) | 0.66 | 0.97 | 0.97 | 0.87 | 0.46 | 1.10 | 0.87 |
| ccnd1 | G1/S-specific cyclin-D1 (CA369064/BC075743) | 0.63 | 0.99 | 0.89 | 0.76 | 0.45 | 0.86 | 1.16 |
| dlat | Dihydrolipoamide S-acetyltransferase (TC109136/AY188775) | 1.04 | 0.63 | 0.82 | 1.00 | 0.38 | 0.75 | 0.80 |
| Unknown function | ||||||||
| E2IG5 | Similar to growth and transformation-dependent protein (TC107928/NM_001046592) |
0.74 | 0.85 | 0.84 | 0.97 | 2.01 | 1.02 | 0.84 |
The most significant BLASTX hit is shown.
Geometric mean fold change values are shown (n = 3) and represent background corrected, Lowess normalized signal ratio calculated with respect to the reference control. Values in bold are considered statistically significant ( p ≤ 0.05 by Welch’s t-test) and passed all stringency criteria. Values in bold italics passed all stringency criteria, though were not statistically significant due to high biological variability. Values underlined were determined to be statistically significant but did not pass all stringency criteria. Standard deviation and p values for each expression measurement are available in the complete spreadsheet provided in Supplementary Table 2.
In some cases, unique array features targeted the same gene. Thus, for each experimental treatment, the average of the expression values for all features matching the indicated gene is shown. Individual mean expression values for each matching feature are available in Supplementary Table 3.
Of the approximate 1450 genes represented on the OSUrbt array, fewer than 4% were significantly regulated by any of the experimental treatments. E2 exposure altered the expression of 49 genes, more than any of the other compounds tested. More transcripts were significantly induced by E2 (38 genes) than were repressed (11 genes), and this pattern was similar for most of the experimental treatments (Tables 3 and 4). E2, DES, and DHEA commonly altered expression of 18 genes (Fig. 1), though DHEA exposure differentially regulated 18 additional genes that were not similarly affected by E2 or DES (Table 5). TAM induced expression of five transcripts that were also upregulated by E2 (Fig. 1). When TAM was coadministered with E2, fewer total genes were differentially regulated compared to E2 alone. DHT, a nonaromatizable androgen, significantly altered the expression of only one transcript, which was also induced by E2. Exposure to the non-estrogenic corticosteroid hormone CORT had no effect on expression of genes that were regulated by E2, though expression levels of three other mRNAs were uniquely induced (Table 5). Some genes were identified that surpassed both the spot consistency and fold change criteria but did not pass the statistical criterion due to high variability among the biological replicates. These genes have been included in Tables 3–5 for informational purposes but were not included in the treatment group tallies.
FIG. 1.
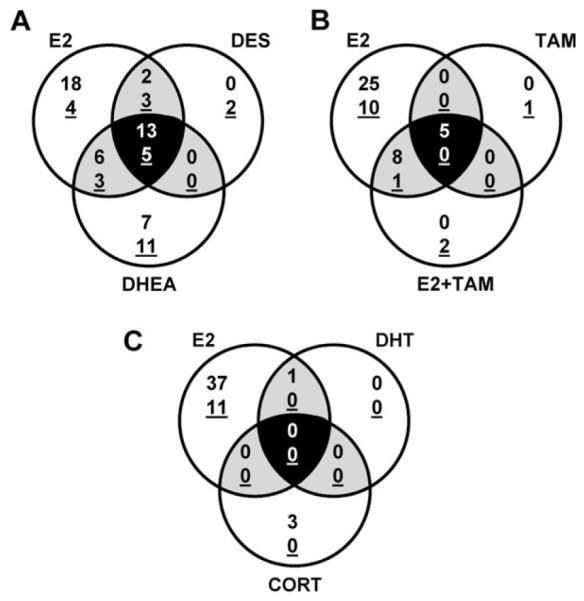
Venn diagrams depicting overlap of differentially regulated genes among the experimental treatments, which are grouped to compare E2-induced changes in hepatic gene expression to genes regulated by (A) DES and DHEA treatments, (B) TAM and E2 + TAM and (C) DHT and CORT. Numbers of genes that were significantly induced or repressed (underlined) by experimental treatments are indicated.
Biological Processes Associated with Differentially Regulated Genes
Genes have been categorized by function based on putative trout homologs using the Gene Ontology, OMIM, and SwissProt Protein Knowledgebase databases. The functional categories listed in Tables 3–5 were defined by the authors based on information obtained for each gene from the above sources. The biological processes associated with hepatic genes differentially regulated by dietary exposure to estrogenic and non-estrogenic treatments are indicated within each gene list table. The transcripts differentially regulated by E2 represent numerous biological processes important for signal transduction, transcription, translation, protein modification and protein transport, redox regulation, drug metabolism, stress and immune response, extracellular matrix, and cell cycle, growth, and proliferation. Genes associated with vitellogenesis and immune response were most strongly induced by estrogen exposure (> 30-fold increase), whereas the strongest repressions of gene expression (> 4-fold decrease) were observed for transcripts associated with cell cycle, growth, and proliferation (e.g., cdc2l1), transcription (e.g., dmrt2), and drug metabolism (CYP2K5). Finally, several transcripts encoding proteins of unknown biological function were differentially regulated in E2-exposed animals, including RTN9A-1 and RTN9A-2.
Of the 18 mRNAs commonly regulated by E2, DES, and DHEA, some encoded transcripts for proteins associated with vitellogenesis and egg development, signal transduction and transcription, protein transport, immune response, and cell proliferation. While 22 genes were determined to be uniquely regulated by E2, treatment with DES and DHEA influenced expression of most of these genes in a similar manner though to a lesser degree (e.g., klf9, dmrt5, tcpbp, chmtxn, sdha, and TM4SF). Some unique targets for E2 included a number of transcripts involved in signal transduction, drug metabolism, and protein synthesis, folding, and transport. DHEA exposure exclusively altered expression of 18 genes, including mRNAs encoding proteins associated with ion binding and transport (icta and fth2) and redox regulation (cox6A1). Also, multiple transcripts encoding complement components C3–3, C3–4, and C5 were significantly repressed in DHEA-exposed animals.
Genes induced by TAM were similar to those upregulated by E2, including mRNAs encoding proteins involved in vitellogenesis, transcription, and immune response, although the degree of response was much lower in TAM-exposed animals. TAM uniquely repressed expression of PGDS by approximately 5-fold compared to control. Combined treatment of E2 + TAM resulted in many fewer differentially expressed genes compared to E2 treatment alone; for most genes determined to be significantly induced or repressed by cotreatment of E2 + TAM, the degree of change was reduced compared to E2 exposure alone.
Transcripts induced by CORT exposure include hp1 and hp2, involved in the acute phase immune response, and gth2b, which is an important reproductive hormone.
Relationships of Gene Expression Profiles among Estrogen and Non-Estrogen Treatments
Several analytical approaches were used to examine the relationships of transcript profiles among the estrogen and non-estrogen treatments. First, values for all 1676 array elements were charted in scatter-plot graphs to compare directly the E2-induced gene expression profile with each of the other experimental treatments (Fig. 2). A correlation coefficient (r value) for each comparison was calculated from the linear regression of the two data sets. Pairwise analyses revealed strong correlations between E2 and DES, DHEA, and E2 + TAM treatments (r = 0.891, 0.803, and 0.844, respectively) and a moderate correlation between E2 and TAM treatments (r = 0.687) (Figs. 2A–D). Alternatively, the E2 expression profile was poorly correlated with profiles for DHT and CORT treatments (r < 0.001 and = 0.085, respectively) (Figs. 2E and 2F).
FIG. 2.

Pairwise correlation of E2-induced hepatic gene expression compared to (A) TAM, (B) E2 + TAM, (C) DES, (D) DHEA, (E) DHT, and (F) CORT. Values are the geometric mean of fold change (log2) compared to the control reference pool for each array feature (n = 3). All array features are plotted pairwise between E2 and each experimental treatment to generate correlation graphs. Pearson correlation (r) values are indicated for each comparison.
Hierarchical cluster analyses were used to visualize patterns of gene expression for estrogen and non-estrogen treatments for either all array elements (Fig. 3A) or for a subset of genes that were significantly regulated by any one of the experimental treatments (Fig. 3B). Bidirectional hierarchical clustering, in which expression values were sorted according to similarity of expression among all genes (left tree) and among all samples (top tree), revealed distinct patterns of expression corresponding to two primary nodes in the sample tree. In a subset of genes that were regulated by at least one of the experimental treatments, the left node includes estrogen treatments E2, DES, and DHEA, as well as the E2 + TAM treatment group (Fig. 3B). The right node includes CON, DHT, and CORT samples as well as TAM samples within a separate subnode. Distinct patterns of gene expression are evident for each experimental condition.
FIG. 3.

Unsupervised cluster analyses of estrogen and non-estrogen-induced changes in hepatic gene expression. Bidirectional hierarchical clustering analyses were performed using sample data for either (A) all array features or (B) a subgroup of genes that were significantly regulated in at least one treatment. Patterns of gene expression were clustered in two directions, by gene (left tree) and treatment (top tree), using the Euclidean distance method with average linkage. Log2 fold change expression values are shown for each biological replicate (n = 3) in panel A, and the mean log2 fold change is shown in panel B. Expression values are colored according to the indicated scale: red, up-regulation; green, down-regulation; black, unchanged expression. Abbreviations and GenBank accession numbers are indicated for each gene in panel B.
Principal components analysis was used to reduce the dimensionality of the gene expression data sets so that general relationships between experimental treatments could be discerned more easily (Fig. 4). This analysis supports the observations from previous correlation analyses indicating that estrogen treatments have gene expression profiles distinct from non-estrogens. CON, CORT, and DHT treatments grouped closely together (Fig. 4, hatched gray circle), whereas E2, DES, and E2 + TAM treatments were grouped together distant from and were the non-estrogen group (Fig. 4, solid gray circle). TAM and DHEA treatments were isolated within the PCA plot, indicating that gene expression signatures for these compounds are distinct from each other and from the estrogen and non-estrogen groups.
FIG. 4.
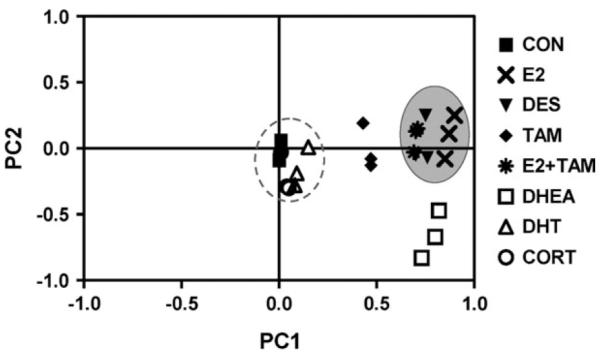
Principal components analysis was performed for all experimental treatments. PC1 and PC2 are shown and account for 84.2 and 3.2% of experiment variance, respectively. A group of symbols representing non-estrogen treatments is indicated by a hatched gray circle, and a group of estrogen treatments is indicated by a solid gray circle.
Validation of Microarray Data by qRT-PCR
Ten genes were selected for validation by qRT-PCR to represent several observed patterns of gene expression: highly induced by estrogens (VTG1, ESR2), moderately induced by estrogens (cstD and ESR1), repressed by estrogens (tcpbp and CYP2K5), repressed by TAM (PGDS), repressed by DHEA (C5), induced by CORT (hp1), and unchanged (CYP1A). In general, patterns of gene expression evaluated by qRT-PCR were highly similar to expression values obtained from the OSUrbt array (Fig. 5). For some genes, qRT-PCR detected a greater magnitude change in gene expression, most notably for VTG1. One notable discrepancy between array and qRT-PCR results was observed for ESR2. PCR analysis showed no significant treatment-induced changes in ESR2 expression, contrary to measurements with the array. Otherwise, no major discrepancies between the qPR-PCR and array data were noted for the remaining genes evaluated by PCR.
FIG. 5.

Validation of treatment-induced changes in hepatic gene expression determined by microarray analysis using qRT-PCR. Values from qRT-PCR (solid squares) are expressed as mean fold change (log2) normalized to ACT and GAPDH and values from the OSUrbt microarray (open squares) are expressed as mean fold change (log2) compared to the control reference pool ± SEM (n = 3) for select genes including (A) VTG1, (B) ctsD, (C) ESR1, (D) ESR2, (E) CYP2K5, (F) tcpbp, (G) C5, (H) hp1, (I) PGDS and (J) CYP1A. qRT-PCR and array expression levels of the normalization genes are also shown in (K) ACT and (L) GADPH. *indicates that the qRT-PCR expression value is significantly different ( p < 0.05) from control as determined by a one-way ANOVA with Dunnett’s test for multiple comparisons. Results of statistical analyses of microarray data are summarized in Tables 3–5, and p values are provided in Supplementary Tables 2 and 3.
Correlation of Hepatic Vtg mRNA Expression to Blood Plasma Vtg Protein
Levels of circulating Vtg protein detected in blood plasma were strongly correlated with hepatic Vtg mRNA expression detected by the microarray (Fig. 6). As was observed for Vtg transcript levels, TAM treatment significantly increased plasma Vtg protein, though not to the extent of the other estrogen treatments E2, DES, and DHEA. Moreover, TAM cotreatment did not significantly reduce E2-induced elevation of plasma Vtg protein, similar to results obtained for Vtg transcript levels with the microarray and qRT-PCR. DHT and CORT treatment did not significantly alter blood plasma Vtg protein levels.
FIG. 6.

Comparison of hepatic Vtg mRNA expression to blood plasma Vtg protein levels. (A) Hepatic Vtg gene expression was measured using the OSUrbt microarray. Values are mean fold change (log2) compared to the reference pool + SEM (n = 3). (B) Blood plasma Vtg protein levels are shown as mean fold change (log2) compared to control + SEM (n = 3); equal volumes of blood plasma from four males from each of three tanks were pooled, as was done for the liver samples in the microarray experiment. Actual Vtg plasma levels ranged from 2.16 × 10² to 1.03 × 10⁷ ng/ml (for CON and DHEA treatments, respectively). Different letters indicate that treatments are significantly different from each other ( p < 0.05) as determined by one-way ANOVA with Tukey’s test for multiple comparisons.
DISCUSSION
In the present study, we identified a transcriptional profile representing in vivo exposure to estrogen in the liver of male juvenile rainbow trout. Distinct patterns of gene expression were evident for estrogen and non-estrogen treatment groups as well as for each specific chemical treatment. Eighteen genes were identified as robust and specific indicators of estrogen exposure. This gene set included known targets for xenoestrogens involved in oocyte development and reproduction (VTG1, ZRP, VEP) and transcription (ESR1, ESR2) as well as some lesser known or novel estrogen-regulated transcripts including genes involved in stress response (VHSV4, VHSV6), signal transduction (ikk1), protein transport (Sec61αB), cell growth and proliferation (cd82, BMP7, BRMS1L, and Cdc2l1), nucleoside metabolism (UrdPase 1), nitrogen metabolism (BTD), and two genes with unknown function (RTN9-A1, RTN9-A2). Given the rigorous criteria used to select genes as differentially regulated by experimental treatment, it is likely that this biomarker set is quite conservative. Though of potential biological interest, moderately responsive genes that did not meet the 2-fold arbitrary limit established for this study would likely not be robust indicators of xenoestrogen exposure.
A number of other studies have employed macro- or microarray platforms to investigate the hepatic transcriptional response to estrogen exposure in several animal models including various fish species such as rainbow trout (Hook et al., 2006; Tilton et al., 2006), European flounder (Williams et al., 2007), common carp (Moens et al., 2006), largemouth bass (Larkin et al., 2002) and sheepshead minnow (Larkin et al., 2003), and rodents (Boverhof et al., 2004; Kato et al., 2004). For studies employing fish animal models, VTG is invariably the most responsive gene to estrogen exposure, confirming the suitability of this gene as a sensitive biomarker of estrogen exposure (Sumpter and Jobling, 1995). Other transcripts common to most estrogen-regulated gene lists include mRNAs encoding other proteins involved in oocyte development, collectively referred to as the zona radiata proteins (also termed choriogenin and vitelline envelope proteins) (Arukwe and Goksøyr, 2003). However, upon careful inspection of these published gene lists, it is clear that a majority of the estrogen-regulated genes are different among these various studies. These differences may be related to the specific chemicals, species, exposure routes, or time points studied. Moreover, the state of genome annotation for each species studied as well as the diversity of array platforms and sample analysis techniques used could be contributing factors to discrepancies observed among the studies. Nonetheless, many of the biological processes involved in the transcriptional response to estrogen are very similar among these experiments. As one example, several studies report estrogen-induced changes in genes involved in lipid metabolism and/or transport including fatty acid–binding protein (this study; Hook et al., 2006; Tilton et al., 2006; Williams et al., 2007) and apolipoprotein B (Boverhof et al., 2004; Hook et al., 2006; Larkin et al., 2002; Moens et al.,2006; Tilton et al., 2006). Although the liver is not considered a classical estrogen-responsive tissue in rodents, exposure of ovariectomized mice to the pharmaceutical xenoestrogen ethynylestradiol elicited changes in transcript levels of numerous genes belonging to functional groups similar to those identified in fish studies, notably cell growth and proliferation, cytoskeleton and extracellular matrix, oxidative metabolism, and lipid metabolism and transport (Boverhof et al., 2004). Although there appears to be some conservation of the biological response to estrogen among these diverse organisms, the applicability of a specific estrogen transcriptional fingerprint across species is uncertain.
This study is the first to utilize a toxicogenomics approach to examine the hepatic transcriptional response to a combined exposure of E2 and TAM. The first clinically relevant SERM, TAM is a multifunctional drug with different actions at various target tissues including agonist action in bone and liver, antagonist action in the breast and brain, and pleiotropic activity in other tissues such as the endometrium (reviewed in Diel, 2002). The selectivity of SERMs may occur via multiple mechanisms, including differential binding of ER subtypes, recruitment of different coactivators or corepressors, and regulation of upstream promoter regions of target genes (Diel, 2002; Dutertre and Smith, 2000; Shang and Brown, 2002). This diversity of molecular mechanism of action can lead to a broad range of transcriptional responses. In the present study, E2-induced changes in expression of the 18 identified estrogen-responsive genes were decreased in animals co-treated with TAM, indicating that the observed transcriptional changes likely involved interaction with the hepatic ER. It is important to note that, in this study with a test concentration of TAM 10-fold greater than that of E2, only a partial antagonism of the E2-induced transcriptional profile was observed. A complete block of the E2-induced response may have been observed if a higher concentration had been used or if TAM had been administered prior to the E2 treatment. Indeed, Marlatt et al. (2006) observed that a 250-fold excess concentration of TAM was required to block completely the Vtg response to E2 in juvenile male trout. In the present study, we also observed that in vivo exposure to TAM alone markedly increased expression of several known estrogen target genes, including VTG1, VEP, and VHSV4. This observation of dual, contrasting transcriptional activities is consistent with results of a previous study in trout in which TAM elevated hepatic expression of VTG and ERα, yet antagonized E2-induced expression of these genes (Vetillard and Bailhache, 2006). However, plasma Vtg was not altered in juvenile trout that were exposed for 20 days to 500 ppm waterborne TAM (Marlatt et al., 2006); this difference could be related to the length or route of exposure. One potential mechanism for dual transcriptional activities of TAM in trout may be via interaction with different ER subtypes, of which there are two highly expressed in trout liver (ERα1 and ERβ2) (Nagler et al., 2007).
Although DHEA has been reported to have weak affinity for the trout ER (Matthews et al., 2000), the estrogenic response to DHEA was most likely due to its metabolism to estradiol, rather than direct interaction of DHEA with the trout hepatic ER. Average blood plasma E2 concentration in trout fed DHEA was more than 200-fold higher than in control animals and was nearly equivalent to plasma E2 levels in trout administered E2 directly. However, the gene expression profile of DHEA exposure was quite distinct from that of E2, indicating that DHEA may have effects on hepatic transcription independent of its E2 metabolite. Eighteen transcripts were identified as uniquely regulated by this compound, including genes involved in protein modification (sae2), cell growth (ccnd1), metabolism (dlat), platelet aggregation (cd9), ion binding and transport (icta and fth2), and others. In particular, DHEA treatment markedly repressed expression of several genes belonging to the complement pathway including C3–3, C3–4, C5, and to a lesser extent c1r/c1s. The complement system plays a critical role in innate immunity, particularly in pathogen defense (Sunyer et al., 2005). Perturbations of the complement system could lead to increased risk of infection and has been associated with some diseases involving the immune system, such as asthma (Wills-Karp and Koehl, 2005), lupus (Bao and Quigg, 2007), and HIV (Datta and Rappaport, 2006).
Although the concentration of DES was selected based upon its reported higher affinity for the trout ER compared to E2 (Matthews et al., 2000), results of this study suggest that the hepatic transcriptional response to DES was generally lower in comparison to E2. Tissue levels of the test chemicals were not measured; thus, it is possible that the reduced response to DES could be related to the internal dose received. Another notable observation of the present study was the general lack of a hepatic transcriptional response to DHT. Blum et al. (2004) observed changes in expression of 11 hepatic genes in largemouth bass exposed to a 10-fold higher concentration of DHT than was administered in the present study. Although the DHT dose chosen for this trout study was selected to match that of E2, this concentration may have been insufficient to induce a robust transcriptional response in our animal model.
In the present study, qRT-PCR was used to quantify mRNA expression of genes selected to represent patterns of estrogen induction, estrogen repression, and lack of response to estrogen. In general, qRT-PCR results matched well with the microarray data. However, for some genes such as VTG1, ctsD, and hp1, the extent of induction or repression was under-estimated as measured by the OSUrbt array. This phenomenon has been observed in a number of microarray studies (Boverhof et al., 2004; Hook et al., 2006) and is likely a consequence of background and saturation signal intensity limitations. Thus, microarray experiments are most useful for semiquantitative assessment of gene expression.
One noticeable inconsistency in the validation of our microarray results by PCR was for the ESR2 gene. The 70-mer oligonucleotide sequence for this array feature aligned very near the 3′ end of the sequence for ESR2 (accession AJ289883). Because a useful primer pair surrounding this aligned sequence could not be designed, a previously published primer pair targeting a different region of this gene was used for validation. Thus, the qRT-PCR assay utilized in this study did not truly mimic the OSUrbt array measurement of ESR2 gene expression. Moreover, it is possible that DNA for similar genes, such as one of the other ER isoforms (Nagler et al., 2007) or a splice variant of the rtERα (Pakdel et al., 2000), significantly cross-hybridized to this array feature. Hook et al. (2006) also had difficulty reproducing microarray expression data for rainbow trout ER by qRT-PCR, which they attributed to high affinity of the array sequence to a different ER isoform. The lack of perfect correlation between microarray and qRT-PCR methodologies could present a problem for experiments designed to identify novel genes in biological processes or for hypothesis generation. However, when employed in risk assessment or environmental monitoring studies, the overall pattern of gene expression corresponding to a particular chemical class is of greater importance than the specific identity of each differentially regulated feature.
The transcriptional profile identified for estrogen exposure in the present study can serve as a biomarker of environmental exposure to xenoestrogens. The identification of 18 genes commonly regulated by estrogens that represent a number of biological functions demonstrates that a toxicogenomics approach to chemical evaluation can provide more information about the potential mechanism of action of an unknown chemical exposure compared to traditional single endpoint biomarkers. While a complete genome array may be preferred in experiments designed for hypothesis generation, this economical, targeted microarray allows for large-scale studies utilizing tens to hundreds of arrays and increases the practical sample size of treatment groups allowing for more statistically robust experiments. In future research, this targeted array and the transcription profile of estrogen exposure obtained in this study will be used to categorize chemicals with unknown mode of action and to address the issue of predictive utility of transcriptional fingerprints in animals with unknown exposures.
Supplementary Material
ACKNOWLEDGMENTS
The authors wish to acknowledge the assistance of Eric Johnson, Greg Gonnerman, and Cari Buchner at the Sinnhuber Aquatic Research Laboratory for care of the animals used in this study. We also thank Caprice Rosato and the Center for Genome Research and Biocomputing for assistance in the manufacture of the OSUrbt custom microarray. Technical assistance provided by Dr. Susan Tilton, Marilyn Henderson, and other members of the Williams laboratory is also gratefully acknowledged.
FUNDING National Institute of Environmental Health and Safety (ES03850, ES07060, ES00210, and ES013534).
Footnotes
SUPPLEMENTARY DATA Supplementary data are available online at www.toxsci.oupjournals.org and at GEO Expression Omnibus at www.ncbi.nlm.nih.gov/geo/.
Parts of this manuscript were presented at 14th North America International Society for the Study of Xenobiotics Meeting, Rio Grande, Puerto Rico, 22–26 October 2006.
REFERENCES
- Arukwe A, Goksøyr A. Eggshell and egg yolk proteins in fish: Hepatic proteins for the next generation: Oogenetic, population, and evolutionary implications of endocrine disruption. Comp. Hepatol. 2003;2:4. doi: 10.1186/1476-5926-2-4. [DOI] [PMC free article] [PubMed] [Google Scholar]
- Bao L, Quigg RJ. Complement in lupus nephritis: The good, the bad, and the unknown. Semin. Nephrol. 2007;27:69–80. doi: 10.1016/j.semnephrol.2006.09.009. [DOI] [PubMed] [Google Scholar]
- Bartosiewicz MJ, Jenkins D, Penn S, Emery J, Buckpitt A. Unique gene expression patterns in liver and kidney associated with exposure to chemical toxicants. J. Pharmacol. Exp. Ther. 2001;297:895–905. [PubMed] [Google Scholar]
- Benninghoff AD. Toxicoproteomics–the next step in the evolution of environmental biomarkers. Toxicol. Sci. 2007;95:1–4. doi: 10.1093/toxsci/kfl157. [DOI] [PubMed] [Google Scholar]
- Blum JL, Knoebl I, Larkin P, Kroll KJ, Denslow ND. Use of suppressive subtractive hybridization and cDNA arrays to discover patterns of altered gene expression in the liver of dihydrotestosterone and 11-ketotestosterone exposed adult male largemouth bass (Micropterus salmoides) Mar. Environ. Res. 2004;58:565–569. doi: 10.1016/j.marenvres.2004.03.046. [DOI] [PubMed] [Google Scholar]
- Boverhof DR, Fertuck KC, Burgoon LD, Eckel JE, Gennings C, Zacharewski TR. Temporal- and dose-dependent hepatic gene expression changes in immature ovariectomized mice following exposure to ethynyl estradiol. Carcinogenesis. 2004;25:1277–1291. doi: 10.1093/carcin/bgh114. [DOI] [PubMed] [Google Scholar]
- Damstra T, Barlow S, Bergman A, Kavlock R, Kraak GVD. Global Assessment of the State-of-the-Science of Endocrine Disruptors. International Programme on Chemical Safety. World Health Organization; Geneva, Switzerland: 2002. [Google Scholar]
- Datta PK, Rappaport J. HIV and complement: Hijacking an immune defense. Biomed. Pharmacother. 2006;60:561–568. doi: 10.1016/j.biopha.2006.07.087. [DOI] [PubMed] [Google Scholar]
- Denslow ND, Colbourne JK, Dix D, Freedman JH, Helbing CC, Kennedy S, Williams PL. Selection of surrogate animal species for comparative toxicogenomics. In: Benson WH, Giulio RTD, editors. Genomic Approaches for Cross-Species Extrapolation in Toxicology. CRC Press; New York: 2007. pp. 33–75. [Google Scholar]
- Diel P. Tissue-specific estrogenic response and molecular mechanisms. Toxicol. Lett. 2002;127:217–224. doi: 10.1016/s0378-4274(01)00503-3. [DOI] [PubMed] [Google Scholar]
- Donohoe RM, Curtis LR. Estrogenic activity of chlordecone, o,p’-DDT and o,p’-DDE in juvenile rainbow trout: Induction of vitellogenesis and interaction with hepatic estrogen binding sites. Aquat. Toxicol. 1996;36:31–52. [Google Scholar]
- Dutertre M, Smith CL. Molecular mechanisms of selective estrogen receptor modulator (SERM) action. J. Pharmacol. Exp. Ther. 2000;295:431–437. [PubMed] [Google Scholar]
- Flötotto T, Djahansouzi S, Gläser M, Hanstein B, Niederacher D, Brumm C, Beckmann MW. Hormones and hormone antagonists: Mechanisms of action in carcinogenesis of endometrial and breast cancer. Horm. Metab. Res. 2001;33:451–457. doi: 10.1055/s-2001-16936. [DOI] [PubMed] [Google Scholar]
- Hamadeh HK, Bushel PR, Jayadev S, Martin K, DiSorbo O, Sieber S, Bennett L, Tennant R, Stoll R, Barrett JC, et al. Gene expression analysis reveals chemical-specific profiles. Toxicol. Sci. 2002;67:219–231. doi: 10.1093/toxsci/67.2.219. [DOI] [PubMed] [Google Scholar]
- Harris CA, Henttu P, Parker MG, Sumpter JP. The estrogenic activity of phthalate esters in vitro. Environ. Health Perspect. 1997;105:802–811. doi: 10.1289/ehp.97105802. [DOI] [PMC free article] [PubMed] [Google Scholar]
- Hook SE, Skillman AD, Small JA, Schultz IR. Gene expression patterns in rainbow trout, Oncorhynchus mykiss, exposed to a suite of model toxicants. Aquat. Toxicol. 2006;77:372–385. doi: 10.1016/j.aquatox.2006.01.007. [DOI] [PMC free article] [PubMed] [Google Scholar]
- Kato N, Shibutani M, Takagi H, Uneyama C, Lee KY, Takigami S, Mashima K, Hirose M. Gene expression profile in the livers of rats orally administered ethinylestradiol for 28 days using a microarray technique. Toxicology. 2004;200:179–192. doi: 10.1016/j.tox.2004.03.008. [DOI] [PubMed] [Google Scholar]
- Koskinen H, Pehkonen P, Vehniainen E, Krasnov A, Rexroad C, Afanasyev S, Molsa H, Oikari A. Response of rainbow trout transcriptome to model chemical contaminants. Biochem. Biophys. Res. Commun. 2004;320:745–753. doi: 10.1016/j.bbrc.2004.06.024. [DOI] [PubMed] [Google Scholar]
- Larkin P, Folmar LC, Hemmer MJ, Poston AJ, Denslow ND. Expression profiling of estrogenic compounds using a sheepshead minnow cDNA macroarray. EHP Toxicogenomics. 2003;111:29–36. [PubMed] [Google Scholar]
- Larkin P, Sabo-Attwood T, Kelso J, Denslow ND. Gene expression analysis of largemouth bass exposed to estradiol, nonylphenol, and p,p’-DDE. Comp. Biochem. Physiol. B Biochem. Mol. Biol. 2002;133:543–557. doi: 10.1016/s1096-4959(02)00155-0. [DOI] [PubMed] [Google Scholar]
- Lee BC, Hendricks JD, Bailey GS. Toxicity of mycotoxins in the feed of fish. In: Smith JE, editor. Mycotoxins and Animal Feedstuff: Natural Occurrence, Toxicity and Control. CRC Press; Boca Raton, FL: 1991. pp. 607–626. [Google Scholar]
- Marlatt VL, Hewitt LM, Van der Kraak G. Utility of in vitro test methods to assess the activity of xenoestrogens in fish. Environ. Toxicol. Chem. 2006;25:3204–3212. doi: 10.1897/05-686r.1. [DOI] [PubMed] [Google Scholar]
- Martin OV, Lester JN, Voulvoulis N, Boobis AR. Human health and endocrine disruption: A simple multi-criteria framework for the qualitative assessment of endpoint-specific risks in a context of scientific uncertainty. Toxicol. Sci. 2007;98(2):332–47. doi: 10.1093/toxsci/kfm008. [DOI] [PubMed] [Google Scholar]
- Matthews J, Celius T, Halgren R, Zacharewski T. Differential estrogen receptor binding of estrogenic substances: A species comparison. J. Steroid Biochem. Mol. Biol. 2000;74:223–234. doi: 10.1016/s0960-0760(00)00126-6. [DOI] [PubMed] [Google Scholar]
- Moens LN, van der Ven K, Van Remortel P, Del-Favero J, De Coen WM. Expression profiling of endocrine-disrupting compounds using a customized Cyprinus carpio cDNA microarray. Toxicol. Sci. 2006;93:298–310. doi: 10.1093/toxsci/kfl057. [DOI] [PubMed] [Google Scholar]
- Mortensen AS, Tolfsen CC, Arukwe A. Gene expression patterns in estrogen (nonylphenol) and aryl hydrocarbon receptor agonists (PCB-77) interaction using rainbow trout (Oncorhynchus mykiss) primary hepatocyte culture. J. Toxicol. Environ. Health A. 2006;69:1–19. doi: 10.1080/15287390500257792. [DOI] [PubMed] [Google Scholar]
- Nagler JJ, Cavileer T, Sullivan J, Cyr DG, Rexroad C., III The complete nuclear estrogen receptor family in the rainbow trout: Discovery of the novel ERalpha2 and both ERbeta isoforms. Gene. 2007;392:164–173. doi: 10.1016/j.gene.2006.12.030. [DOI] [PMC free article] [PubMed] [Google Scholar]
- Pakdel F, Metivier R, Flouriot G, Valotaire Y. Two estrogen receptor (ER) isoforms with different estrogen dependencies are generated from the trout ER gene. Endocrinology. 2000;141:571–580. doi: 10.1210/endo.141.2.7296. [DOI] [PubMed] [Google Scholar]
- Rees CB, Li W. Development and application of a real-time quantitative PCR assay for determining CYP1A transcripts in three genera of salmonids. Aquat. Toxicol. 2004;66:357–368. doi: 10.1016/j.aquatox.2003.10.004. [DOI] [PubMed] [Google Scholar]
- Saal LH, Troein C, Vallon-Christersson J, Gruvberger S, Borg A, Peterson C. BioArray Software Environment (BASE): A platform for comprehensive management and analysis of microarray data. Genome Biol. 2002;3 doi: 10.1186/gb-2002-3-8-software0003. software0003.1–0003. [DOI] [PMC free article] [PubMed] [Google Scholar]
- Saeed AI, Sharov V, White J, Li J, Liang W, Bhagabati N, Braisted J, Klapa M, Currier T, Thiagarajan M, et al. TM4: A free, open-source system for microarray data management and analysis. Biotechniques. 2003;34:374–378. doi: 10.2144/03342mt01. [DOI] [PubMed] [Google Scholar]
- Sanseverino J, Gupta RK, Layton AC, Patterson SS, Ripp SA, Saidak L, Simpson ML, Schultz TW, Sayler GS. Use of Saccharomyces cerevisiae BLYES expressing bacterial bioluminescence for rapid, sensitive detection of estrogenic compounds. Appl. Environ. Microbiol. 2005;71:4455–4460. doi: 10.1128/AEM.71.8.4455-4460.2005. [DOI] [PMC free article] [PubMed] [Google Scholar]
- Shang Y, Brown M. Molecular determinants for the tissue specificity of SERMs. Science. 2002;295:2465–2468. doi: 10.1126/science.1068537. [DOI] [PubMed] [Google Scholar]
- Shilling AD, Carlson DB, Katchamart S, Williams DE. 3,3′-Diindolylmethane, a major condensation product of indole-3-carbinol, is a potent estrogen in rainbow trout. Toxicol. Appl. Pharmacol. 2001;170:191–200. doi: 10.1006/taap.2000.9100. [DOI] [PubMed] [Google Scholar]
- Shirai T, Asamoto M. Application of toxicogenomics to the endocrine disruption issue. Pure Appl. Chem. 2003;75:2419–2422. [Google Scholar]
- Sumpter JP, Jobling S. Vitellogenesis as a biomarker for estrogenic contamination of the aquatic environment. Environ. Health Perspect. 1995;103(Suppl. 7):173–178. doi: 10.1289/ehp.95103s7173. [DOI] [PMC free article] [PubMed] [Google Scholar]
- Sunyer JO, Boshra H, Li J. Evolution of anaphylatoxins, their diversity and novel roles in innate immunity: Insights from the study of fish complement. Vet. Immunol. Immunopathol. 2005;108:77–89. doi: 10.1016/j.vetimm.2005.07.009. [DOI] [PubMed] [Google Scholar]
- Terasaka S, Aita Y, Inoue A, Hayashi S, Nishigaki M, Aoyagi K, Sasaki H, Wada-Kiyama Y, Sakuma Y, Akaba S, et al. Using a customized DNA microarray for expression profiling of the estrogen-responsive genes to evaluate estrogen activity among natural estrogens and industrial chemicals. Environ. Health Perspect. 2004;112:773–781. doi: 10.1289/ehp.6753. [DOI] [PMC free article] [PubMed] [Google Scholar]
- Tilton SC, Gerwick LG, Hendricks JD, Rosato CS, Corley-Smith G, Givan SA, Bailey GS, Bayne CJ, Williams DE. Use of a rainbow trout oligonucleotide microarray to determine transcriptional patterns in aflatoxin B1-induced hepatocellular carcinoma compared to adjacent liver. Toxicol. Sci. 2005;88:319–330. doi: 10.1093/toxsci/kfi309. [DOI] [PubMed] [Google Scholar]
- Tilton SC, Givan SA, Pereira CB, Bailey GS, Williams DE. Toxicogenomic profiling of the hepatic tumor promoters indole-3-carbinol, 17β-estradiol and β-naphthoflavone in rainbow trout. Toxicol. Sci. 2006;90:61–72. doi: 10.1093/toxsci/kfi341. [DOI] [PubMed] [Google Scholar]
- Vetillard A, Bailhache T. Effects of 4-n-nonylphenol and tamoxifen on salmon gonadotropin-releasing hormone, estrogen receptor, and vitellogenin gene expression in juvenile rainbow trout. Toxicol. Sci. 2006;92:537–544. doi: 10.1093/toxsci/kfl015. [DOI] [PubMed] [Google Scholar]
- Vezina CM, Walker NJ, Olson JR. Subchronic exposure to TCDD, PeCDF, PCB126, and PCB153: Effect on hepatic gene expression. Environ. Health Perspect. 2004;112:1636–1644. doi: 10.1289/txg.7253. [DOI] [PMC free article] [PubMed] [Google Scholar]
- Wang DY, McKague B, Liss SN, Edwards EA. Gene expression profiles for detecting and distinguishing potential endocrine-disrupting compounds in environmental samples. Environ. Sci. Technol. 2004;38:6396–6406. doi: 10.1021/es049235r. [DOI] [PubMed] [Google Scholar]
- Williams TD, Diab AM, George SG, Sabine V, Chipman JK. Gene expression responses of European flounder (Platichthys flesus) to 17-beta estradiol. Toxicol. Lett. 2007;168:236–248. doi: 10.1016/j.toxlet.2006.10.020. [DOI] [PubMed] [Google Scholar]
- Wills-Karp M, Koehl J. New insights into the role of the complement pathway in allergy and asthma. Curr. Allergy Asthma Rep. 2005;5:362–369. doi: 10.1007/s11882-005-0007-y. [DOI] [PubMed] [Google Scholar]
Associated Data
This section collects any data citations, data availability statements, or supplementary materials included in this article.