Abstract
Template free controlled aggregation and spectral properties in fluorescent organic nanoparticles (FONs) is highly desirable for various applications. Herein, we report a non-templated method for controlling the aggregation in NIR cyanine-based nanoparticles derived from a Group of Uniform Materials Based on Organic salts (GUMBOS). The cationic heptamethine cyanine dye, 1,1′,3,3,3′,3′-hexamethylindotricarbocyanine (HMT), was coupled with five different anions viz. [NTf2−], [BETI−], [TFPB], [AOT−] and [TFP4B] by ion exchange method to obtain the respective GUMBOS. The nanoGUMBOS obtained via a reprecipitation method were primarily amorphous and spherical (30-100 nm) as suggested by selected area electron diffraction (SAED) and transmission electron micrographs (TEM). The formation of tunable self-assemblies within the nanoGUMBOS was characterized using absorption and fluorescence spectroscopy, in conjunction with molecular dynamic simulations. Counterion controlled spectral properties observed in the nanoGUMBOS were attributed to variations in J/H ratios with different anions. Association with the anion [AOT−] afforded predominant J-aggregation enabling highest fluorescence intensity, while [TFP4B−] disabled the fluorescence due to predominant H-aggregation in the nanoparticles. Analyses of the stacking angle of the cations based on molecular dynamic simulation results in [HMT][NTf2], [HMT][BETI] and [HMT][AOT] dispersed in water and visual analysis of representative simulation snapshots also imply that the type of aggregation was controlled through the counterion associated with the dye cation.
Keywords: Fluorescent organic nanoparticles, Tunable, ionic liquids, GUMBOS, NIR cyanine, Aggregation
1. INTRODUCTION
Fluorescent organic nanoparticles (FONs) and controlled molecular self assemblies have been receiving increasing attention over the last decade, especially in the fields of material science, analytical chemistry and biomedical applications.1 Design and synthesis of novel molecular building blocks that self-assemble in a well defined manner has been a major challenge in supramolecular chemistry. Supramolecular assemblies that are usually based on various non-covalent interactions, such as electrostatic, hydrogen bonding, solvophobic, and π-π stacking, are found to exhibit unique properties due to strong electronic coupling among the molecules. Consequently, controlling the orientation of the individual chromophores and thereby tuning the spectral properties of a dye within a nanoparticle would enable the exploitation of the unique optical and spectral properties of a dye nanoparticle for various applications, such as organic light emitting diodes (OLED)2 and photovoltaics.3
Several studies have been reported on controlling supramolecular dye assemblies in solutions using various templates such as proteins, polymers, inorganic nanoparticles, as well as solid films.4-9 Dye aggregation is often characterized through broadening of the absorption spectra4 or appearance of a new bands or shoulders either hypsochromically shifted (H-aggregate) or bathocromically shifted (J-aggregate)10 as compared to the monomer absorption band. This effect is attributed to the excitonic splitting due to Coulomb coupling of the transition dipoles of the individual molecules forming such aggregates.11 Excited state lifetimes and fluorescence yields are generally altered due to the formation of such aggregates. For example, J-aggregates (brickwork or head-to tail assemblies) are usually characterized by a yield of intense resonance fluorescence.10-12 In contrast, formation of H-aggregates (card-pack assemblies) leads to diminished fluorescence, usually with a large Stokes shift.10-12 Both aggregate types possess some unique properties. For example, J-aggregates can be used as spectral sensitizers in photographic films,13 in non-linear optics,14 and photodynamic therapy in cancer,15 while H-aggregates can be considered potential candidates for light harvesting systems6 and optical recording systems with high resolution.16
In recent years, the preparation and spectral properties of FONs composed solely of dye molecules have been reported.17-20 Research on FONs has attracted considerable interest after Nakanishi et al. reported the preparation of perylene, phthalocyanine, and polydiacetylene nanoparticles using a reprecipitation method and subsequently characterized their size-dependent spectral properties.21,22 Organic molecular crystals are primarily formed as a result of weak van der Waals interactions or hydrogen bonding.23 Significant quenching of fluorescence in the solid state as a result of increased intermolecular interactions is a major shortcoming of organic nanoparticles in contrast to highly fluorescent dilute solutions.24 However, the fluorescence of organic nanomaterials may often be enhanced due to specific intermolecular aggregation or intramolecular planarization18 and their enhanced fluorescence is attributed to the presence of J-aggregation18 or the absence of aggregation25 within the particle. Liquid crystal directed controlled aggregation in dye based organic nanoparticles has also been recently reported by Spillmann et al.26 Yao et al. and Ou et al. have demonstrated the ion-association approach for synthesis of ion-based organic nanoparticles in which varying molar ratios of a cyanine dye cation and hydrophobic anion were used to control the size of the nanoparticles. The presence of the excess anions adsorbed onto the surface of the nanoparticles determined their sizes. However, these studies27,28 suggest the absence of any type of aggregation(J- or H-) within the nanoparticles. In contrast, the research reported in this manuscript focuses on a template free (without additives) approach employing reprecipitation to produce nanoparticles with controlled aggregation and tunable spectral properties.
Although a template free approach to controlling aggregation is highly desirable, to the best of our knowledge, such controlled aggregation in FONs has not yet been reported. In the present study, we demonstrate a novel additive free method for controlling aggregation in cyanine based nanomaterials. In this study, the cationic heptamethine cyanine dye 1,1′,3,3,3′,3′-hexamethylindotricarbocyanine Iodide ([HMT][I]) was exchanged with five different anions, selected on the basis of their varied hydrophobicities and geometries to yield water-insoluble organic salts. These salts with melting points below 100 °C fit the traditional definition of Ionic liquids (ILs). However, not all of our materials fit this definition, and we have therefore adapted the more general name Group of Uniform Materials Based on Organic Salts and therefore the acronym GUMBOS. Nanoparticles were prepared from these GUMBOS employing a reprecipitation method. Interestingly, we observed that the spectral properties of the nanoGUMBOS differ significantly from each other with variations in the associated anion. In other words, the counterion can drive the molecular assemblies within the nanoparticle to two different extremes leading to either predominant H- aggregation or to predominant J-aggregation in the aqueous dispersion. However, this is not the observation when these same GUMBOS are dissolved in ethanol.
Several studies have revealed that the polymethine chain length of the cyanines is a factor that determines the type of aggregation in a particular cyanine dye.29-31 Cyanine based self assemblies are known to possess a wide variety of applications such as spectral sensitizers for silver halide photography,32 large band gap semiconductor materials,32 as laser materials in light harvesting systems for photosynthesis,32 and for in vivo cell imaging.33 Monomethine cyanines are more prone to J-aggregation. In contrast, with increasing methine groups, they show a tendency towards increased H-aggregation.30 Heptamethine cyanines are usually near infrared (NIR) absorbing and hence are extremely important for in vivo cell imaging34 and harvesting NIR radiations for other applications. However, the affinity of these dyes for H-aggregation sometimes appears to be a restricting factor.29-31 In this study, we have demonstrated a novel and simple approach for controlling the aggregation within heptamethine cyanine based nanoGUMBOS, by a simple variation of the associated anions. We note that the possibility of achieving such unprecedented controlled aggregation by use of the same chromophore with a non-templated method overcomes the restrictions and enhances the potential of a dye for a variety of applications. We have also performed molecular dynamic simulation studies on our system which are in good agreement with the experimental data.
2. EXPERIMENTAL METHODS
Materials
1,1′,3,3,3′,3′-hexamethylindotricarbocyanine (HMT) iodide (97%), bis (2-ethylhexyl) sulfosuccinate (AOT) sodium salt (≥99%), lithium bis(trifluoromethane) sulfonimide, potassium 3,5 bis (trifluoromethyl) phenyltrifluoroborate, Sodium tetrakis[3,5-bis(1,1,1,3,3,3-hexafluoro-2-methoxy-2-propyl)phenyl]borate, and ethanol (spectroscopic grade) were purchased from Sigma Aldrich and used as received. Lithium bis(pentafluoroethane sulfonyl) imide (LiBETI) was donated by Gary Baker (Oakridge, TN). Triply deionized water (18.2 MΩ cm) from an Elga model PURELAB ultra™ water filtration system was used for preparation of all IL NIR dye nanoparticles. Carbon coated copper grids (CF400-Cu, Electron Microscopy Sciences, Hatfield, PA) were used for TEM imaging.
Synthesis and characterization of NIR GUMBOS
The NIR GUMBOS (mostly ILs) were prepared using anion exchange procedures similar to those reported in the literature.35 Equimolar amounts, e.g. 30.0 mg (56.0 μmol) of 1,1′,3,3,3′,3′-hexamethylindotricarbocyanine (HMT) iodide and 24.9 mg (56.0 μmol) of sodium bis (2-ethylhexyl) sulfosuccinate (AOT) salt, were dissolved in a mixture of methylene chloride and water (2:1 v/v) and allowed to stir for 12 hrs at room temperature. The methylene chloride bottom layer was washed several times with water to get rid of the byproduct (NaI) and the product ([HMT][AOT]) was obtained from the organic lower layer and dried by removal of solvent in vacuo. Similar procedure was followed for the preparation of all the GUMBOS. The GUMBOS obtained were characterized by use of 1H and 19F NMR (Bruker 250 MHz spectrometer) and elemental microanalysis (Atlantic Microlab, Norcross, GA, USA). Melting points of the GUMBOS were determined by use of a MELTEMP® capillary melting point apparatus. Synthesis and characterization of one of these GUMBOS has been reported in detail elsewhere with limited data on the others.36 We have included synthesis and characterization data on all GUMBOS discussed in this manuscript in the supporting information section of this manuscript (Figure S5).
Synthesis of NIR nanoGUMBOS
The nanoGUMBOS were prepared from GUMBOS using a modified simple, additive-free reprecipitation method similar to that used for organic nanoparticles.21 In a typical preparation, 100 μL of a 1 mM solution of GUMBOS precursor dissolved in ethanol was rapidly injected into 5 mL of triply-deionized water in an ultrasonic bath, followed by additional sonication for 2 min. All solvents used in this study were filtered prior to nanoparticle preparation using 0.2 μm nylon membrane filters. The particles were allowed 15 min of equilibriation time after preparation and then characterized using different techniques. A 1:1 ratio of the dye cation to anion was maintained in the nanoGUMBOS dispersion presented here. This is in direct contrast to studies previously reported, where the ratio was varied. 27,28
Characterization of size and morphology of NIR nanoGUMBOS
The average particle size and size distribution of the prepared nanoGUMBOS were obtained by use of transmission electron microscopy (TEM). TEM micrographs were obtained using an LVEM5 transmission electron microscope (Delong America, Montreal, Canada). The NIR nanoGUMBOS dispersion (1 μL) was drop casted onto a carbon coated copper grid and allowed to dry in air at room temperature before TEM imaging. Electron diffraction measurements of dried nanoGUMBOS were obtained on a Nonius Kappa CCD diffractometer by long exposures with Mo Kα radiation and rotation of samples about the vertical axis.
Absorption and fluorescence studies of NIR GUMBOS and nanoGUMBOS
Absorbance measurements were performed using a Shimadzu UV- 3101PC, an UV-Vis-near-IR scanning spectrometer (Shimadzu, Columbia, MD). Fluorescence studies were performed using a Spex Fluorolog-3 spectrofluorimeter (model FL3-22TAU3); Jobin Yvon, Edison, NJ). A 0.4 cm path length quartz cuvette (Starna Cells) was used to collect the fluorescence and absorbance against an identical cell filled with water as the blank. Fluorescence studies were all performed adopting a synchronous scan protocol with right angle geometry. Fluorescence spectra were corrected for inner filter effects using a standard formula.37 The emission quantum yields (Q.Y.) of the HMT nanoGUMBOS and [HMT][I] were obtained using Indocyanine green (ICG) as a standard. Q.Y. =0.12 in DMSO) with excitation at 737 nm using standard protocol.38 In the measurements, we set the absorbance of 737 nm at around 0.1 and calculated the Q.Y. values with corrections for the absorbances of all dispersions and solutions.
In order to deconvolute the absorption spectra, a software based on principal component analysis (Specwin32) was used and fits with chi square values as low as the order of 10−5 were accepted. The absorption spectra were deconvoluted using a Gaussian fit. Both normalized and non-normalized spectra were deconvoluted using this software and it was observed that the ratio of all three components in each spectrum remained the same in both cases. The contribution from each component was calculated by considering it to be proportional to the area under the corresponding component of the deconvoluted spectra.
Molecular Modeling studies
Force Fields
Classical molecular dynamics simulations were performed using the multi-processor software Gromacs 4.0339 in an NVT ensemble at 300K using the Berendsen thermostat. A time step of 0.5 fs was used and the long-range interactions were evaluated using the Ewald summation technique. Periodic boundary conditions were applied in all directions. For all simulations, H-bond lengths were constrained with the LINCS algorithm.
The system was comprised of two ionic pairs dispersed in water, which was modeled using the Simple Point Charge (SPC216) model. All parameters used to model our cations and anions, were selected from force-field available in the literature40 as follows. Intramolecular parameters (bond lengths, valence angles, torsional profiles) were taken from the OPLS-AA40 or AMBER41 force fields. However, as the intramolecular parameters for the indole ring structures in the HMT cation were not available in the OPLS-AA or AMBER force fields, We approximated those using the parameters for the indole ring in the standard amino acid Tryptophan (TRP), given by Cornell et al.42 The intermolecular parameters (Lennard-Jones terms, electrostatic charges) were chosen from the OPLS-AA force field. Coulomb interactions were represented by partial charges placed on the atomic sites as defined by Lopes and Pádua.43 Aggregation and micelle formation of several ionic liquids in aqueous solutions has been studied very recently using MD simulations by Bhargava and Klein.44
Simulation details
For our simulations considering only two ion pairs (HMT with either AOT, BETI or NTf2), we initially placed the two cations parallel to each other in the z-axis while stacked in an H-aggregate arrangement. The two ion pairs are solvated by ~9500 water molecules in an 8 nm × 6 nm × 6 nm simulation box (~0.01 M). In this study, we generated six initial configurations of the parallel cations by varying the distance between the cations from 0.5 nm to 2.0 nm in the z-direction, ΔZ (Figure S4). One of the HMT cations was defined as the reference cation, HMT1, and it was restrained to move only within its initial X-Y plane throughout the simulation. The movement of the second cation HMT2 was partially restrained using the pull command from Gromacs, such that the distance of its two nitrogen atoms from the center of mass of the reference cation HMT1, gave a fixed z-distance ΔZ between the two cations throughout the simulation. The anions are initially separated from the cations by 1.2 nm in the y-direction; the anions and the water molecules had no movement restrictions, and as a result, could ultimately influence the stacking arrangement of the cations. The dynamical evolution of the cations was followed for at least 3 ns in our MD simulations at 300 K. For our simulations with 90 ion pairs, the cations and the anions were placed at random positions in a 10 nm × 10 nm × 10 nm simulation box with 30,000 molecules of water, corresponding to a concentration of ~0.15 M for the three different ion pairs of HMT with either AOT, BETI, or NTf2. We performed classical molecular dynamics simulations in the NVT ensemble, and no restraints were placed on any molecule in the system.
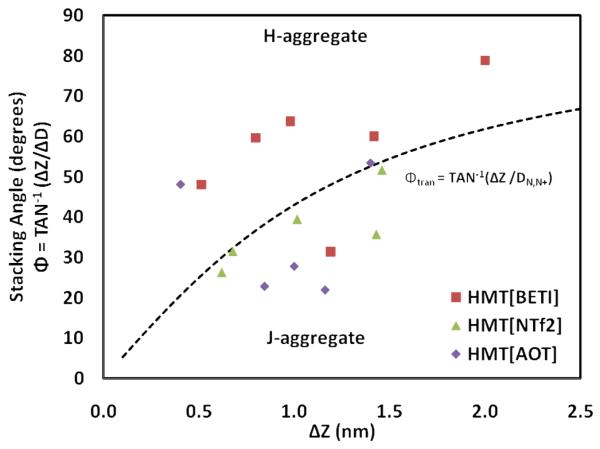
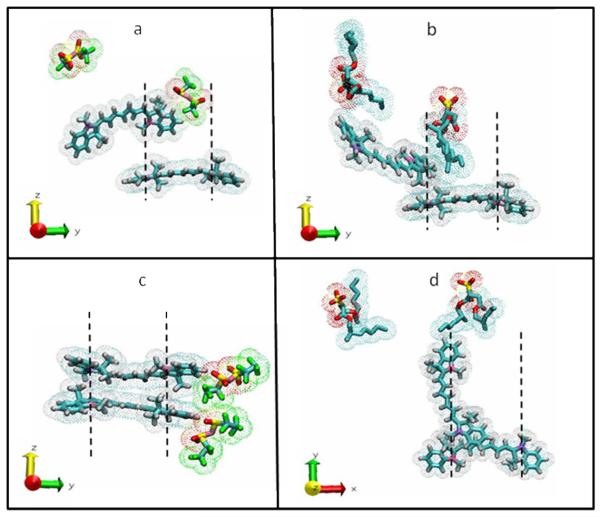
The following analyses were used to determine the aggregation types for our systems. For pairs of cations identified as nearest neighbors (based on the distances between the cations), we defined four vectors: the N-N+ vectors within the first cation HMT1 (A) and the second cation HMT2 (B), the vector between the centers of mass (COMs) of the HMT cations (C), and finally the vector that is normal to the imidazolium rings of the first cation HMT1 (D). We then calculated the distance between the cations as ΔZ = (C · d), and the distance along the length of HMT1 as ΔD = (A · c), where lower case identifies unit vectors (i.e., c = C/|C|; d = D/|D|). The cation arrangements are defined as random when A and B are close to perpendicular [i.e., (A · B) < 0.5]. We can then distinguish between J- and H-aggregation by determining ΔZ and ΔD, which we use to calculate the stacking angle Φ (eqn. 2). Afterwards, we compare this angle Φ with a transition angle Φtran to distinguish between J- and H-aggregation. The value of Φtran is calculated as follows. Since the measured distance between the two nitrogens in a relaxed HMT cation is DN,N+ = 1.07 nm, we postulate that the change from an H-aggregate arrangement to a J-aggregate occurs as ΔD approaches DN,N+. The special condition at which ΔD = DN,N+, defines the stacking as an ‘ideal’ J-aggregate as shown in Figure S4(B). Placing ΔD = DN,N+ into Equation 2 provides the approximate transition angle, Φtran, which is shown as the dashed line in Figure 7 and depends on the value of ΔZ (see Figures 7 and S4). The arrangements can be confirmed visually by analyzing representative simulation snapshots, as shown in Figure 8(a-d). These snapshots were taken from the two-pair simulations for clarity; we observe similar arrangements between pairs of nearest-neighboring cations within the large cluster formed in the 90-ion pair simulations.
Figure 7.
The stacking angle is plotted with respect to different HMT nanoGUMBOS, [HMT][BETI], [HMT][NTf2], and [HMT][AOT]. Φtran is represented by the dashed line and the points below this line have more J-aggregate characteristics.
Figure 8.
Stacking arrangement of equilibrated nanoGUMBOS. The dashed lines represent the distance DN,N+ which is the estimated transition line between H- and J-aggregation. a) [HMT][NTf2] ( ΔZ = 0.75 nm) is a J-aggregate. b) [HMT][AOT] ( ΔZ = 0.75 nm) is a J-aggregate. c) [HMT][BETI] ( ΔZ = 0.75 nm) is an H-aggregate. d) [HMT][AOT] ( ΔZ = 1.5 nm) has Random stacking when cations are perpendicular in XY plane. Water molecules were removed for clarity.
3. RESULTS AND DISCUSSIONS
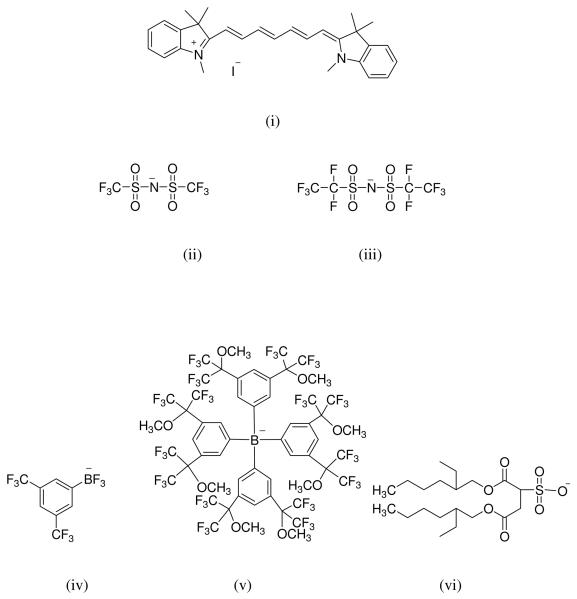
A water soluble cyanine dye, [HMT][I], was subjected to anion exchange with five different anions, namely bis(trifluoromethanesulfonimide) [NTf2−], bis(pentafluoroethanesulfonimide) [BETI−], 3,5-bis (trifluoromethyl) phenyltrifluoroborate [TFPB], bis(2-ethyl-1-hexyl) sulfosuccinate [AOT−] and tetrakis[3,5-bis-(1,1,1,3,3,3-hexafluoro-2-methoxy-2-propyl)phenyl] borate [TFP4B] (Figure 1). The GUMBOS produced were all water insoluble, but soluble in ethanol. This class of materials is found to possess extreme tunability. We note that our group has recently reported the preparation and applications of similar magnetic and non-magnetic nanoGUMBOS.36,45
Figure 1.
Chemical structures of the parent dye (i) HMTI and the anions (ii) NTf2−, (iii) BETI−,(iv) TFPB−, (v) TFP4B−, (vi) AOT −
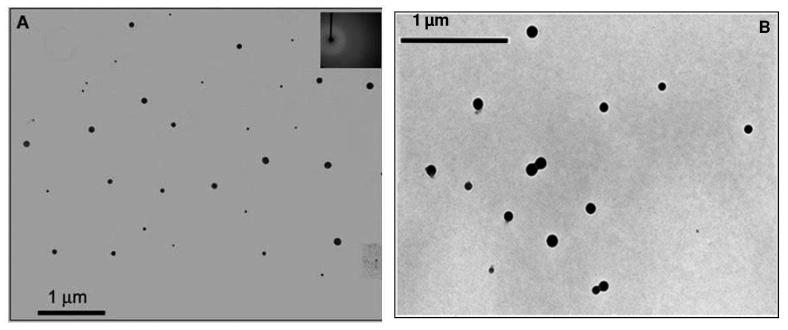
The present work explores the tunable spectral properties of the nanoGUMBOS, prepared following a simple reprecipitation method as reported in the literature.21 These nanoGUMBOS were characterized using transmission electron microscopy (TEM) (Figure 2). The TEM images reveal that, the HMT nanoGUMBOS were mainly spherical and in some cases quasi-spherical with average diameters ranging from 30-100 nm, depending on the anion. The electron diffraction patterns (Figure 2 inset) of these nanoGUMBOS suggest that they are primarily amorphous. The amorphous properties of these nanomaterials reduced the likelihood of quenching as a result of internal conversion processes, which is quite common for crystalline systems.46
Figure 2.
TEM images of (A) [HMT][NTf2] nanoGUMBOS with average diameter of 65 ± 22 nm and (B) [HMT][AOT] nanoGUMBOS with average diameter of 92 ± 20 nm. The inset in (A) is the selected area electron diffraction (SAED) pattern suggesting amorphous particles. No staining was used during the TEM samples preparation.
3a. Absorption studies of HMTGUMBOS and nanoGUMBOS
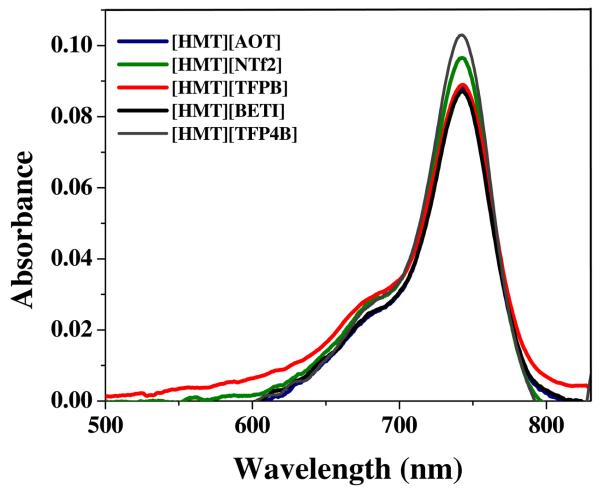
The absorption spectra of dilute ethanolic solutions of all HMT GUMBOS were almost identical (Figure 3a) and displayed a maxima at 742 nm, which is identical with the parent [HMT][I] (not shown). In contrast, the nanoGUMBOS dispersed in water displayed intriguingly broad absorption spectra with unique spectral shapes for different HMT anion pairs (Figure S1(i)and Figure 4). Broadening of absorption spectra was observed in both longer and shorter wavelength regions, as compared to dilute monomeric solution. In the case of [HMT][AOT], [HMT][NTf2] and [HMT][TFPB] nanoGUMBOS, the spectra seem to exhibit absorption shoulders in both the red and blue regions relative to the monomer. The broadness of the absorption band is likely a result of superimposition of the absorption bands of preoriented molecules around 735 nm as a result of aggregates formed. Such broadness can also be contributed to oscillation or rotational motion of the aggregates beyond the resolution of the spectrometer.4 The change in shape of the absorption band due to molecular aggregation in the nanoGUMBOS can be best understood by the use of molecular exciton theory.11
Figure 3.
Absorption spectra of HMT GUMBOS in dilute ethanolic solutions.
Figure 4.
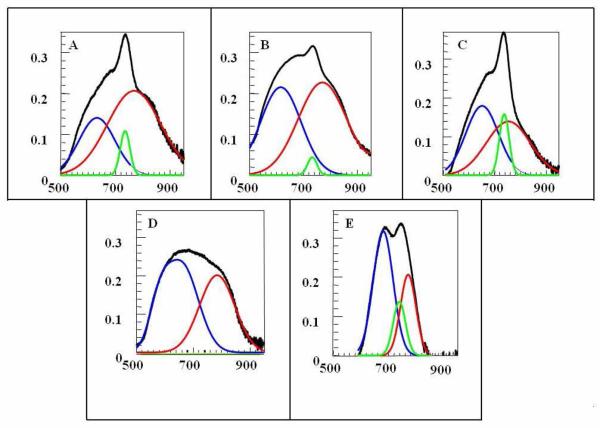
Resolved absorption spectra of the HMT Nanoparticles (A) [HMT][AOT], (B)[HMT][NTf2], (C) [HMT][TFPB], (D) [HMT][BETI] (E) [HMT][TFP4B]
To gain better insight, absorption spectra of all HMT nanoGUMBOS were deconvoluted by use of Specwin 32 software, employing principal component analysis. From the resolved absorption spectra [Figure 4], it is observed that each absorption spectrum is composed of three major bands, which may be attributed to three different types of absorbing species in the nanoGUMBOS. We have assigned the component absorbing ~ 735 nm to those aggregates in the dye nanoGUMBOS whose transition dipoles are randomly oriented and are expected to absorb in the monomer region (e.g., the dilute aqueous solutions of [HMT][I] absorbs at this wavelength).25 The bathochromically shifted components absorbing ~ 753-783 nm are assigned to J-type of aggregates in which the transition dipoles are arranged in a staircase manner. Finally, the spectral components which are hypsochromically shifted absorbing ~ 580-672 nm are assigned to H-type aggregates in which the transition dipoles tend to align parallel to each other. Narrowing of the spectral line with J-aggregate formation is a usual observation for J-aggregation of a dye in solution.10,12 However, in the present study, the J-aggregate absorption is bathochromically shifted as expected but is relatively broader. The lesser possibility of perfect J-aggregation, lack of motional narrowing, or presence of lattice disorder within the nanoparticles have also been considered to be possible explanations for this broadening.18
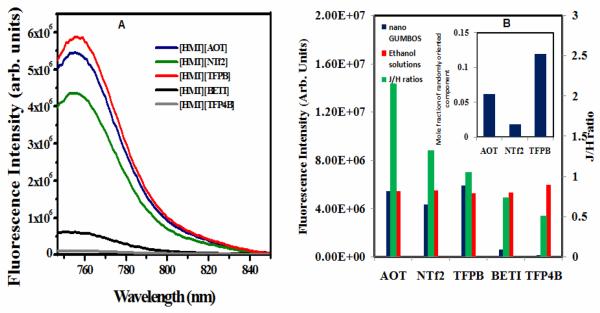
Thus, from the deconvoluted absorption spectra, it appears that in most cases, three different types of aggregates were formed within the dye nanoparticle, namely H-type corresponding to the blue shifted component, J-type corresponding to the red shifted component and randomly oriented aggregates corresponding to the component absorbing near the monomer. Using this categorization, it is assumed that all various H-type aggregates were encompassed under the blue shifted component. Similarly, all the various J-type aggregates were included in the red shifted component of the deconvoluted spectra. However, it is noteworthy that the relative amount of each component varied from one spectrum to the other. Overall, different shapes of the absorption bands may be ascribed to the presence of different proportions of these three species. It is observed that in [HMT][AOT], [HMT][NTf2] and [HMT][TFPB] nanoGUMBOS, the J-component predominates over H-components. In contrast, in the other two, namely [HMT][BETI] and [HMT][TFP4B], H-components were predominant. The ratio of J to H components (J/H) in all HMT nanoGUMBOS is given in Figure 5. It is also observed that among the three dyes with predominant J-aggregates, the contribution of the randomly oriented species is the highest for [HMT][TFPB], followed by [HMT][AOT] and [HMT][NTf2] [Figure 5 inset].
Figure 5.
(A) Fluorescence emission spectra of all the HMT nanoGUMBOS (Excitation Wavelength = 737 nm). (B) Fluorescence Intensity of (A)HMT nanoGUMBOS in water(blue), (B)HMTGUMBOS in dilute ethanolic solution (red) and (C) J/H ratio of all the HMT nanoGUMBOS(green). The inset in figure shows the molar fraction of randomly oriented component in the three highly fluorescent nanoGUMBOS calculated from absorption spectra.
3b.Size controlled study
As mentioned earlier, size dependent spectral properties of various dye nanoparticles have been investigated by several groups.17,22 According to these studies, the spectral properties varied with the size of the nanoparticles. In our case, since different sized particles were obtained with different anions, it was essential to understand whether the tunability of the spectral properties is an effect of varying size or varying anion. To investigate this phenomenon, same sized particles of different HMT-anion pairs were prepared by use of varying amounts of ethanolic stock solution inserted during reprecipitation and thus varying the final overall dye concentration. Spectral properties were subsequently examined and it was observed that discrepancies in the spectral properties were persistent even when the nanoGUMBOS of different HMT-anion pairs had the same size. This study confirms that the tunable spectral properties observed in our study were primarily due to variations in the counter-anion and is not a size dependent effect (Figure S1(ii)).
3c. Fluorescence of HMT GUMBOS and nanoGUMBOS
Steady state fluorescence studies were complementary to our absorption studies and the resolved absorption spectra. Dilute ethanolic solutions of all HMT GUMBOS show fluorescence emission maxima at 765 nm upon excitation at its absorption maxima (742 nm) with comparable fluorescence intensities for all the associated anions. In contrast, the nanoGUMBOS dispersed in water displayed widely different fluorescence properties (Figure 5a). Among the five HMT anion pairs, the [HMT][AOT] and [HMT][TFPB] nanoGUMBOS were found to exhibit the highest fluorescence emission intensity. This was followed by [HMT][NTf2] nanoGUMBOS, while the nanoGUMBOS of [HMT][BETI] were observed to be weakly fluorescent and those of [HMT][TFP4B] were practically non-fluorescent. Emission of all HMT nanoGUMBOS were centered around 756 nm, which is a 5 nm red shifted as compared to dilute aqueous [HMT][I] solution with emission maxima ~ 751 nm. A blue shift of approximately 10 nm in the emission maxima of the nanoGUMBOS in water as compared to their ethanolic solutions is attributed to negative solvatochromism.
With regard to the three species of the resolved absorption spectra, it is rationalized that the major contribution to fluorescence emission comes from the randomly oriented component25 and the J-component. Correlating the fluorescence results with the absorption studies, the naonoGUMBOs for which the J/H >1 are the most fluorescent. Thus [HMT][AOT] is the most fluorescent with the highest J/H (=2.152) ratio and a significant contribution of randomly oriented species in its emission ensemble. Although the nanoGUMBOS of [HMT][NTf2] had a greater J/H (=1.327) ratio as compared to [HMT][TFPB] (J/H=1.049), the latter has a greater fluorescence yield. This is ascribed to the higher contribution of randomnly oriented components in [HMT][TFPB] nanoparticles as compared to [HMT][NTf2]. [HMT][BETI] had a lower J/H ratio(<1) or higher contribution from H-type of aggregates as compared to the former three, which would explain its weakly fluorescent behavior. [HMT][TFP4B] was determined to be almost non-fluorescent, which is consistent with its lowest J/H(<1) ratio or highest contribution from the H-component(Figure 5).
It is interesting to note that the HMT nanoGUMBOS with higher J/H(>1) ratios exhibit comparable fluorescence as the dilute ethanolic solutions of HMT GUMBOS(Figure 5) and their quantum yields are also comparable to aqueous solutions of the parent [HMT][I] (Figure S2). In contrast, those having lower J/H (<1) ratios are significantly less fluorescent than their corresponding solutions and possess significantly lower quantum yield as compared to aqueous [HMT][I]. Thus, a simple variation of the anions in the GUMBOS enabled tuning the fluorescence yields of the nanoGUMBOS. This tunable fluorescence of the nanoGUMBOS is attributed to the alteration in the preferred relative orientation of the individual chromophores within the nanoGUMBOS of varying anions.11
Summarizing the observations obtained thus far, we note that for the nanoGUMBOS of [HMT][AOT], [HMT][NTf2] and [HMT][TFPB], head-to-tail stacking is thermodynamically more favored in contrast to the card-pack arrangement, resulting in highly fluorescent properties. In contrast, card-pack arrangement is more favored in [HMT][BETI] and [HMT][TFP4B], which makes them respectively weakly fluorescent and nearly non-fluorescent. As mentioned earlier, cyanines with longer polymethine chain favor formation of H-aggregates in solution.46 However, it is noteworthy that some selected counteranions resulted in predominant J-aggregation within these heptamethine cyanine based nanoGUMBOS, thereby enhancing the fluorescence.
It is well known that anions like [NTf−], [BETI−], long chain alkyl, or phenyl borates impart hydrophobic properties to their resultant ionic liquids (ILs).48 However, when relative hydrophobicities are considered, [BETI−] is more hydrophobic than [NTf2−] as it has a longer alkyl chain and trifluorophenyl borate containing ILs were more water soluble than their tetraphenyl borate counterparts.48 Comparing the structures of [TFPB−] and [TFP4B−], the latter is considered to be more hydrophobic than the former as it has four bulky phenyl groups as compared to only one in the former. Hence, apart from other structural factors which might dictate the type of aggregation within the nanoGUMBOS, the extent of hydrophobicities of the anions can be roughly correlated to the preferred orientation of the transition dipoles within the nanoparticles. From our experimental results, it can be inferred that greater hydrophobicity of an anion within a given family might induce preferred stacking of the individual chromophores in a card pack manner, forming predominantly H-type aggregates.33, 48
3d. Fluorescence anisotropy of HMT GUMBOS and nanoGUMBOS
Fluorescence anisotropy(r) is a measure of the average angular displacement of the fluorophore between the absorption and subsequent emission of the photon and is given by the formula
| (1) |
where G is the grating factor that has been included to correct for the wavelength response for polarization of the emission optics and the detector. The parameters, Ivv and Ivh, are the fluorescence emission intensity measured parallel and perpendicular to the vertically polarized excitation, respectively. The parameters, Ihh and Ihv, are the fluorescence emission intensity measured parallel and perpendicular to the horizontally polarized excitation. Examination of studies reported in the literature reveals that J-aggregates exhibit negative fluorescence anisotropy value upon non-resonant excitation i.e. exciting blue of the J-band which has been attributed to W-like structure of the aggregate.49 In a different study, it is mentioned that fluorescence anisotropy might either increase due to dye aggregation because of slower rotational diffusion in higher weight aggregates or decrease due to efficient energy migration within the aggregated dye.50 Thus, polarization may be used to examine the degree of J- and H-aggregation in our nanoGUMBOS.
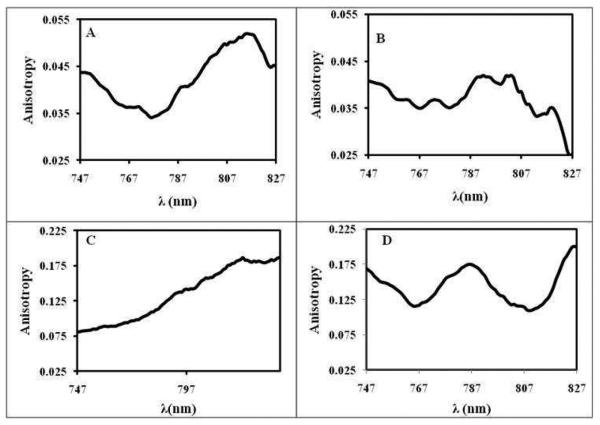
Fluorescence emission anisotropy studies were performed for both dilute ethanolic solutions of HMT GUMBOS, as well as the nanoGUMBOS exciting at 737 nm, a wavelength towards the blue of J-band. This study reveals that dilute ethanolic solutions of all HMT GUMBOS possess significantly low anisotropies lying between 0.01-0.02 (Figure S3) (Table1). We note that the anion has little or no effect on the anisotropy in dilute solutions. However, it is observed that all HMT nanoGUMBOS possess higher anisotropies than their corresponding dilute ethanolic solutions and exhibit fluorescence emission anisotropy spectra with different features for different counteranions (Figure 6) (Table 1). The [HMT][AOT] and [HMT][NTf2], which were predominantly J-aggregating, possess a comparatively low anisotropy value over the entire emission wavelength with a minimum at 775 nm, which almost coincides with the absorption wavelength of the J-aggregates for these nanoparticles as observed in the deconvoluted spectra. Thus, we can state that the primary emitting species in these two cases are the J-aggregates having resonance fluorescence properties.9 In contrast, the fluorescence anisotropy spectra for [HMT][TFPB] decreases as one approaching monomer emission region exhibiting a minimum anisotropy at ~ 750 nm, which indicates that in this case the main emitting species is the randomly oriented component which emits near the monomer region along with the corresponding J-aggregate which absorbs and emits near 754 nm as seen in the resolved spectra. It was stated earlier that J-aggregates are characterized by a fluorescence emission band in resonance with the absorption band. However, the value of the anisotropy of the particle is much greater than that of the corresponding monomer in dilute solution, suggesting that the emitting species is in the particle and not in solution. This observation also supports our deconvoluted absorption data which show a maximum randomly oriented component for this HMT anion pair. Moreover, since the absorption of the J-aggregates of [HMT][TFPB] is near 754 nm, this explains its emission anisotropy minima being centered around 750 nm. Fluorescence anisotropy values of the [HMT][BETI] nanoGUMBOS are much higher over the entire emission range with two minima, one near 770 nm and another near 810 nm, suggesting the presence of two significantly different types of J-aggregates.
Table 1.
Fluorescence anisotropy of HMT GUMBOS and nanoGUMBOS at three different emission wavelengths for λex = 737 nm.
| 750 nm | 770 nm | 780 nm | ||||
|---|---|---|---|---|---|---|
| Solution | nano | Solution | nano | Solution | nano | |
| [HMT][AOT] | 0.022 | 0.044 | 0.022 | 0.036 | 0.022 | 0.035 |
| [HMT][NTf2] | 0.019 | 0.040 | 0.018 | 0.036 | 0.017 | 0.035 |
| [HMT][TFPB] | 0.019 | 0.083 | 0.018 | 0.094 | 0.019 | 0.107 |
| [HMT][BETI] | 0.011 | 0.158 | 0.012 | 0.122 | 0.012 | 0.160 |
| [HMT][TFP4B] | 0.010 | — | 0.011 | — | 0.014 | — |
Figure 6.
Fluorescence emission anisotropy of HMT nanoGUMBOS (A)[HMT][AOT], (B)[HMT][NTf2], (C)[HMT][TFPB], (D) [HMT][BETI]
Fluorescence anisotropy of the dye self-assemblies in the nanoGUMBOS is higher than the corresponding dilute dye solutions, suggesting slower rotational diffusion of the dye within the nanoGUMBOS. This is attributed to its restricted motion in the solid phase. In addition, an insignificant amount of energy is lost through energy migration within the dye aggregates in the nanoGUMBOS.37 Another observation is that the dye with higher J/H ratio has lower values of emission anisotropy, suggesting that the rotational diffusion of the dye within the J-type of aggregates is faster as compared to that in randomly oriented or H-type of aggregates. This can be attributed to more efficient energy migration in the [HMT][AOT] and [HMT][NTf2] nanoGUMBOS relative to the others.50 The more rapid exciton relaxation and energy migration for J-aggregates in general has been well documented in literature.49 Fluorescence anisotropy depends on the direction of the transition moments.37 In the case of ordered dye assemblies, the transition dipoles are oriented in a definite manner and hence the response to parallel and perpendicular polarized light is quite distinct in the emission spectra, yielding significantly different features in the emission anisotropy spectra of the nanoGUMBOS.
3f. Molecular Dynamic Simulations
(a)Results and analysis: systems with two ion pairs
Our molecular dynamics (MD) simulations focus on the initial stages of the aggregation process in water (~30 ns). In our simulations, we first considered systems with only two ion pairs (i.e., two cations HMT1 and HMT2, and two anions, either AOT−, NTf2− or BETI−); afterwards, we increased our system sizes to 90 ion pairs (see Simulation details). In all cases, the ions are dispersed in water. We followed a simulation protocol in order to distinguish between different types of aggregation behavior (J, H, or random) between pairs of nearest-neighboring cations (see Simulation details). In particular, to distinguish between J- and H-aggregation between pairs of nearest-neighboring HMT cations, we defined a stacking angle calculated as:
| (2) |
where ΔZ is defined as the constrained distance between the center of mass (COM) of the first cation HMT1, and the COM of the second cation HMT2; and ΔD is the displacement of the COM of HMT2 along the length of HMT1. Using figure S4, we display the stacking arrangement of an ‘ideal’ H-aggregate (A) and an ‘ideal’ J-aggregate (B).
The measured distance between the two nitrogens in a relaxed HMT cation is DN,N+ = 1.07 nm. Therefore, the change from an H-aggregate arrangement to a J-aggregate occurs as ΔD approaches DN,N+. The special condition at which ΔD = DN,N+, defines the stacking as an ‘ideal’ J-aggregate as shown in Figure S4(B). Placing ΔD = DN,N+ into Equation 2 provides the approximate transition angle, Φtran, which is shown as the dashed line in Figure 7. In this figure, we show the stacking angle Φ between the two HMT cations, once the system is equilibrated at 300 K keeping different values for the constrained distance ΔZ between the cations. All simulations started with the two cations initially arranged in a perfect H-aggregate (Φ = 90°). The transition from H-aggregate to J-aggregate depends on the values of ΔZ and the displacement from the reference cation in the X-Y plane, ΔD (Equation 2 and Figure S4). We distinguish H- and J- aggregates from ‘random’ aggregates by measuring the angle formed by the vectors joining the N+ and the N atoms within each cation HMT1 and HMT2 (see Simulation details and Figure S4). If this angle is larger than 45°, we define the two cations as randomly oriented.
Visual observation of representative simulation snapshots confirm whether the equilibrated two cations stack into H-, J-, or random arrays. Figure 8(a-d) shows examples of the resulting HMT stacking when interacting with different anions. For clarity, the water molecules were removed from this figure. Data from Figures 7 and 8 suggest that in our simulations with two ion pairs, the cations of [HMT][BETI] prefer to stack into H-aggregates, whereas the cations in [HMT][NTf2] and [HMT][AOT] prefer to stack into J- aggregates. These results are in excellent agreement with the predominant type of aggregates found in our experimental studies when HMT is paired with different anions. It is important to note that, although the motion of the two HMT cations is partially constrained in our simulations (see Simulation details), these restrictions do not bias the cations to aggregate in any pattern. In fact, analyses of our simulation trajectories indicate that the two cations adopt different conformations before finally equilibrating into their preferred aggregation pattern.
(b) Results and analysis: systems with ninety ion pairs
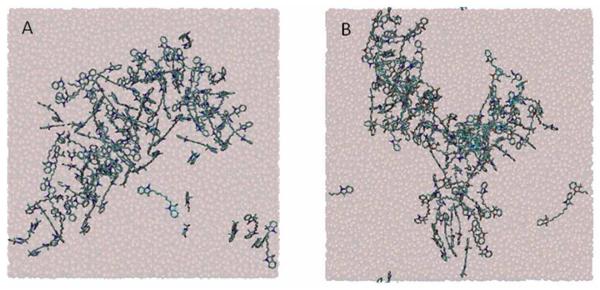
We have also performed MD simulations with 90 ion pairs of [HMT][NTf2−], [HMT][BETI−] or [HMT][AOT−] in water, equivalent to a concentration of ~0.15 M for the three systems. The purpose of these simulations was to study the early stages of the aggregation process, as well as to determine whether different types of aggregation (J, H, or random) coexist within a nanoGUMBO, or if a given nanoGUMBO only exhibits one class of molecular aggregation. The system was initially melted at 600 K for 2 ns and then its temperature was reduced to 300 K. For all three systems, it was observed that the ions initially form small clusters that then coalesced into one large cluster, after approximately 5 ns for [HMT][NTf2−] and [HMT][BETI−], and after 30 ns for [HMT][AOT−] (Figure 9). Once the system was equilibrated, for each cation within the large cluster, we identified the cations that are its nearest neighbors, and determined the aggregation arrangement (H, J, or random) between pairs of nearest-neighboring cations (see Simulation details). Our simulation results indicate that the single large cluster observed in each system was comprised of H-, J-, and randomly aggregated cations. This observation suggests that different types of aggregation coexist within individual nanoGUMBOS.
Figure 9.
A) [HMT][BETI] and B) [HMT][NTf2] are snapshots after the systems have reached equilibrium. Hydrogen atoms were removed for clarity.
CONCLUSIONS
We have successfully demonstrated template free controlled aggregation within nanoGUMBOS using the same cation dye skeleton, by simple variations in the associated counterions. Although the dye-anion pairs behave alike in the solution phase, they show significant variations of their properties when they aggregate to form nanoGUMBOS. The tunable spectral properties of the nanoGUMBOS primarily arise from differences in the arrangement of individual transition dipoles within the particles. Extrapolating from our data, it can be inferred that anions with higher degree of hydrophobicities may induce a preference for H-aggregation in these nanoGUMBOS. In contrast, preferred J-aggregation may be observed with anions of comparatively lower hydrophobicities. However, we believe that these observations may vary depending on the dye skeleton. Results from molecular dynamic simulations were consistent with our experimental results, suggesting predominant J-aggregation for the anions, [NTf2−] and [AOT−], and predominant H-aggregation for the anion [BETI−]. Different aggregation behavior was observed within individual nanoGUMBOS for both experiments and simulations. Thus, successful control of the type of preferred aggregation was achieved by use of our proposed approach. Our findings help to overcome the restrictions of using a particular dye for a definite purpose, thereby enhancing the potential of a single dye for multiple applications.
Supplementary Material
ACKNOWLEDGEMENTS
Isiah M. Warner acknowledges financial support from the National Science Foundation (NSF) (grant no. CHE-0616827) and National Institute of Health (NIH) (grant no. 1R01GM079670 ). Joshua D. Monk and Francisco R. Hung acknowledge the Donors of the American Chemical Society Petroleum Research Fund for partial support of this research. High performance computational resources for this research were provided by High Performance Computing at Louisiana State University (http://www.hpc.lsu.edu), and the Louisiana Optical Network Initiative (http://www.loni.org).
Footnotes
SUPPORTING INFORMATION AVAILABLE: NMR characterization and elemental analysis of the synthesized GUMBOS, fluorescence emission spectra showing relative fluorescence intensities of the nanoGUMBOS, relative fluorescence anisotropy of the GUMBOS and relative fluorescence quantum yield compared to the starting material, models representing perfect J- and H-aggregates showing the parameter ΔZ, ΔD and stacking angle Φ are also provided. This information is available free of charge via the Internet at http://pubs.acs.org/.
REFERENCES
- 1.Mukamel S, Chemla DS, editors. Chem. Phys. 1996;71:210. Special Issue on Confined Excitation in Molecular and Semiconductor Nanostructures. [Google Scholar]
- 2.Hagfeldt A, Gratzel M. Chem. Rev. 1995;95:49–68. [Google Scholar]
- 3.Schlamp MC, Peng X, Alivisatos AP. J. Appl. Phys. 1997;82:5837. [Google Scholar]
- 4.Dahne L. J. Am. Chem. Soc. 1995;117:12855. [Google Scholar]
- 5.Lu L, Jones RM, McBranch D, Whitten D. Langmuir. 2002;18:7706. [Google Scholar]
- 6.Kamat PV, Fox MA. J. Phys. Chem. 1984;88:2297. [Google Scholar]
- 7.Renikuntla BR, Armitage BA. Langmuir. 2005;21:5362. doi: 10.1021/la050065l. [DOI] [PubMed] [Google Scholar]
- 8.Sorokin AV. Journal of Applied Spectroscopy. 2009;76:234. [Google Scholar]
- 9.Yoshida A, Uchida N, Kometani N. Langmuir. 2009;25:11802. doi: 10.1021/la901431r. [DOI] [PubMed] [Google Scholar]
- 10.Jelly EE. Nature(London) 1936;138:1009. [Google Scholar]
- 11.Kasha M, Rawis HR, El-Bayoumi MA. Pure Appl. Chem. 1965;11:371. [Google Scholar]
- 12.Scheibe G. Angew Chem. 1936;49:536. [Google Scholar]
- 13.Sturmer DM, Heseltine DW. In: Theory of Photographic Process. 4th ed. James TH, editor. Macmillan; London: 1977. [Google Scholar]
- 14.Knoester J. Phys. Rev. A. 1993;47:2083. doi: 10.1103/physreva.47.2083. [DOI] [PubMed] [Google Scholar]
- 15.Dougherty TJ, Kaufman JE, Goldfarb A, Weishaupt KR, Boyle DG, Mittelman M. Cancer Res. 1978;38:2628. [PubMed] [Google Scholar]
- 16.Kodaira T, Amano A. U.S. Patent 2008/0008850 A1
- 17.Fu H-B, Yao J-N. J. Am. Chem. Soc. 2001;123:1434–1439. [Google Scholar]
- 18.An B-K, Kwon S-K, Jung S-D, Park S-U. J. Am. Chem. Soc. 2002;124:14410. doi: 10.1021/ja0269082. [DOI] [PubMed] [Google Scholar]
- 19.Xiao D, Xi Lu., Yang W, Fu H, S Zhigang., Fang Y, Yao J. J. Am. Chem. Soc. 2003;125:6740. doi: 10.1021/ja028674s. [DOI] [PubMed] [Google Scholar]
- 20.Gesquiere AJ, Uwada T, Asahi T, Masuhara H, Barbara PF. Nano Lett. 2005;5(7):1321. doi: 10.1021/nl050567j. [DOI] [PubMed] [Google Scholar]
- 21.Kasai H, Kamatani H, Okada S, Oikawa H, Mastuda H, Nakanishi H. Jpn. J. Appl. Phys. 1996;35:L221–223. [Google Scholar]
- 22.Kasai H, Kamatani H, Yoshikawa Y, Okada S, Oikawa H, Watanabe A, Ito O, Nakanishi H. Chem. Lett. 1997:1181–1182. [Google Scholar]
- 23.Silinsh EA. Organic Molecular Crystals: Their Electronic States. Springer – Verlag; Berlin: 1980. [Google Scholar]
- 24.Friend RH, Gymer RW, Holms AB, Burroughes JH, Marks RN, Taliani C, Bradley DDC, Dos santos DS, Bredas JL, Loglund M, Salaneck WR. Nature. 1999;397:121. [Google Scholar]
- 25.Yao H, Yamashita M, Keisaku K. Langmuir. 2009;25:1137. doi: 10.1021/la802879e. [DOI] [PubMed] [Google Scholar]
- 26.Spillmann CM, Naciri J, Anderson GP, Chen M-S, Ratna BR. ACS Nano. 2009;3(10):3214. doi: 10.1021/nn9007498. [DOI] [PubMed] [Google Scholar]
- 27.Yao H, Ou Z, Kimura K. Chemistry Letters. 2005;34(8):1108. [Google Scholar]
- 28.Ou Z, Yao H, Kimura K. Bull. Chem. Soc. Jpn. 2007;80(2):296. [Google Scholar]
- 29.Kim SK, Kodagahally R, Strekowski L, Patonay G. Talanta. 2005;67:947. doi: 10.1016/j.talanta.2005.04.025. [DOI] [PubMed] [Google Scholar]
- 30.Khairutdinov RF, Serpone N. J. Phys. Chem. B. 1997;101:2602–2610. [Google Scholar]
- 31.Otsuka A, Funabiki K, Sugiyama N, Mase H, Yoshida T, Minoura H, Matsui M. Chemistry Letters. 2008;37(2):176. [Google Scholar]
- 32.Mishra A, Behera RK, Behera PK, Mishra BK, Behera GB. Chem. Rev. 2000;100:1973. doi: 10.1021/cr990402t. [DOI] [PubMed] [Google Scholar]
- 33.Zhang Z, Fan J, Cheney PP, Berezin MY, Edwards WB, Akers WJ, Shen D, Liang K, Culver JP, Achilefu S. Molecular Pharmaceutics. 2009;6(2):416. doi: 10.1021/mp800264k. [DOI] [PMC free article] [PubMed] [Google Scholar]
- 34.Lim C-K, Kim S, Kwon IC, Ahn C-H, Park SY. Chem. Mat. 2009;21:5819. [Google Scholar]
- 35.Del Sesto RE, McCleskey TM, Burrell AK, Baker GA, Thompson JD, Scott BL, Wilkes JS, Williams P. Chem. Commun. 2008:447–449. doi: 10.1039/b711189d. [DOI] [PubMed] [Google Scholar]
- 36.Bwambok DK, El-Zahab B, Challa SK, Li M, Chandler L, Baker GA, Warner IM. ACS Nano. 2009;3(12):3854–3860. doi: 10.1021/nn9010126. [DOI] [PMC free article] [PubMed] [Google Scholar]
- 37.Lackowicz JR. Principles of Fluorescence Spectroscopy. Plenum; New York: 1983. [Google Scholar]
- 38. http://www.horiba.com/fileadmin/uploads/Scientific/Documents/Fluorescence/quantumyieldstrad.pdf.
- 39.Hess B, Kutzner C, van der Spoel D, Lindahl E. J. Chem. Theory Comput. 2008;4:435–447. doi: 10.1021/ct700301q. [DOI] [PubMed] [Google Scholar]
- 40.Jorgensen WL, Maxwell DS, Tirado-Rives J. J. Am. Chem. Soc. 1996;118:11225. [Google Scholar]
- 41.Sorin EJ, Pande VS. Biophys. J. 2005;88:2472. doi: 10.1529/biophysj.104.051938. [DOI] [PMC free article] [PubMed] [Google Scholar]
- 42.Cornell WD, Cieplak P, Bayly CI, Gould IR, Merz KM, Fergusin DM, Spellmeyer DC, Fox T, Caldwell JW, Kollman PA. J. Am. Chem. Soc. 1995;117:5179. [Google Scholar]
- 43.Lopes JNC, Pádua AAH. J. Phys. Chem. B. 2004;108:16893–16898. [Google Scholar]
- 44.Bhargava BL, Klein ML. J. Phys. Chem. B. 2009;113:9499–9505. doi: 10.1021/jp903560y. [DOI] [PubMed] [Google Scholar]
- 45.Tesfai A, El-Zahab B, Kelley AT, Li M, Garno JC, Baker GA, Warner IM. ACS Nano. 2009;3(10):3244. doi: 10.1021/nn900781g. [DOI] [PMC free article] [PubMed] [Google Scholar]
- 46.Forest S. MRS Bull. 2001;26(2):108–112. [Google Scholar]
- 47.Raghavachary R. Near Infrared applications in biotechnology. 25:2000. [Google Scholar]
- 48.Papaiconomou N, Salminen J, Lee J-M, Prausnitz JM. J. Chem. Eng. Data. 2007;52:833–840. [Google Scholar]
- 49.Scheblykin IG, Drobizhev MA, Varanavsky OP, Auweraer MV-D, Vitukhnovsky AG. Chem. Phys. Lett. 1996;261:181–190. [Google Scholar]
- 50.Haas U, Thalacker C, Adams J, Fuhrmann J, Riethmüller S, Beginn U, Ziener U, Möller M, Dobrawaa R, Würthner F. J. Mater. Chem. 2003;13:767–772. [Google Scholar]
Associated Data
This section collects any data citations, data availability statements, or supplementary materials included in this article.


