

Abstract
Spontaneous spreading depolarizations (SDs) occur in the penumbra surrounding ischemic core. These SDs, often referred to as peri-infarct depolarizations, cause vasoconstriction and recruitment of the penumbra into the ischemic core in the critical first hours after focal ischemic stroke; however, the real-time spatiotemporal dynamics of SD-induced injury to synaptic circuitry in the penumbra remain unknown. A modified cortical photothrombosis model was used to produce a square-shaped lesion surrounding a penumbra-like “area at risk” in middle cerebral artery territory of mouse somatosensory cortex. Lesioning resulted in recurrent spontaneous SDs. In vivo two-photon microscopy of green fluorescent protein-expressing neurons in this penumbra-like area at risk revealed that SDs were temporally correlated with rapid (<6 s) dendritic beading. Dendrites quickly (<3 min) recovered between SDs to near-control morphology until the occurrence of SD-induced terminal dendritic injury, signifying acute synaptic damage. SDs are characterized by a breakdown of ion homeostasis that can be recovered by ion pumps if the energy supply is adequate. Indeed, the likelihood of rapid dendritic recovery between SDs was correlated with the presence of nearby flowing blood vessels, but the presence of such vessels was not always sufficient for rapid dendritic recovery, suggesting that energy needs for recovery exceeded energy supply of compromised blood flow. We propose that metabolic stress resulting from recurring SDs facilitates acute injury at the level of dendrites and dendritic spines in metabolically compromised tissue, expediting penumbral recruitment into the ischemic core.
Introduction
In focal stroke, failure of the Na+-K+ pump caused by depletion of ATP results in a wave of a cortical spreading depolarization (SD) of neurons and glia referred to as anoxic depolarization (AD) (Dirnagl et al., 1999). AD propagates through the stroke focus leading to dramatic neuronal and glial swelling, dendritic beading, and spine loss (Obeidat et al., 2000; Andrew et al., 2007; Murphy et al., 2008). Without immediate reperfusion, AD spread defines the primary region of acute neuronal death, the ischemic core (Kaminogo et al., 1998). As AD spreads throughout metabolically compromised penumbra surrounding the ischemic core, it becomes transient depolarization, often termed peri-infarct depolarization (PID) (Hossmann, 1994; Obrenovitch, 1995; Back et al., 1996). PIDs occur spontaneously over several days postinjury both clinically and experimentally (Hartings et al., 2003; Dreier et al., 2006; Fabricius et al., 2006; Dohmen et al., 2008). It is proposed that each PID is initiated at the edge of ischemic core by elevated [K+]o and glutamate, a product of maintained depolarization and necrosis within the core (Nedergaard, 1996; Strong and Dardis, 2005). PIDs propagate away from the ischemic core along a decreasing gradient of metabolic stress and into healthy tissue, where repolarization occurs relatively quickly (Nedergaard, 1996) because energy resources are not compromised. At this point, it is classic spreading depression (Leão, 1944). Hence, AD, PIDs, and spreading depression are thought to represent variations of a common depolarizing and propagating process (i.e., SD) that depends upon the degree of local metabolic compromise. Collapse of ion homeostasis is the hallmark of SD. Although short-lasting SDs are withstood in healthy tissue, longer lasting SDs are harmful in metabolically challenged tissue (Oliveira-Ferreira et al., 2010). In moderately ischemic penumbra, recurring SDs further elevate metabolic stress due to the mismatch between energy supply and increased energy needs for recovery of ion gradients by ion pumps. Accompanying arteriole/capillary activity also contributes to the metabolic stress. Perfusion may decrease transiently during an SD in the penumbra, resulting in abrupt reduction of cerebral blood flow (CBF) (Dreier et al., 2000; Shin et al., 2006; Strong et al., 2007) leading to stepwise expansion of severely hypoperfused cortex (Shin et al., 2006). Hence, the depolarizing and hemodynamic activity of recurring SD contributes to infarct growth into the penumbra (Mies et al., 1993; Hartings et al., 2003; Dreier et al., 2006; Shin et al., 2006), worsening the neurological deficits after stroke (Dirnagl et al., 1999). However, the direct evidence for SD-induced acute damage to fine synaptic circuitry within penumbra is lacking, and the real-time spatiotemporal dynamics of such injury and recovery remain unknown.
Photochemical thrombosis allows consistent, reproducible creation of a cerebral infarction (Watson et al., 1985). The modified “ring” model of this method enables precise placement of the lesion perimeter and establishment of an ischemic penumbra-like “area at risk” (Wester et al., 1995; Jiang et al., 2006). Here, we have adapted this highly reproducible model of penumbra in conjunction with in vivo two-photon laser scanning microscopy (2PLSM) to reveal dramatic spatiotemporal changes in dendritic integrity with the passage of each SD in the metabolically challenged penumbra-like area at risk.
Materials and Methods
Transgenic mice.
All procedures follow National Institutes of Health guidelines for the humane care and use of laboratory animals and underwent yearly review by the Animal Care and Use Committee at the Medical College of Georgia. All efforts were made to minimize animal discomfort and reduce the number of animals used. Founders of the B6.Cg-Tg(Thy1-EGFP)MJrs/J colony [GFP-M] were kindly provided by Dr. J. Sanes (Harvard University, Cambridge, MA). Mice of the GFP-M strain display bright fluorescence in a small fraction of pyramidal neurons of the neocortex providing high contrast, thus facilitating imaging. A total of 64 GFP-M and wild-type male and female mice at an average age of 4 months were used in this study.
Preparation of mice for in vivo imaging.
Craniotomy for the optical window followed a protocol adapted from Holtmaat et al. (2005) that was implemented as described recently (Risher et al., 2009). Mice were anesthetized with an intraperitoneal injection of urethane (1.5 mg/g body weight). Body temperature was maintained at 37°C with a heating pad (Sunbeam). Tracheotomy was performed on all animals to minimize potential breathing problems that may result from prolonged anesthesia. A short ∼1 cm L-shaped glass capillary (1.2 mm diameter) was inserted into the trachea and secured with two sutures. Skin covering the cranium above the somatosensory cortex was removed. A custom-made 1.3 cm diameter plastic ring was glued with dental acrylic cement (Co-Oral-Ite Dental) to stabilize the head with a mouse headholder during craniotomy and imaging. A dental drill (Midwest Stylus Mini 540S, Dentsply International) with 0.25 inch bit was used to thin the circumference of a 2- to 4-mm-diameter circular region of the skull centered at stereotaxic coordinates −1.8 mm from bregma and 2.8 mm lateral. Forceps were used to lift up the thinned portion of the skull. An optical chamber was constructed by covering the intact dura with a thin layer of 1.5% agarose prepared in a cortex buffer containing (in mm) 135 NaCl, 5.4 KCl, 1 MgCl2, 1.8 CaCl2, and 5 HEPES, pH 7.3. The optical chamber was left open in most experiments to facilitate access with a glass microelectrode. After installation of the Ag/AgCl pellet ground electrode (A-M Systems) under the skin above the nasal bone, the stage containing headholder, mouse, and heating pad was mounted on the Luigs & Neumann microscope stage for imaging. Mice were maintained under urethane anesthesia for the entire imaging session. Rectal temperature was monitored continuously with IT-18 thermocouple (ADInstruments) and Fluke 51 thermometer, and maintained at 37°C. Heart rate was monitored using a DAM-60 amplifier (WPI) throughout the entire study. Depth of anesthesia was assessed by toe pinch and heart rate (450–650 beats/min) monitoring, maintained with 10% of the initial urethane dose if necessary. Hydration was maintained by intraperitoneal injection of 100 μl of 0.9% NaCl with 20 mm glucose at 1 h intervals. A 0.1 ml bolus of 5% (w/v) Texas Red Dextran (70 kDA) (Invitrogen) in 0.9% NaCl was injected into the tail vein for blood flow visualization. In a small number of experiments, a 0.1 ml bolus of 5% (w/v) FITC dextran (500 kDa) (Invitrogen) in 0.9% NaCl was used. All chemicals were from Sigma Chemical unless indicated otherwise.
In a subset of mice, we assessed whether blood gas parameters were comparable at the beginning and at the end of experiments using mixed arterial and venous blood samples. Seven stroked mice were decapitated at the end of imaging experiments. One hundred microliters of blood was collected and immediately quantified with a CG8+ blood gas cartridge and iStat1 blood gas analyzer (Abbott). Corresponding blood parameters were measured at the beginning of experiments in age- and sex-matched mice (n = 7) that were anesthetized with urethane (1.5 mg/g body weight) and decapitated for blood collection. Assessment of blood oxygen level and the acid–base balance indicated that under our imaging conditions these blood parameters remained stable. Mice hydration was also stable during imaging as indicated by the hematocrit measurements. In addition to assessing the stability of blood gas parameters in mixed arterial and venous blood samples, we measured blood oxygen saturation in a subset of mice (n = 7) using MouseOx pulse oximeter mounted on the left thigh. The oxygen saturation level remained >90% for the duration of the experiment, indicating that under our imaging conditions mice were respiring properly.
Electrophysiological recording of electroencephalogram and SDs.
The cortical slow direct current (DC) potential and spontaneous electroencephalogram (EEG) activity were recorded with a glass microelectrode (filled with 0.9% NaCl, resistance 1–2 MΩ) inserted through dura to the site of imaged dendrites within layer I of somatosensory cortex. Signals from MultiClamp 200B amplifier were filtered at 1 kHz, digitized at 10 kHz with Digidata 1322A interface board, and analyzed with pClamp 9 software (Molecular Devices).
2PLSM.
Images were collected with the Zeiss infrared-optimized 40×/0.8 numerical aperture (NA) water-immersion objective using the Zeiss LSM 510 NLO META multiphoton system mounted on the motorized upright Axioscope 2FS microscope. The scan module was directly coupled with the Spectra-Physics Ti:sapphire broad-band, mode-locked laser (Mai-Tai) tuned to 910 nm for two-photon excitation. To monitor structural changes with green fluorescent protein, three-dimensional (3D) time-lapse images were taken at 1 μm increments using a 3× optical zoom, yielding a nominal spatial resolution of 6.86 pixels/μm (12 bits/pixel, 0.91 μs pixel time) across a 75 × 75 μm imaging field. Emitted light was detected by internal photomultiplier tubes (PMTs) of the scan module with pinhole entirely opened. Image stacks (consisting of 15–20 1 μm sections) were usually taken every 1–2 min during the first 30 min after the initial induced SD and then at 30 min intervals afterward (to decrease the risk of laser overexposure) unless an SD was seen to be occurring via the electrophysiological recording, in which case images were taken immediately at 1 min intervals until dendrites recovered. Imaging continued for up to 5 h poststroke. If shifting of the focal plane occurred, the field of focus was adjusted and recentered before acquiring image stacks (Risher et al., 2009).
Image analysis.
An LSM 510 Image Examiner (Zeiss) was used together with ImageJ (National Institutes of Health) and Bitplane Imaris and AutoAligner for image analysis. A median filter (radius = 2) was applied to images in figures to reduce photon and PMT noise. Dendritic beading was identified as the appearance of rounded regions extending beyond the diameter of the parent dendrite separated by “interbead” segments, occurring at any point along the length of the dendrite within the imaging field. A spine was considered lost when there was no indication of a spine head extending more than one-half of its diameter beyond the beaded portion of the dendrite. Dendritic recovery was defined as the reversal of beading, i.e., the disappearance of the rounded “beaded” regions. The shortest 3D linear distance between the edge of a dendritic profile and blood vessel surface was calculated using the 3D measurement tool of the LSM 510 Image Examiner.
Photothrombotic stroke model.
A bolus of Rose Bengal (RB) was injected through the tail vein (0.03 mg/g, diluted to 10 mg/ml in 0.9% NaCl) over 15 s with a syringe pump (World Precision Instruments). With LSM 510 software, a square-shaped region of interest (ROI; 1270 × 1270 μm) was positioned over middle cerebral artery (MCA) territory (Fig. 1A; supplemental Movie 1, available at www.jneurosci.org as supplemental material). In this ROI, only the perimeter (100 μm wide) was irradiated with the 514 nm Ar–Kr laser line of the LSM system through a 10×/0.3 NA water-immersion objective. Average power through the objective was ∼3 mW. The central square (1070 × 1070 μm, representing penumbra-like area at risk) was not illuminated by the laser beam. Since RB is a potent photosensitizer, laser irradiation resulted in vascular coagulation in the perimeter (Fig. 1A; supplemental Fig. 1, supplemental Movie 1, available at www.jneurosci.org as supplemental material). Photothrombosis was stopped immediately upon occurrence of the initial induced SD recorded within the central square in the vicinity of imaged dendrites (Fig. 1A, inset).
Figure 1.

Ischemic lesion induced by photoactivation of RB in a square-shaped perimeter leads to creation of a penumbra-like area at risk with recurring SDs. A, Cortical vasculature below the imaging window in mouse somatosensory cortex. Blood plasma was fluorescently labeled with FITC dextran (500 kDa). The axes identify the rostral (R) and medial (M) directions. Red arrows indicate branches of the MCA. The main figure shows placement of the perimeter zone to be irradiated between red and yellow lines. Within this perimeter, RB mediates photothrombotic occlusion of vascular channels by irradiation with 514 nm laser light. The penumbra-like area at risk within the yellow square (1070 × 1070 μm) was not exposed to the laser light. A glass recording microelectrode (red dotted line; resistance, 1–2 MΩ) is inserted into cerebral cortex within the area, where all 2PLSM imaging was performed. Scale bar, 200 μm. Inset: RB photoactivation is stopped upon confirmation of the initial induced SD, represented by a downward deflection of the extracellular DC potential. Average photothrombosis time is 7.87 ± 0.76 min, n = 34 mice. B, Example recording from microelectrode placed next to imaged dendrites approximately within the middle of penumbra zone. Arrow indicates the time of RB injection and start of photoactivation. The first deflection of the cortical slow DC potential indicates initial induced SD, whereas the second and third deflections represent spontaneous SDs. Note that spontaneous SD shifts are superimposed on a shallow DC negativity between SDs. C, Grayscale image sequence of laser speckle contrast reveals surface CBF directly below the craniotomy, with regions of high-velocity blood flow appearing dark. Placement of the perimeter zone to be irradiated (within solid lines) and recording electrode (dotted line) are indicated in control image. Immediately after induced SD, blood flow velocity in some vessels is decreasing (example marked with arrowhead) and overall image brightness is increased, indicating decreased blood flow of the capillary bed. Decline in CBF progresses over time, as seen at 4.5 h after induced SD. Scale bar, 250 μm. D, Time course of changes in average CBF in the penumbra-like area at risk over 5 h after photothrombotic stroke (n = 5 animals; each animal is represented by a distinct symbol) calculated by using inverse speckle correlation time images. Time 0 corresponds with the onset of the initial induced SD. Each data point is the average of 28–31 ROIs covering most of the penumbra-like area at risk within the square but omitting clearly visible vessels.
Fluoro-Jade staining.
After photothrombosis at 6, 24, 48, and 72 h, a subset of wild-type mice were perfused with 4% paraformaldehyde (Electron Microscopy Sciences). Brains were removed and transferred into vial 4% paraformaldehyde (PFA) overnight. Next day, brains were cut into 100 μm sections, mounted with distilled water onto gelatin-coated slides, and dried overnight. Slides were then hydrated through graded alcohols to distilled water, placed into a solution of 0.06% KMnO4 for 15 min, rinsed in distilled water, and then stained with 0.001% Fluoro-Jade solution (Histo-Chem) for 30 min. Sections were then rinsed in distilled water, dried, cleared with xylene, and mounted on the microscope slides with DPX (Aldrich) mounting media for further examination.
2,3,5-Triphenyltetrazolium chloride staining.
After photothrombosis at 5 h, a subset of wild-type mice were perfused with ice-cold saline. Brains were removed, rinsed in ice-cold saline, and cut using rodent brain matrix (ASI Instruments) into 1 mm sections. Sections were placed in 2% 2,3,5-triphenyltetrazolium chloride (TTC) (cold before use) (Beckton-Dickinson) in 1× PBS solution at room temperature for 30 min and then fixed with 4% PFA.
CBF measurements.
Two-dimensional maps of CBF with high spatiotemporal resolution were obtained by laser speckle imaging as described previously (Dunn et al., 2001; Sigler et al., 2008). Briefly, the cortical surface was illuminated at an angle of ∼30° by a 785 nm StockerYale laser with Edmund Optics anamorphic beam expander and imaged with a 4×/0.075 NA objective. Three hundred images were captured at 13 Hz using 20 ms exposure by the Zeiss AxioCam MRm CCD camera controlled by AxioVision software (Zeiss). Using the two-dimensional variance filtering (3 × 3 pixel kernel size, 3.23 μm/pixel) function of ImageJ, individual images of variance were created from raw speckle images and then the square root of the averaged variance image was taken to calculate a single 32 bit image of the standard deviation. An image of laser speckle contrast (k) was obtained by dividing the standard deviation image by the mean of all raw images.
We quantified relative changes in CBF velocity using speckle correlation time values (τc), as described previously (Dunn et al., 2001; Ayata et al., 2004; Tom et al., 2008). Briefly, k images were converted to relative τc images with the asymptote algorithm method using the equation τc ≈ 2Tk2, where T is the exposure duration of the camera (Tom et al., 2008). Since the velocity of blood flow is assumed to be inversely proportional to speckle correlation time (Dunn et al., 2001), inverse speckle correlation time images (1/τc) were calculated in control, at different times after photothrombotic occlusion, and at the end of experiments after cardiac arrest induced by 1 ml of air embolization into the tail vain. The post-cardiac arrest 1/τc image (corresponding to biological zero flow) was subtracted from the 1/τc control and experimental images to create relative CBF images (percentage of baseline CBF). To quantify relative changes in CBF velocity, 28–31 ROIs covering most of the penumbra-like area at risk but omitting major vessels were drawn. A mean control (baseline) value of 1/τc and mean 1/τc postocclusion values were calculated using these ROIs, and the percentage of baseline CBF was computed.
Conventional laser Doppler recordings of CBF were conducted in wild-type mice using the PeriFlux 5000 system (Perimed PF5010 laser Doppler perfusion monitoring unit) equipped with small Probe 407–1 (Perimed) and PeriSoft analysis software.
Statistics.
SigmaStat (Systat) and Statistica (StatSoft) were used for statistical analyses. Two-tailed unpaired Student's t test and Mann–Whitney U Test were used to compare group means for parametric and nonparametric data, respectively. One-way repeated-measures (RM) ANOVA was used to compare means over different time points. The χ2 test was used to analyze data arranged in contingency tables. The significance criterion was set at p < 0.05. Data are presented as the mean ± SEM.
Results
Localized square-shaped photothrombotic occlusion creates an ischemic penumbra-like area at risk with spontaneous recurring SDs
Several dendrites from layer I of somatosensory cortex were selected for real-time 2PLSM imaging with a glass recording microelectrode placed in their vicinity. A square-shaped ROI centered above these dendrites was irradiated with a 514 nm green laser to activate the photosensitive dye RB, administered intravenously, to create the ischemic lesion surrounding a penumbra-like hypoperfused area at risk (Fig. 1A; supplemental Fig. 1, supplemental Movie 1, available at www.jneurosci.org as supplemental material). Photothrombosis was performed until confirmation of a negative deflection of the cortical slow DC potential recorded at the site of imaged dendrites in the middle of the penumbra, signifying the initial induced SD (Fig. 1A, inset). Induced SD was followed by spontaneous recurring SDs in 26 of 34 mice, with a maximum of 8 SDs recorded during the first 3–5 h after stroke (Fig. 1B). Only these spontaneous SDs (81 total), and not the initial induced SDs, were included in the analysis for these experiments unless stated otherwise. To confirm that these DC deflections represented SDs, we used two recording microelectrodes in five experiments with 19 total SDs. The DC potential shift at the microelectrode placed at the imaging site near the middle of the penumbra was followed by stereotypical DC shift at the microelectrode placed ∼1 mm outside of the lesion. The time delays between the two microelectrodes confirm propagating SDs of multifocal origin. As expected for SDs, depolarization was accompanied by suppression of the spontaneous EEG activity with >80% reduction of the power spectrum amplitude (mV2/Hz) in the 0.3–3 Hz frequency domain (Murphy et al., 2008; Oliveira-Ferreira et al., 2010).
Photothrombotic occlusion produced an ischemic lesion verified by TTC staining as early as 5 h poststroke (supplemental Fig. 2A, available at www.jneurosci.org as supplemental material). Staining with Fluoro-Jade did not detect dying neurons at 6 h after photothrombosis, but did confirm the presence of dying neurons in the upper cortical layers and some in layer V at 24 h (n = 4 mice, data not shown). Massive neuronal death extending through all cortical layers was detected at 48 and 72 h poststroke (supplemental Fig. 2B, available at www.jneurosci.org as supplemental material).
To confirm changes in regional CBF, we conducted laser Doppler measurements with a small probe (1 mm diameter) positioned over the penumbra zone. Penumbra underwent progressive hypoperfusion with regional CBF declining from 62.2 ± 9.7% of the control value at 30 min poststroke to 29.5 ± 5.3% at 5 h (p < 0.02, one-way RM ANOVA; n = 4 animals). Since conventional laser Doppler flowmetry has limited spatial resolution, we used laser speckle imaging to acquire higher resolution two-dimensional maps of CBF to further confirm progressive changes in CBF (Fig. 1C,D). The changes in laser speckle signals were similar in magnitude to the changes in the Doppler blood flow signals. Laser speckle imaging revealed a drop in CBF into the flow range indicative of the penumbra immediately after photothrombotic occlusion (45.4 ± 9.0% of control; p < 0.03, paired t test) (Fig. 1D, time 0). Both methods confirmed that blood flow in the area at risk decreased by ∼30% between 30 min and 5 h after beginning of occlusion. As revealed in a subset of experiments (n = 4), the area of severely hypoperfused cortex (<20% of control CBF) within penumbra-like area at risk expanded during SD on average by 29.0 ± 8.4% of the pre-SD value (p < 0.03, paired t test) (supplemental Fig. 3A,B, available at www.jneurosci.org as supplemental material). In experimental ischemia, SDs are associated with vasoconstriction leading to abrupt reduction of CBF and growth of a region of metabolic compromise (Dreier et al., 2000; Shin et al., 2006; Strong et al., 2007). We conclude that square-shaped photothrombotic occlusion is an adequate representation of penumbra-like hypoperfused area that can be precisely anatomically localized and compared between animals. We therefore used this model to study the spatiotemporal link between dendrites and recurring SDs in penumbra.
Successive rounds of dendritic beading and recovery coincide with passage of SDs
Transient global ischemia in vivo results in dendritic beading and spine loss coincident with the passage of ischemia-induced SD, followed by recovery of dendrites and spines during reperfusion (Murphy et al., 2008). Here, we used 2PLSM to determine whether recurring spontaneous SDs augment dendritic injury by promoting acute damage to dendrites and spines in the penumbra. In the representative experiment shown in Figure 2A, SDs are paralleled by rapid changes in dendritic structure. The intact control dendrite was beaded when imaged immediately after the initial induced SD at 8 min. After passage of the SD, the beading subsided and dendrites assumed their original structure. A cluster of spontaneous SDs was coupled with another round of rapid dendritic beading, with dendritic recovery accompanying DC recovery as shown at 16 min. A single spontaneous SD at 19 min coincided with another beading and recovery (shown at 22 min). We confirmed in control experiments (n = 4) that this acute beading response of dendrites does not occur in the absence of SDs by doing 2PLSM imaging and/or 514 nm laser exposure without RB-assisted photothrombosis (supplemental Fig. 4, available at www.jneurosci.org as supplemental material). A second example of acute dendritic beading in response to SDs shown in Figure 2B and supplemental Movie 2 (available at www.jneurosci.org as supplemental material) confirms rapid dendritic beading and spine loss (Fig. 2B, II) coinciding with the initial induced SD. Some spines reappeared in their original locations (Fig. 2B, III) as the dendrites rapidly recovered (this dendritic recovery averaged ∼74 s), but some spines are permanently lost. After a round of spontaneous SD-induced rapid beading (taking ∼6 s to reach maximum bead size) (Fig. 2B, IV) and recovery (Fig. 2B, V), the dendritic structure remained relatively stable over the next several hours of imaging until a single SD occurred, and rapid beading and spine loss happened once more. After this event, the dendrites and spines did not recover during the next 2 h, suggesting that the accumulated stress of the prior SDs led to terminal dendritic injury. In total, 76% of the mice that had detectable spontaneous SDs experienced this terminal SD-induced beading. The final spontaneous SD was detected with an average onset time of 37.0 ± 11.9 min since initial induced SD.
Figure 2.
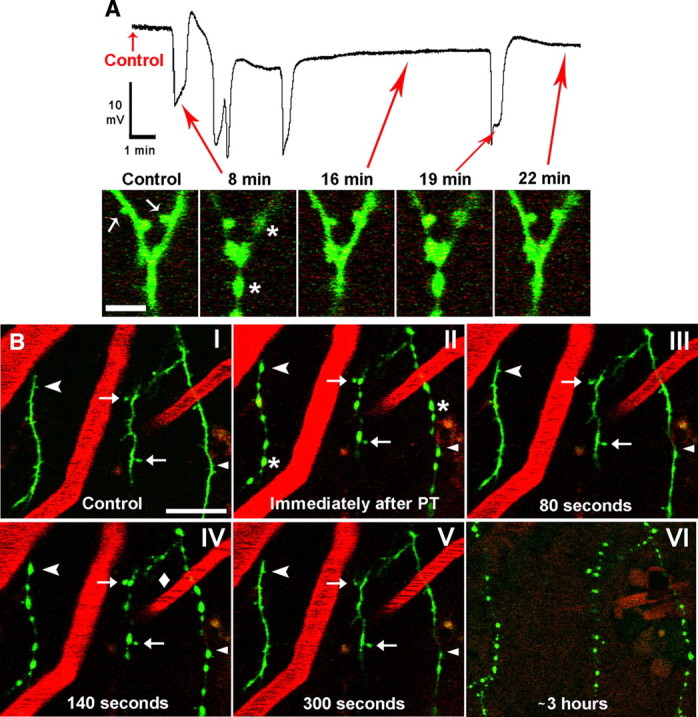
Dendrites in the penumbra undergo a rapid cycle of beading and recovery coinciding with the passage of SDs. A, Top: example recording from microelectrode placed next to imaged dendrites within the middle of penumbra, showing the photothrombotic occlusion-induced initial SD (∼8 min) followed by 4 spontaneous SDs. Note a small DC negative shift on which spontaneous SDs are riding. Bottom, In vivo 2PLSM high-magnification image sequence showing a branched dendrite from layer I of somatosensory cortex with arrows corresponding to various time points on the above physiology recording. The dendrite (spines indicated by arrows) appears normal in control but becomes beaded (asterisks) and spines are lost immediately after induced SD at 8 min. The dendrite and spines are shown to be recovered at 16 min. However, a subsequent spontaneous SD at 19 min beads the dendrite again, with recovery shown at 22 min. Scale bar, 5 μm. B, Low-magnification 2PLSM image sequence showing dendrites (green) as well as blood vessels (red; labeled with Texas Red dextran) from layer I of somatosensory cortex. Blood flow within vessels is indicated by streaking caused by scanning of moving nonfluorescent red blood cells. The dendrites appear normal during control (I) and undergo rapid beading (asterisks) and recovery coinciding with SDs (II–V) in similar fashion to the example shown in A. Blood flow velocity in one of the vessels slows during an SD (IV, diamond) as dendrites bead, despite no apparent change in the other two imaged vessels. Some dendritic spines are permanently lost (arrowhead), transiently lost (chevrons), or persistent (arrows) during SD-induced dendritic beading. Appearance of dendritic beads is relatively constant during passage of these SDs. Finally, nearly 3 h after photothrombosis, the dendrites undergo terminal beading after an SD and are no longer able to recover (VI) (vessels are no longer clearly seen at this time point due to Texas Red Dextran leaking out, necessitating a reduction in the red channel gain). Scale bar, 20 μm.
As seen in panel IV of Figure 2B, blood flow slowed in one of the capillaries (diamond) adjacent to the imaged dendrites as a spontaneous SD was occurring (see also supplemental Movie 2, available at www.jneurosci.org as supplemental material). Changes in blood flow velocity were confirmed visually by less regular streaking in a vessel (Zhang and Murphy, 2007; Risher et al., 2009). We looked more closely at the relationship among SDs, blood flow, and dendritic beading to determine whether acute rapid dendritic changes occurred as a result of local hypoperfusion or SD (Fig. 3). SD consistently occurs alongside dendritic beading, but changes in capillary blood flow are more variable. There are cases where blood flow slowed seconds before dendritic beading (Fig. 3A), when beading preceded blood flow slowing (Fig. 3B), and when beading occurred without a visible change in local blood flow velocity (Fig. 3C). We also observed instances where local blood flow was completely stalled without a rapid change in dendritic appearance (supplemental Fig. 5, available at www.jneurosci.org as supplemental material). In these cases, terminal beading induced by spontaneous SD was not observed. In the first example (supplemental Fig. 5A, available at www.jneurosci.org as supplemental material), dendrites remained stable for many minutes despite loss of blood flow in nearby capillaries before beading occurred. In the second example (supplemental Fig. 5B, available at www.jneurosci.org as supplemental material), the dendrite remained stable for several hours without blood flow in a nearby capillary until an additional photothrombosis-induced SD finally beaded the dendrite. These observations suggest that SD is consistently associated with rapid dendritic beading independently of changes in nearby capillary blood flow, but in the absence of SD dendrites may remain intact longer even if capillary blood flow is lost.
Figure 3.

Dendritic beading consistently coincides with passage of spontaneous SDs despite variability in capillary blood flow. Changes in blood flow during spontaneous SDs were assessed from viewing all individual sections from a z-stack, but only single section images are shown here. Each numbered 2PLSM image (left) corresponds with a time point indicated on the respective DC potential recording at the imaging site (right). A, The onset of a spontaneous SD corresponds with the slowing of blood flow in the capillary (asterisk) before dendritic beading, followed by recovery of both blood flow and dendritic structure. B shows a reversal of these events, with dendritic beading taking place before a transient decrease in capillary flow velocity (asterisk). C, Finally, dendritic beading can occur in conjunction with SD with no sign of blood flow velocity change. Scale bar, 5 μm.
Dendritic beading and spine loss were quantified to test whether there was a progressive increase in structural damage to dendrites in the penumbra associated with each SD. Bead diameter and spine density were quantified in a subset of five experiments with at least four SDs. Each SD resulted in rapid dendritic beading followed by fast recovery during repolarization. After induced SD, bead diameter and density remained constant during each subsequent spontaneous SD (Fig. 4A; see also Fig. 2 and supplemental Movie 2, available at www.jneurosci.org as supplemental material). There was a significant loss of spines immediately after the induced SD as spine density decreased from 2.64 spines/10 μm in control to 1.67 spines/10 μm after recovery (Fig. 4B, left). After this initial decrease, the density of recovered spines was not significantly altered after each subsequent SD (Fig. 4B, right) until terminal beading and complete spine loss. Thus, with passage of multiple SDs, dendrites undergo similar rounds of rapid beading and recovery without a progressive increase in visible structural damage until terminal beading occurs.
Figure 4.

Changes in dendritic bead parameters and spine density in the wake of successive rounds of SDs. Bead density/diameter and spine density were assessed from random 30 μm segments of 3 dendrites in each imaging field as observed in maximum intensity projections of 3D stacks. Data points were only used when an image was taken near the peak of a recorded SD. A, Data from 5 animals showing constant bead diameter (p = 0.7) and density (p = 0.4, one-way RM ANOVA) during subsequent SDs (regression lines shown). Values are shown as percentage of bead diameter immediately after induced SD. B, Left, Summary from 5 animals showing an initial decrease in spine density after passage of initial induced SD (mean ± SEM; *p < 0.001, paired t test). Right, After the initial SD-induced decrease, spine density is not significantly altered for the remainder of the experiment in the same 5 animals (p = 0.2, one-way RM ANOVA; regression line shown) until the terminal beading resulting in total spine loss (data point not shown).
The probability of rapid dendritic recovery is not linked with the quantitative features of SDs
We calculated parameters of each SD including amplitude, duration, maximum rate of depolarization, onset time from the beginning of induced SD, and time since previous SD onset. We next determined whether these quantitative features of SDs could predict rapid dendritic recovery from beading (i.e., recovery that occurs in <3 min after beading onset, excluding four cases where a dendrite became beaded and did not recover until later in the experiment). Figure 5A shows dendrites that beaded during passage of an SD front and recovered during subsequent repolarization, while Figure 5B shows beading without immediate structural recovery. With all of these quantitative parameters (Fig. 5C), there was no significant difference between those dendrites that were able to recover quickly after beading and those that were not, indicating that the quantitative features of SDs do not determine the likelihood of subsequent rapid dendritic recovery. However, the probability of terminal dendritic injury was correlated with total SD duration. Mice with terminal dendritic injury had significantly greater total SD duration than those that did not experience terminal injury (4.97 ± 1.10 min with terminal injury vs 1.99 ± 0.53 min without; p = 0.0044, Mann–Whitney U test), strengthening the idea that accumulated stress resulting from SDs expedites acute dendritic injury in the ischemic penumbra.
Figure 5.
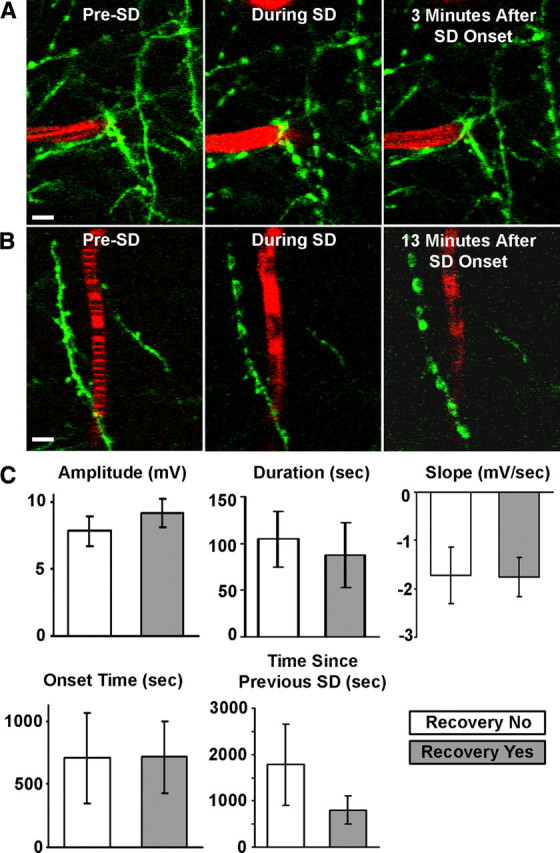
The probability of rapid (<3 min) dendritic recovery from SD-induced beading is not influenced by the quantitative features of SDs. A, 2PLSM image sequence of dendrites (green) and a capillary (red) during passage of a spontaneous SD. The dendrites appear normal, and blood flows before SD onset as indicated by striped image of capillary. The blood flow slows, and dendrites bead during a spontaneous SD. Blood flow returns and dendrites recover structurally near the capillary within minutes. Scale bar, 5 μm. B, Similar sequence as shown in A, but interruption in blood flow and dendritic beading are permanent in this example. Scale bar, 5 μm. C, Quantitative features of SDs, such as amplitude (potential difference between start of SD and the lowest point of the DC deflection), duration (time between the points corresponding to half the DC amplitude and the same potential during recovery), slope (taken from steepest 4 s segment of SD), onset time (relative to time of induced SD onset), and time since the previous SD, are not reliable predictors of rapid dendritic recovery after SD-induced beading (all graphs show mean ± SEM; p > 0.05, Mann–Whitney U test).
The likelihood of rapid dendritic recovery is usually linked with the presence of nearby flowing blood vessels
Upon inspection of Figure 5, A and B, it seemed that the presence of a nearby flowing blood vessel might have predictive value for rapid dendritic recovery. It has been shown that individual flowing vessels can support intact dendritic structure within ∼80 μm (Zhang and Murphy, 2007). Therefore, we determined whether the presence of nearby flowing vessels will predict synaptic circuitry outcome. A close-up of a dendrite in Figure 6A reveals a nearby flowing vessel that was not stalled during an SD. Though the dendrite became beaded during the SD, the indicated spine remained present. A second example shows a vessel that became stalled during an SD (Fig. 6B). Here, dendritic beading was accompanied by spine loss and a lack of recovery. This differential dendritic response to SDs was quantified in Figure 6C and correlated with the presence of a nearby flowing vessel located within 20 μm, as measured in 3D. Greater than 80% of all SDs resulted in dendritic beading, regardless of whether there was a nearby flowing vessel. Rapid dendritic recovery occurred more frequently when there was a nearby flowing vessel (81.5 ± 7.6% vs 34.6 ± 9.5% when flowing vessel absent). In all cases when a nearby flowing vessel was present, the probability of dendritic recovery was independent of vessel diameter (5.84 ± 1.84 μm without recovery vs 5.02 ± 0.52 μm with recovery; p = 0.6, t test). Thus, the availability of nearby flowing vessels can usually predict the occurrence of rapid dendritic recovery after SD-induced beading. Nevertheless, in approximately one-third of cases dendrites did not recover even in the presence of a nearby flowing vessel, suggesting that energy needs for recovery exceeded energy supply of compromised blood flow.
Figure 6.

The presence of flowing blood vessel increases probability of rapid recovery for dendrites beaded by SDs. A, 2PLSM image sequence of a dendrite (green) and a capillary (red) before, during, and after a SD. The capillary in close proximity to the dendrite maintains its flow throughout the duration of the SD and afterward, even as the dendrite itself becomes beaded. The dendrite then swiftly recovers, and the spine (arrow) is present throughout the entire sequence. Scale bar, 5 μm. B, Similar sequence as shown in A, but the capillary blood flow stalls during the SD [confirmed visually by the loss of streaking in vessels (Zhang and Murphy, 2007; Risher et al., 2009)]. The dendrite beaded by an SD does not recover in the absence of a nearby flowing blood vessel, and the spines (arrowheads) are lost. Scale bar, 5 μm. C, Summary from 81 SDs in 26 animals showing that when dendritic beading occurs (which happens with the majority of SDs), there is a significant increase in the chances for dendritic recovery when there is a nearby flowing blood vessel. Values represent the percentage of all recorded SDs as analyzed within each experiment that are associated with beading and rapid dendritic recovery. Asterisk indicates significant difference between conditions when a nearby blood vessel is flowing or stalled (*p < 0.05, χ2 test).
Discussion
We used real-time in vivo imaging of dendritic circuitry in the penumbra to directly examine the dynamics of SD-induced injury and the recovery of dendrites and dendritic spines. The location of the penumbra was defined within the borders of a photochemically induced square-shaped ischemic lesion. Coinciding with the passage of SDs is dendritic beading, which is reversible as long as sufficient residual blood flow is present. It appears that once the energy demands for recovery are no longer met by the diminishing blood flow, dendrites become irreversibly damaged by an SD, signifying the cellular component of penumbral recruitment into the infarct core.
Recently, wide-field photothrombosis over a large cortical area was successfully used with 2PLSM to reveal dynamic changes in dendritic structure, blood flow, and cortical function immediately after stroke (Zhang et al., 2005; Enright et al., 2007; Zhang and Murphy, 2007) and during long-term recovery (Brown et al., 2007; Winship and Murphy, 2008; Brown et al., 2009). Photochemical thrombosis and 2PLSM were also effectively used for targeted occlusion of individual surface arterioles (Nishimura et al., 2006; Schaffer et al., 2006; Sigler et al., 2008) to study alterations in dendritic circuitry and cortical function (Zhang and Murphy, 2007) as well as cortical remapping (Sigler et al., 2009). In the traditional photothrombotic stroke protocol (Watson et al., 1985), a lesion of consistent size and location is created over a large cortical area. We have adapted a variation of a “ring” model of photochemical thrombosis (Wester et al., 1995; Jiang et al., 2006) and integrated it with our 2PLSM system to create a small square-shaped ischemic lesion surrounding a penumbra-like area at risk. This stroke model avoids the difficulty in defining in real time the precise extent of the penumbra as with wide-field photothrombosis. It creates a reproducible penumbral zone anatomically localized to the same cortical region, facilitating comparison between animals. The nonirradiated area at risk inside the lesion inevitably undergoes progressive hypoperfusion and transforms into ischemic lesion (Wester et al., 1995). In our hands, this model was capable of consistently generating recurrent spontaneous SDs. SDs cause reduction of blood flow in metabolically compromised tissue in models of subarachnoid hemorrhage (Dreier et al., 1998) and focal ischemia (Shin et al., 2006; Strong et al., 2007; Oliveira-Ferreira et al., 2010). SDs are associated with calcium waves propagating among astrocytes, resulting in severe vasoconstriction (Chuquet et al., 2007) that further depletes energy stores (Dreier et al., 2001; Hashemi et al., 2009), exacerbating the mismatch between energy reserves and metabolic needs for repolarization. Similarly, in a subset of experiments, we have shown an increase in severely hypoperfused cortical region (<20% of control CBF) in the penumbra at the peak of SD. However, CBF responses to SDs were not further analyzed in this model. Future studies are required to assess neurovascular coupling during SDs and to elucidate whether a progressive CBF decrease is facilitated by SDs in this model. In the current study, we focused on high-resolution imaging of dendrites and nearby capillaries during SDs.
Electrophysiological studies describe SD as a voltage shift to near 0 mV caused by a large, nonspecific inward current (Na+, Cl−, Ca2+ influx, K+ efflux) (Somjen, 2001). Prolonged depolarization by recurring SDs is detrimental in metabolically compromised penumbra in animal models and in patients (Oliveira-Ferreira et al., 2010). If metabolic capacity is inadequate to restore ion homeostasis, neurons remain depolarized and prolongedly overloaded with Ca2+ resulting in irreversible neuronal injury and death (Somjen, 2001; Dietz et al., 2009). Terminal dendritic beading has been associated with irreversible neuronal injury during ischemia (Hsu and Buzsáki, 1993; Hori and Carpenter, 1994), and it may be an early indication of cell death pathway activation (Enright et al., 2007). In our experiments, recurrent spontaneous SDs were clearly associated with dendritic beading, and the total duration of all SDs was correlated with the incidence of terminal dendritic beading. Dendritic beading can be also reversible when energy stores are not compromised, as in the case of cold-induced beading when energy reserves become available with rewarming (Kirov et al., 2004) or during cortical SD invoked in healthy tissue with sufficient blood flow (Takano et al., 2007). Dendritic beading is reversible if reperfusion is possible after focal stroke (Zhang et al., 2005) or after brief global ischemia (Murphy et al., 2008).
A powerful front of propagating SD swells neuronal somata and causes dendritic and axonal beading in brain slices during oxygen/glucose deprivation (Obeidat et al., 2000; Andrew et al., 2007; Risher et al., 2009). Such energy deprivation alters the conformation and distribution of the polymeric F-actin (Atkinson et al., 2004), contributing to dendritic beading (Gisselsson et al., 2005). Low water permeability of neuronal plasma membrane provides protection from abrupt osmotic shifts, stabilizing their structure and function, but this protection fails under ischemic conditions, evoking prolonged depolarization (Andrew et al., 2007; Risher et al., 2009). The molecular pathways by which water moves through the osmotically tight neuronal compartment at stroke onset are not well understood. Bulk water influx might occur through hemichannels or other large-pore channels opened by ischemia (Anderson et al., 2005; Thompson et al., 2006). Transporters may also be responsible for water accumulation as well as recovery when water might be quickly translocated from neurons by cotransport proteins (MacAulay and Zeuthen, 2010). In any case, when energy stores are severely compromised, permanent dendritic beading with spine loss are signs of acute terminal injury (Obeidat et al., 2000; Zhang et al., 2005; Andrew et al., 2007; Davies et al., 2007; Enright et al., 2007).
In the penumbra, we observed dendrites as they beaded in response to recurring SDs. Because local blood flow was not completely abolished in the first few hours after occlusion, neurons were able to repolarize after an SD. However, in many cases large SD shifts were superimposed on shallow DC negativity between SDs, possibly reflecting the fraction of dying neurons that failed to repolarize (Oliveira-Ferreira et al., 2010). 2PLSM imaging revealed that repolarization was accompanied by reversal of dendritic beading in <3 min. A similar pattern of dendritic recovery between 4 and 30 min develops during reperfusion after global ischemia-induced SD (Murphy et al., 2008). A second round of global ischemia also resulted in dendritic beading, but recovery was much slower. Single ischemia-induced SD also resulted in the loss of dendritic structure during MCA occlusion (Li and Murphy, 2008). In our experiments, the process of rapid dendritic beading and recovery repeated itself with each recurring SD. Approximately 35% of spines were lost after the initial induced SD. Further spine loss was transient during subsequent SDs with reappearance in the same locations during recovery. Rapid recovery after beading did not occur indefinitely, as the accumulating stress of SDs eventually took their toll, resulting in terminal dendritic beading. Thus, irreversibly damaged dendrites essentially represent the cellular component of terminal injury, indicating that these affected penumbral areas had been recruited into the infarct core.
Rapid dendritic beading occurred simultaneously with SD the majority of time, while changes in nearby capillary blood flow were much more variable. This variability of capillary flow might reflect fast redistribution of upstream blood flow during SD before this SD propagates to the imaging site. In the absence of SD, dendrites may remain intact for extended periods of time despite loss of nearby capillary flow. In fact, during focal stroke created by a wide-field photothrombosis, an intact dendritic structure can be maintained by flowing vessels located as far as 80 μm away (Zhang and Murphy, 2007). In the case of severe ischemia (<10% of control CBF and presumably in the absence of flowing vessels in an 80 μm radius), dendrites were beaded within 10 min (Zhang et al., 2005). For comparison, in our study and in Murphy et al. (2008) beading occurred within just a few seconds during SD. It should be noted that under conditions of continuous vessel obstruction, the metabolically compromised neurons eventually will swell and dendrites bead even in the absence of SDs because of the influx of ions driven by Gibbs–Donnan forces (Somjen, 2004). Neurons will swell without countered outward transport by ion pumps, mainly by the Na+-K+-ATPase. In the experiments reported here, SDs result in dendritic beading within a few seconds, thus facilitating acute dendritic injury in the penumbra.
Rounds of dendritic beading and recovery illustrate the structural resiliency of mature neurons (Kirov et al., 2004). Probability of this fast (<3 min) recovery was not affected by the quantitative parameters of individual SDs but was dependent on the presence of nearby flowing blood vessels. In our experiments, rapid structural recovery had a significantly higher chance of occurring in dendrites close to flowing vessels, implying that the presence of the vessel was sufficient to provide the energy required for recovery. However, the presence of a nearby flowing vessel was not a definitive indication of recovery since some beaded dendrites did not recover even when a flowing vessel was <20 μm away. This suggests that the metabolic demand of widespread repolarization after each SD invariably elevates metabolic stress, recruiting the penumbral areas into the infarct even if residual flow is present.
Footnotes
This work was supported by National Institutes of Health Grants NS064753 (W.C.R.) and NS057113 (S.A.K.). We thank Dr. Joshua Sanes for his generous gift of [GFP-M] transgenic mice. We also thank Drs. Ioulia Fomitcheva, David Andrew, Askiel Bruno, and Tadashi Masuda for their helpful comments regarding the manuscript; Dr. Nanna MacAulay for helpful discussion of water transport during ischemia; Dr. Valery Kalatsky for his advice on laser speckle analyses; and Dr. David Hess for helpful discussions throughout the conception and development of this project. We thank Jeremy Sword for technical assistance on supplemental Fig. 2B.
References
- Anderson TR, Jarvis CR, Biedermann AJ, Molnar C, Andrew RD. Blocking the anoxic depolarization protects without functional compromise following simulated stroke in cortical brain slices. J Neurophysiol. 2005;93:963–979. doi: 10.1152/jn.00654.2004. [DOI] [PubMed] [Google Scholar]
- Andrew RD, Labron MW, Boehnke SE, Carnduff L, Kirov SA. Physiological evidence that pyramidal neurons lack functional water channels. Cereb Cortex. 2007;17:787–802. doi: 10.1093/cercor/bhk032. [DOI] [PubMed] [Google Scholar]
- Atkinson SJ, Hosford MA, Molitoris BA. Mechanism of actin polymerization in cellular ATP depletion. J Biol Chem. 2004;279:5194–5199. doi: 10.1074/jbc.M306973200. [DOI] [PubMed] [Google Scholar]
- Ayata C, Dunn AK, Gursoy-OZdemir Y, Huang Z, Boas DA, Moskowitz MA. Laser speckle flowmetry for the study of cerebrovascular physiology in normal and ischemic mouse cortex. J Cereb Blood Flow Metab. 2004;24:744–755. doi: 10.1097/01.WCB.0000122745.72175.D5. [DOI] [PubMed] [Google Scholar]
- Back T, Ginsberg MD, Dietrich WD, Watson BD. Induction of spreading depression in the ischemic hemisphere following experimental middle cerebral artery occlusion: effect on infarct morphology. J Cereb Blood Flow Metab. 1996;16:202–213. doi: 10.1097/00004647-199603000-00004. [DOI] [PubMed] [Google Scholar]
- Brown CE, Li P, Boyd JD, Delaney KR, Murphy TH. Extensive turnover of dendritic spines and vascular remodeling in cortical tissues recovering from stroke. J Neurosci. 2007;27:4101–4109. doi: 10.1523/JNEUROSCI.4295-06.2007. [DOI] [PMC free article] [PubMed] [Google Scholar]
- Brown CE, Aminoltejari K, Erb H, Winship IR, Murphy TH. In vivo voltage-sensitive dye imaging in adult mice reveals that somatosensory maps lost to stroke are replaced over weeks by new structural and functional circuits with prolonged modes of activation within both the peri-infarct zone and distant sites. J Neurosci. 2009;29:1719–1734. doi: 10.1523/JNEUROSCI.4249-08.2009. [DOI] [PMC free article] [PubMed] [Google Scholar]
- Chuquet J, Hollender L, Nimchinsky EA. High-resolution in vivo imaging of the neurovascular unit during spreading depression. J Neurosci. 2007;27:4036–4044. doi: 10.1523/JNEUROSCI.0721-07.2007. [DOI] [PMC free article] [PubMed] [Google Scholar]
- Davies ML, Kirov SA, Andrew RD. Whole isolated neocortical and hippocampal preparations and their use in imaging studies. J Neurosci Methods. 2007;166:203–216. doi: 10.1016/j.jneumeth.2007.07.012. [DOI] [PMC free article] [PubMed] [Google Scholar]
- Dietz RM, Weiss JH, Shuttleworth CW. Contributions of Ca2+ and Zn2+ to spreading depression-like events and neuronal injury. J Neurochem. 2009;109(Suppl 1):145–152. doi: 10.1111/j.1471-4159.2009.05853.x. [DOI] [PMC free article] [PubMed] [Google Scholar]
- Dirnagl U, Iadecola C, Moskowitz MA. Pathobiology of ischaemic stroke: an integrated view. Trends Neurosci. 1999;22:391–397. doi: 10.1016/s0166-2236(99)01401-0. [DOI] [PubMed] [Google Scholar]
- Dohmen C, Sakowitz OW, Fabricius M, Bosche B, Reithmeier T, Ernestus RI, Brinker G, Dreier JP, Woitzik J, Strong AJ, Graf R. Spreading depolarizations occur in human ischemic stroke with high incidence. Ann Neurol. 2008;63:720–728. doi: 10.1002/ana.21390. [DOI] [PubMed] [Google Scholar]
- Dreier JP, Körner K, Ebert N, Görner A, Rubin I, Back T, Lindauer U, Wolf T, Villringer A, Einhäupl KM, Lauritzen M, Dirnagl U. Nitric oxide scavenging by hemoglobin or nitric oxide synthase inhibition by N-nitro-l-arginine induces cortical spreading ischemia when K+ is increased in the subarachnoid space. J Cereb Blood Flow Metab. 1998;18:978–990. doi: 10.1097/00004647-199809000-00007. [DOI] [PubMed] [Google Scholar]
- Dreier JP, Ebert N, Priller J, Megow D, Lindauer U, Klee R, Reuter U, Imai Y, Einhäupl KM, Victorov I, Dirnagl U. Products of hemolysis in the subarachnoid space inducing spreading ischemia in the cortex and focal necrosis in rats: a model for delayed ischemic neurological deficits after subarachnoid hemorrhage? J Neurosurg. 2000;93:658–666. doi: 10.3171/jns.2000.93.4.0658. [DOI] [PubMed] [Google Scholar]
- Dreier JP, Petzold G, Tille K, Lindauer U, Arnold G, Heinemann U, Einhäupl KM, Dirnagl U. Ischaemia triggered by spreading neuronal activation is inhibited by vasodilators in rats. J Physiol. 2001;531:515–526. doi: 10.1111/j.1469-7793.2001.0515i.x. [DOI] [PMC free article] [PubMed] [Google Scholar]
- Dreier JP, Woitzik J, Fabricius M, Bhatia R, Major S, Drenckhahn C, Lehmann TN, Sarrafzadeh A, Willumsen L, Hartings JA, Sakowitz OW, Seemann JH, Thieme A, Lauritzen M, Strong AJ. Delayed ischaemic neurological deficits after subarachnoid haemorrhage are associated with clusters of spreading depolarizations. Brain. 2006;129:3224–3237. doi: 10.1093/brain/awl297. [DOI] [PubMed] [Google Scholar]
- Dunn AK, Bolay H, Moskowitz MA, Boas DA. Dynamic imaging of cerebral blood flow using laser speckle. J Cereb Blood Flow Metab. 2001;21:195–201. doi: 10.1097/00004647-200103000-00002. [DOI] [PubMed] [Google Scholar]
- Enright LE, Zhang S, Murphy TH. Fine mapping of the spatial relationship between acute ischemia and dendritic structure indicates selective vulnerability of layer V neuron dendritic tufts within single neurons in vivo. J Cereb Blood Flow Metab. 2007;27:1185–1200. doi: 10.1038/sj.jcbfm.9600428. [DOI] [PubMed] [Google Scholar]
- Fabricius M, Fuhr S, Bhatia R, Boutelle M, Hashemi P, Strong AJ, Lauritzen M. Cortical spreading depression and peri-infarct depolarization in acutely injured human cerebral cortex. Brain. 2006;129:778–790. doi: 10.1093/brain/awh716. [DOI] [PubMed] [Google Scholar]
- Gisselsson LL, Matus A, Wieloch T. Actin redistribution underlies the sparing effect of mild hypothermia on dendritic spine morphology after in vitro ischemia. J Cereb Blood Flow Metab. 2005;25:1346–1355. doi: 10.1038/sj.jcbfm.9600131. [DOI] [PubMed] [Google Scholar]
- Hartings JA, Rolli ML, Lu XC, Tortella FC. Delayed secondary phase of peri-infarct depolarizations after focal cerebral ischemia: relation to infarct growth and neuroprotection. J Neurosci. 2003;23:11602–11610. doi: 10.1523/JNEUROSCI.23-37-11602.2003. [DOI] [PMC free article] [PubMed] [Google Scholar]
- Hashemi P, Bhatia R, Nakamura H, Dreier JP, Graf R, Strong AJ, Boutelle MG. Persisting depletion of brain glucose following cortical spreading depression, despite apparent hyperaemia: evidence for risk of an adverse effect of Leao's spreading depression. J Cereb Blood Flow Metab. 2009;29:166–175. doi: 10.1038/jcbfm.2008.108. [DOI] [PubMed] [Google Scholar]
- Holtmaat AJ, Wilbrecht L, Karpova A, Portera-Cailliau C, Burbach B, Trachtenberg T, Svoboda K. Long-term, high-resolution imaging of neurons in the neocortex in vivo. In: Yuste R, Konnerth A, editors. Imaging in neuroscience and development: a laboratory manual. Cold Spring Harbor, NY: Cold Spring Harbor Laboratory; 2005. pp. 627–638. [Google Scholar]
- Hori N, Carpenter DO. Functional and morphological changes induced by transient in vivo ischemia. Exp Neurol. 1994;129:279–289. doi: 10.1006/exnr.1994.1170. [DOI] [PubMed] [Google Scholar]
- Hossmann KA. Viability thresholds and the penumbra of focal ischemia. Ann Neurol. 1994;36:557–565. doi: 10.1002/ana.410360404. [DOI] [PubMed] [Google Scholar]
- Hsu M, Buzsáki G. Vulnerability of mossy fiber targets in the rat hippocampus to forebrain ischemia. J Neurosci. 1993;13:3964–3979. doi: 10.1523/JNEUROSCI.13-09-03964.1993. [DOI] [PMC free article] [PubMed] [Google Scholar]
- Jiang W, Gu W, Hossmann KA, Mies G, Wester P. Establishing a photothrombotic ‘ring’ stroke model in adult mice with late spontaneous reperfusion: quantitative measurements of cerebral blood flow and cerebral protein synthesis. J Cereb Blood Flow Metab. 2006;26:927–936. doi: 10.1038/sj.jcbfm.9600245. [DOI] [PubMed] [Google Scholar]
- Kaminogo M, Suyama K, Ichikura A, Onizuka M, Shibata S. Anoxic depolarization determines ischemic brain injury. Neurol Res. 1998;20:343–348. doi: 10.1080/01616412.1998.11740529. [DOI] [PubMed] [Google Scholar]
- Kirov SA, Petrak LJ, Fiala JC, Harris KM. Dendritic spines disappear with chilling but proliferate excessively upon rewarming of mature hippocampus. Neuroscience. 2004;127:69–80. doi: 10.1016/j.neuroscience.2004.04.053. [DOI] [PubMed] [Google Scholar]
- Leão AAP. Spreading depression of activity in the cerebral cortex. J Neurophysiol. 1944;7:359–390. doi: 10.1152/jn.1947.10.6.409. [DOI] [PubMed] [Google Scholar]
- Li P, Murphy TH. Two-photon imaging during prolonged middle cerebral artery occlusion in mice reveals recovery of dendritic structure after reperfusion. J Neurosci. 2008;28:11970–11979. doi: 10.1523/JNEUROSCI.3724-08.2008. [DOI] [PMC free article] [PubMed] [Google Scholar]
- MacAulay N, Zeuthen T. Water transport between CNS compartments: contributions of aquaporins and cotransporters. Neuroscience. 2010;168:941–956. doi: 10.1016/j.neuroscience.2009.09.016. [DOI] [PubMed] [Google Scholar]
- Mies G, Iijima T, Hossmann KA. Correlation between peri-infarct DC shifts and ischaemic neuronal damage in rat. Neuroreport. 1993;4:709–711. doi: 10.1097/00001756-199306000-00027. [DOI] [PubMed] [Google Scholar]
- Murphy TH, Li P, Betts K, Liu R. Two-photon imaging of stroke onset in vivo reveals that NMDA-receptor independent ischemic depolarization is the major cause of rapid reversible damage to dendrites and spines. J Neurosci. 2008;28:1756–1772. doi: 10.1523/JNEUROSCI.5128-07.2008. [DOI] [PMC free article] [PubMed] [Google Scholar]
- Nedergaard M. Spreading depression as a contributor to ischemic brain damage. Adv Neurol. 1996;71:75–83. [PubMed] [Google Scholar]
- Nishimura N, Schaffer CB, Friedman B, Tsai PS, Lyden PD, Kleinfeld D. Targeted insult to subsurface cortical blood vessels using ultrashort laser pulses: three models of stroke. Nat Methods. 2006;3:99–108. doi: 10.1038/nmeth844. [DOI] [PubMed] [Google Scholar]
- Obeidat AS, Jarvis CR, Andrew RD. Glutamate does not mediate acute neuronal damage after spreading depression induced by O2/glucose deprivation in the hippocampal slice. J Cereb Blood Flow Metab. 2000;20:412–422. doi: 10.1097/00004647-200002000-00024. [DOI] [PubMed] [Google Scholar]
- Obrenovitch TP. The ischaemic penumbra: twenty years on. Cerebrovasc Brain Metab Rev. 1995;7:297–323. [PubMed] [Google Scholar]
- Oliveira-Ferreira AI, Milakara D, Alam M, Jorks D, Major S, Hartings JA, Luckl J, Martus P, Graf R, Dohmen C, Bohner G, Woitzik J, Dreier JP Advance online publication. Experimental and preliminary clinical evidence of an ischemic zone with prolonged negative DC shifts surrounded by a normally perfused tissue belt with persistent electrocorticographic depression. J Cereb Blood Flow Metab. 2010 doi: 10.1038/jcbfm.2010.40. Advance online publication. Retrieved June 30, 2010. PubMed identification number: 20332797. [DOI] [PMC free article] [PubMed] [Google Scholar]
- Risher WC, Andrew RD, Kirov SA. Real-time passive volume responses of astrocytes to acute osmotic and ischemic stress in cortical slices and in vivo revealed by two-photon microscopy. Glia. 2009;57:207–221. doi: 10.1002/glia.20747. [DOI] [PMC free article] [PubMed] [Google Scholar]
- Schaffer CB, Friedman B, Nishimura N, Schroeder LF, Tsai PS, Ebner FF, Lyden PD, Kleinfeld D. Two-photon imaging of cortical surface microvessels reveals a robust redistribution in blood flow after vascular occlusion. PLoS Biol. 2006;4:e22. doi: 10.1371/journal.pbio.0040022. [DOI] [PMC free article] [PubMed] [Google Scholar]
- Shin HK, Dunn AK, Jones PB, Boas DA, Moskowitz MA, Ayata C. Vasoconstrictive neurovascular coupling during focal ischemic depolarizations. J Cereb Blood Flow Metab. 2006;26:1018–1030. doi: 10.1038/sj.jcbfm.9600252. [DOI] [PubMed] [Google Scholar]
- Sigler A, Goroshkov A, Murphy TH. Hardware and methodology for targeting single brain arterioles for photothrombotic stroke on an upright microscope. J Neurosci Methods. 2008;170:35–44. doi: 10.1016/j.jneumeth.2007.12.015. [DOI] [PubMed] [Google Scholar]
- Sigler A, Mohajerani MH, Murphy TH. Imaging rapid redistribution of sensory-evoked depolarization through existing cortical pathways after targeted stroke in mice. Proc Natl Acad Sci U S A. 2009;106:11759–11764. doi: 10.1073/pnas.0812695106. [DOI] [PMC free article] [PubMed] [Google Scholar]
- Somjen GG. Mechanisms of spreading depression and hypoxic spreading depression-like depolarization. Physiol Rev. 2001;81:1065–1096. doi: 10.1152/physrev.2001.81.3.1065. [DOI] [PubMed] [Google Scholar]
- Somjen GG. Ions in the brain: normal function, seizures, and stroke. New York: Oxford UP; 2004. [Google Scholar]
- Strong AJ, Dardis R. Depolarisation phenomena in traumatic and ischaemic brain injury. Adv Tech Stand Neurosurg. 2005;30:3–49. doi: 10.1007/3-211-27208-9_1. [DOI] [PubMed] [Google Scholar]
- Strong AJ, Anderson PJ, Watts HR, Virley DJ, Lloyd A, Irving EA, Nagafuji T, Ninomiya M, Nakamura H, Dunn AK, Graf R. Peri-infarct depolarizations lead to loss of perfusion in ischaemic gyrencephalic cerebral cortex. Brain. 2007;130:995–1008. doi: 10.1093/brain/awl392. [DOI] [PubMed] [Google Scholar]
- Takano T, Tian GF, Peng W, Lou N, Lovatt D, Hansen AJ, Kasischke KA, Nedergaard M. Cortical spreading depression causes and coincides with tissue hypoxia. Nat Neurosci. 2007;10:754–762. doi: 10.1038/nn1902. [DOI] [PubMed] [Google Scholar]
- Thompson RJ, Zhou N, MacVicar BA. Ischemia opens neuronal gap junction hemichannels. Science. 2006;312:924–927. doi: 10.1126/science.1126241. [DOI] [PubMed] [Google Scholar]
- Tom WJ, Ponticorvo A, Dunn AK. Efficient processing of laser speckle contrast images. IEEE Trans Med Imaging. 2008;27:1728–1738. doi: 10.1109/TMI.2008.925081. [DOI] [PubMed] [Google Scholar]
- Watson BD, Dietrich WD, Busto R, Wachtel MS, Ginsberg MD. Induction of reproducible brain infarction by photochemically initiated thrombosis. Ann Neurol. 1985;17:497–504. doi: 10.1002/ana.410170513. [DOI] [PubMed] [Google Scholar]
- Wester P, Watson BD, Prado R, Dietrich WD. A photothrombotic “ring” model of rat stroke-in-evolution displaying putative penumbral inversion. Stroke. 1995;26:444–450. doi: 10.1161/01.str.26.3.444. [DOI] [PubMed] [Google Scholar]
- Winship IR, Murphy TH. In vivo calcium imaging reveals functional rewiring of single somatosensory neurons after stroke. J Neurosci. 2008;28:6592–6606. doi: 10.1523/JNEUROSCI.0622-08.2008. [DOI] [PMC free article] [PubMed] [Google Scholar]
- Zhang S, Murphy TH. Imaging the impact of cortical microcirculation on synaptic structure and sensory-evoked hemodynamic responses in vivo. PLoS Biol. 2007;5:e119. doi: 10.1371/journal.pbio.0050119. [DOI] [PMC free article] [PubMed] [Google Scholar]
- Zhang S, Boyd J, Delaney K, Murphy TH. Rapid reversible changes in dendritic spine structure in vivo gated by the degree of ischemia. J Neurosci. 2005;25:5333–5338. doi: 10.1523/JNEUROSCI.1085-05.2005. [DOI] [PMC free article] [PubMed] [Google Scholar]