Abstract
Filter theory indicates that changes in cochlear filter bandwidths are accompanied by changes in cochlear response latencies. Previous reports indicate that otoacoustic emission (OAE) delays are reduced by exciting medial olivocochlear (MOC) efferents with contralateral broad-band noise (CBBN). These delay reductions are consistent with MOC-induced widening of cochlear filters. We quantified the MOC-induced changes in human cochlear-filter-related delays using stimulus-frequency and click-evoked OAEs (SFOAE and CEOAEs), recorded with and without MOC activity elicited by 60 dB SPL CBBN. MOC-induced delay changes were measured from the slopes of SFOAE phase functions and from cross-correlation of 500 Hz-wide CEOAE frequency-band waveform magnitudes. The delay changes measured from CEOAEs and SFOAEs were statistically indistinguishable. Both showed greater delay reductions at lower frequencies (a 5% decrease in the 0.5 – 2 kHz frequency region). These data indicate that cochlear filters are widened 5% by the MOC activity from moderate-level CBBN. Psychophysically, the large changes in cochlear response latencies, implied by the 0.5 ms change in OAE delay at low frequencies, would have a profound effect on binaural localization if they were not balanced in the central nervous system, or by the MOC system producing similar changes in both ears.
Keywords: Medial Olivocochlear, Efferent, Cochlear Filter, Otoacoustic Emission, Psychophysics, Delay, Human
1. Introduction
One of the fundamental properties of the auditory system is the ability to analyze sounds into different frequency components, a process usually conceptualized as being done by a bank of cochlear filters. The frequency resolving ability of the cochlea is determined by its filters’ bandwidths. However, cochlear filter bandwidths are not fixed. Indeed, their bandwidths increase at high sound levels as shown by tuning curves (TCs) from basilar-membrane (BM) motion or auditory-nerve (AN) responses (e.g. Temchin et al 2008). This happens because cochlear amplifier (CA) gain, which is greatest near the peak of the filter, decreases as sound level increases. CA gain is also decreased by stimulation of medial olivocochlear (MOC) efferent neurons (Guinan, 1996), so MOC activity would be expected to widen cochlear filters. In cats, Guinan and Gifford (1988) found that electrical MOC stimulation widened TCs for AN fibers with CFs greater than 2 kHz. Both increases and decreases in bandwidth were found for fibers with CFs less than 2 kHz. Contralateral acoustic stimulation (CAS) can also be used to elicit MOC activity that reduces CA gain and inhibits AN responses (Warren and Liberman, 1989a, b). Thus, CAS-elicited MOC activity would also be expected to widen cochlear filters.
Filter theory indicates that widening a filter produces a shorter impulse response (Oppenheim and Wilsky, 1997). Thus, widening cochlear filters would be expected to shorten cochlear response latencies. In humans, otoacoustic emissions (OAEs) provide a non-invasive measure of cochlear mechanical responses. Stimulus-frequency OAEs (SFOAEs) and click-evoked OAEs (CEOAEs) are both are thought to be produced by a single process, coherent reflection (Shera and Zweig, 1993), in which OAE delays are inversely related to cochlear filter bandwidths. Under this premise, an MOC-induced widening of cochlear filters should be seen as reduced CEOAE and SFOAE delays. Human distortion product OAE (DPOAE) delays are less suitable for inferring changes in cochlear filter bandwidths because they are the mixture of two components with different delays (Shera and Guinan, 1999; Kalluri and Shera, 2001; Withnell et al, 2008), and DPOAE phase-gradient delays are highly parameter dependent (Shera et al, 2000), which obscures measurement of MOC-induced changes in cochlear filter-related delays.
There are several reasons for being interested in the delays that MOC activity may produce in cochlear responses, aside from what these delays tell us about MOC-induced changes in cochlear filter bandwidths. First, interaural delay is one of the primary cues for sound localization and MOC-induced changes in cochlear response latencies may affect interaural delays. Second, human psychophysical frequency selectivity is not simply explained by cochlear filtering (Cedolin and Delgutte, 2005). The timing of AN responses also contains information about the frequency content of a sound. One theory hypothesizes that a cochlear traveling wave produces phase differences across AN fibers of different CFs and that these phase differences provide an important cue for resolving the frequency components in a complex sound (Shamma, 1985; Carney, 1992). An MOC-induced change in cochlear response latencies will affect these phase differences and may therefore affect cochlear frequency selectivity by changing the timing of AN responses, as well as by changing filter bandwidths.
There have been many previous studies of MOC effects on OAEs, but most reported only the change in OAE amplitudes and few reported MOC-induced changes in response phase or delay. Ryan et al (1991), Berlin et al (1993) and Giraud et al (1996; 1997) reported that CAS-elicited MOC activity decreased OAE delays, and perhaps more so at lower frequencies. In our study, we refined the OAE-based methodology to provide a more detailed and accurate description of MOC-induced OAE delay changes.
To quantitatively determine the changes in OAE delays produced by MOC activity, we measured SFOAE phase-gradient delays and CEOAE latencies, with and without MOC activity elicited by CAS. Since SFOAEs and CEOAEs are thought to be due to the same underlying mechanism (Shera and Guinan, 1999; Kalluri and Shera, 2007), they should show the same MOC-induced delay changes.
2. Materials and methods
2.1 Methods Overview
MOC-induced changes in OAE delays were calculated from the comparison of OAEs obtained with and without MOC activity elicited by contralateral noise. For SFOAEs, changes in cochlear delays were measured from the changes in phase-gradient delays obtained from the slopes of linear fits to SFOAE phase versus frequency data. For CEOAEs, changes in cochlear delays were measured by separating the click responses into 500 Hz-wide frequency regions, and in each frequency region, cross-correlating the CEOAE waveform magnitudes with and without MOC activity.
2.2 Stimuli and acoustics
To evoke SFOAEs, a 40 dB SPL, unilateral probe tone was presented continuously in the test (ipsilateral) ear. Ear-canal sound pressure was averaged over 5.3 s repeated time periods called “trials”. In each trial, there was an initial 500 ms with the probe-tone alone to provide a “baseline,” (see below) followed by the concurrent presentation of a 2.5 s MOC elicitor, which was a 60 dB SPL broadband noise in the contralateral ear. Starting 600 ms before the end of the trial, a 500 ms, 55 dB SPL suppressor tone, 50 Hz higher in frequency than the SFOAE probe tone, was presented to the ipsilateral ear (see below). Both the elicitor and the suppressor were alternated in polarity across trials so their acoustic waveforms (but not their effects) would cancel in averages. We refer to the sequential presentation of trials with opposite polarity stimuli as, “alternations.” To provide data from which phase-gradient delays could be calculated, SFOAE measurements were done at 3–7 probe tone frequencies, spaced 20 Hz apart, in a random order. We averaged ear-canal response waveforms in sets of 8 trials (4 alternations) per probe-tone frequency. We refer to a set of trials that was averaged as a, “recording block.” The number of recording blocks for each phase-gradient delay measurement varied, depending upon subject availability and the number of probe-tones in a frequency group, but on average there were 7 recording blocks for each phase-gradient delay measurement. For each subject, the SFOAE test frequencies were selected by initially obtaining CEOAE data and then choosing frequencies at CEOAE spectral peaks with large signal-to-noise ratios (SNRs). Frequencies within 50 Hz of a spontaneous OAE (SOAE) greater than −10 dB SPL were not used in order to avoid unintended acoustic interactions within the cochlea.
To evoke CEOAEs, 100 μs clicks were presented at 50 dB pSPL and a rate of 40 Hz. 40 Hz was used (instead of the standard 50 Hz) to reduce unintended MOC activity elicited by the clicks (Veuillet et al, 1991; Guinan et al 2003). The ear canal sound pressure was digitally sampled at 100 kHz (to enhance temporal accuracy) and responses were averaged in 500 ms repeated time periods or “trials.” The responses in the first trial period were omitted (to allow time for build up or decay of the MOC effect) and then 128 trials were averaged (called a “block”). After averaging, each block was divided into the 25 ms segments containing the CEOAEs. These segments were averaged, so that a block average contained 2560 CEOAEs. Typically, three blocks without the CAS elicitor and three interleaved blocks with the CAS elicitor were averaged for each ear. This resulted (typically) in 7680 CEOAEs averaged per CAS condition. We averaged this large number of responses to maximize CEOAE SNRs. To obtain a noise floor, the same number of trials were averaged without any sound.
For all experiments, various tests were done to ensure that the recorded changes were due to MOC effects. Data collection trials containing large response artifacts due to subject movement were excluded before averaging. Post-averaging processing included further rejection of averages containing abnormally large transient responses missed during online artifact rejection, and averages in which ear-canal pressure showed large differences between the beginning and end of a trial. For each ear, a suppressed-SFOAE middle-ear muscle (MEM) test was done (Lilaonitkul and Guinan, 2009a). These tests did not show any MEM contractions produced by the CAS MOC elicitor for any subject. Although click-trains can elicit MEM contractions, a 40 Hz rate and 50 dB pSPL level are most likely too slow and low-level to elicit substantial MEM activation (Guinan et al, 2003).
Ear-canal sound pressure was recorded using Etymotic Research ER10c acoustic assemblies in each ear. The outputs from the two ER10c acoustic sources were calibrated in each ear at the beginning and frequently throughout each recording session. Each acoustic stimulus was produced by a separate earphone to avoid non-linear stimulus interactions in an earphone. The broadband noise (0.1–10 kHz) used to elicit MOC activity was spectrally flattened in each subject using in-ear acoustic calibrations.
2.3 Subjects
Experiments were performed on human subjects with audiogram thresholds at octave frequencies from 0.5 to 8 kHz that were not higher than 10 dB re: ANSI standard for tones. Subjects were aged 20–39 years, with a mean age of 24 years. SFOAEs were recorded from all 24 subjects (10 male). Twenty-one of these subjects (10 male) were also used in the CEOAE experiments. For the three remaining subjects, CEOAEs did not pass the SNR criteria.
2.4 SFOAE analysis
For SFOAE measurements, the ear-canal sound pressure was digitally sampled at 25 kHz and the sound at the probe-tone frequency was obtained by heterodyning. Heterodyning was done by (1) Fast Fourier Transforming (FFT) the ear-canal sound pressure waveform, (2) Shifting a range of the spectrum that was centered around the probe frequency so that it was centered around 0 Hz, and (3) low-pass filtering the result (see Guinan et al, 2003 for more detail). The net effect of heterodyning is to obtain the magnitude and phase of the probe-tone component of the response, as functions of time, as would be done similarly by a lockin amplifier.
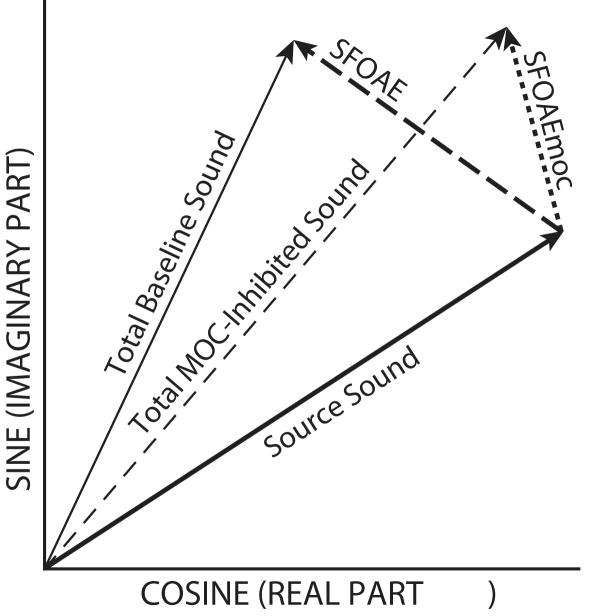
To illustrate the relationship of the probe-frequency ear-canal sound pressure to the sound source and SFOAE components that produce it, the amplitudes and phases of these components are represented in a vector diagram in Figure 1. The sound from the source and the SFOAE sum to produce the total baseline sound pressure (the thin solid line in Figure 1). The baseline sound is the sound before the contralateral elicitor is turned on. When the contralateral elicitor is turned on, the MOC activity changes the SFOAE, resulting in a new SFOAE vector labeled, SFOAEmoc, in Figure 1, and a new total sound pressure labeled, Total MOC-inhibited Sound. When the ipsilateral suppressor tone is turned on, the SFOAE is suppressed so that the ear canal sound pressure at the probe frequency is due to the sound source alone. From measurements in these three conditions: (1) the baseline ear-canal pressure, (2) ear-canal pressure with MOC inhibition, and (3) the sound source during SFOAE suppression, we calculated: SFOAE = Total Baseline sound minus Source Sound, and SFOAEmoc = Total MOC-inhibited sound minus Source Sound, as indicated by the vectors in Fig. 1. In actuality, the ear-canal sound pressure changed continually with time between the three conditions: the baseline, MOC-inhibited and suppressed-SFOAE ear-canal sound pressures were measured from vector averages of the data points from appropriate time windows during the recordings of ear-canal sound pressure. The baseline sound is the vector average of the points in a 400 ms window beginning 50 ms after the trial onset, the MOC-inhibited sound is the average from a 400 ms window ending 50 ms before the elicitor offset, and the sound-source is the average from a 200 ms window starting 50 ms after the onset of the suppressor tone.
Figure 1.
Vector representation of ear-canal sound-pressure components during a stimulus frequency otoacoustic emission (SFOAE) measurement. The total baseline sound is the sum of the source sound (thick solid line) and the SFOAE (thick dashed line). The total MOC-inhibited ear-canal sound (thin dashed line) is the sum of the source sound and the SFOAEmoc (thick dotted line) which is the SFOAE during medial olivocochlear (MOC) activity.
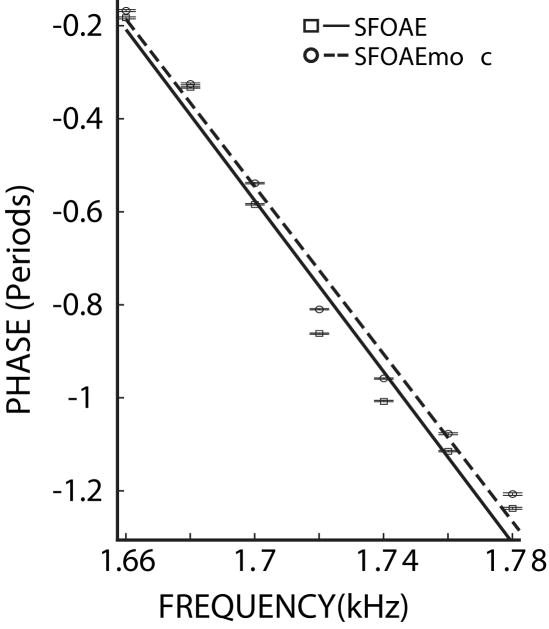
To calculate phase-gradient delays, the first step was to unwrap the phases of each set of nearby frequencies of the SFOAE or SFOAEmoc measurements. The 20-Hz spacing between each of the 3–7 frequencies of each set insured that the phase jumps would be less than 180 degrees so that the phase unwrapping was unambiguous. The phase-gradient delays were obtained from the slopes of linear fits to the phase-versus-frequency data (e.g. Fig. 2). Although the data in Figure 2 show systematic deviations from the linear fit, these deviations were different in each set of phases so that using a higher-order model to provide a better fit does not seem warranted. The linear fits captured the overall trends in the phases (SFOAE: R2 = 0.97, SFOAEmoc: R2 = 0.98). Phase points were included only if their corresponding magnitude was at least 15 dB above the noise floor and their vector strengths were greater than 0.95 (indicating near-uniform phase measurements). Vector strengths were computed from the response phases of each time point in a measurement window by assigning the phases to unity-magnitude vectors, and then taking the magnitude of the sum of the vectors (Goldberg and Brown, 1969). After subtraction of the mean total baseline pressure (Fig. 1) from the heterodyned waveforms, noise floors were calculated using a 400 ms window when only the probe tone was present.
Figure 2.
SFOAE phase versus frequency plots without (□, solid line) and with (○, dashed line) MOC activity elicited by 60 dB SPL contralateral noise. The lines are linear fits to the data. The error bars (two horizontal lines at each point that are mostly indistinguishable) indicate the mean +/− two standard errors. The phase-gradient delay is the negative of the slopes of the linear fits, and is 9.2 ms for SFOAE and 9.0 ms for SFOAEmoc. Subject 208.
2.5 CEOAE analysis
The CEOAE recordings were time-windowed from 2–25 ms (to remove the click acoustic waveforms) with the first and last 2 ms within the window shaped by a raised cosine to minimize abrupt on-off transitions that blur frequency content. The CEOAEs were then high-pass filtered at 0.2 kHz using a Kaiser filter. The overall CEOAE spectra were obtained from the resulting waveforms by FFTs.
To obtain the time-dependence of the CEOAE magnitudes in 500 Hz-wide frequency regions, we used the short-time Fourier transform (STFT). Our STFT time-window was the impulse response of a low-pass Kaiser filter. The filter’s pass-band edge was specified as 250 Hz so that its bandwidth was 500 Hz after modulation to higher frequencies in the STFT. The 500 Hz bandwidths were chosen to allow comparison with previous studies. Changing the bandwidth did not significantly change the results. Window modulations were chosen as the center frequencies of 500 Hz-wide frequency regions (0.75 kHz, 1.25 kHz, 1.75 kHz, 2.25 kHz, 2.75 kHz, 3.25 kHz, 3.75 kHz, 4.25 kHz, 4.75 kHz, 5.25 kHz). The data in CEOAE figures are labeled accordingly. This STFT implementation can be thought of as a complex-valued filter-bank, where each channel tracks the STFT output for a band of frequencies (Oppenheim and Schafer, 1999). The magnitude of the complex output from each channel of our filter-bank would have the same magnitude of the Hilbert transform of a signal convolved with a real-valued impulse-response having the same Fourier transform magnitude (though at positive and negative frequencies) as our complex-valued filters. STFTs were also taken of the noise floor measurements. A frequency-band’s data were kept if its root-mean-squared (RMS) SNR was greater than 6 dB and no SOAEs were present in that frequency region.
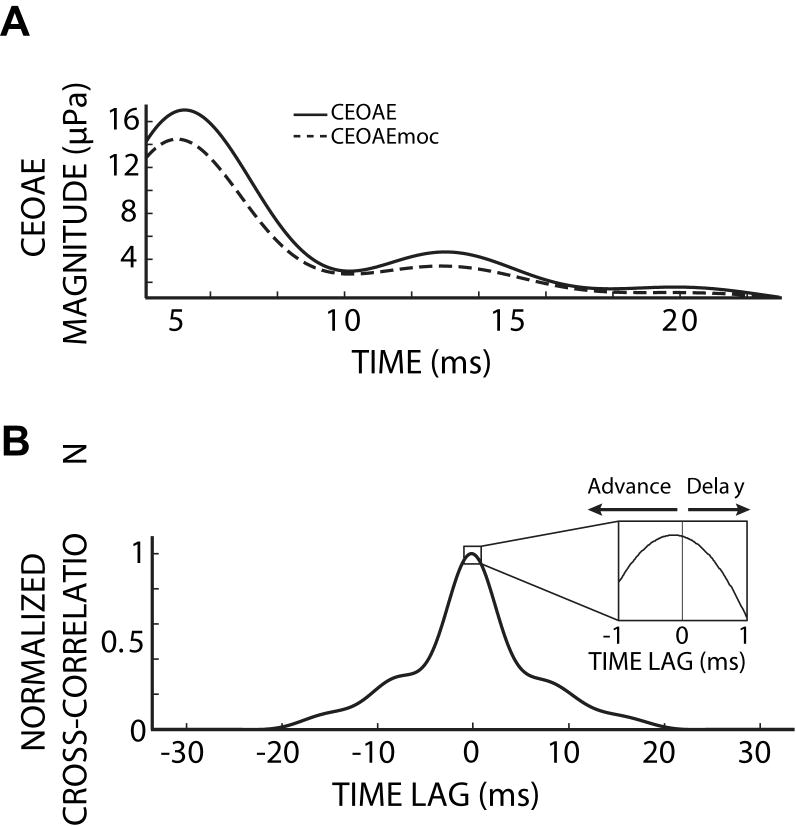
CEOAE latency changes were determined by evaluating cross-correlation functions of corresponding CEOAE and CEOAEmoc (CEOAE with MOC stimulation) frequency-band waveform envelopes. The time-lag of the cross-correlation function peak was taken as the latency change because the peak represents when the CEOAE and CEOAEmoc are best aligned in time (e.g. Fig. 3). Envelopes for each frequency band were extracted by low-pass filtering the frequency-band magnitudes using a Kaiser filter with a pass-band edge at 100 Hz. Figure 3A shows the CEOAE and CEOAEmoc envelopes from the 3.25 kHz bin of an example subject. Figure 3B shows the cross-correlation function of the CEOAE and CEOAEmoc envelopes. The cross-correlation function is generated by (1) shifting the CEOAEmoc envelope in discrete time steps across the duration of the CEOAE envelope, (2) point-wise multiplication of the envelopes at each time step (i.e. each time-lag in Fig. 3) and (3) summing the multiplied envelope points for each time-lag. The inset in figure 3B details the time-lag of the cross-correlation function peak, which is at a negative time-lag, indicating that the CEOAEmoc envelope was advanced in time relative to the CEOAE envelope. CEOAE latencies without MOC stimulation were taken from the time of the envelope peak in each CEOAE frequency region (Tognola, 1997; Sisto et al, 2007).
Figure 3.
CEOAE envelopes without (solid) and with (dashed) MOC activity elicited by 60 dB SPL contralateral noise (A), and their normalized cross-correlation function (B). The inset in (B) shows the peak at a negative time-lag, i.e. CEOAEmoc was advanced (re: CEOAE). Subject 268.
The wavelet transform (WT) was also used for analysis because it can provide better time-frequency resolution than STFTs (Tognola et al, 1998). The difference in our results between the two transforms was negligible when applied to the CEOAEs. Since our STFT implementation allowed better control of which frequencies contributed to a latency measurement, we report the STFT results here. For the WT, the mother wavelet was a windowed cosine as in previous papers (e.g. Wit et al, 1994; Tognola 1997 and 1998; Sisto et al, 2007). Dilated versions of the mother wavelet, the daughter wavelets, were obtained through downsampling in a dyadic scheme. Daughter wavelets covered the frequency axis between 0.5 – 5.5 kHz. Aliasing from downsampling was minimized because of our 100 kHz sampling rate and the band-pass nature of the mother wavelet. CEOAE frequency-band waveforms were obtained by taking a weighted sum of the transform coefficients in 500 Hz-wide frequency regions between 0.5 – 5.5 kHz (Torrence and Compo, 1998).
Analysis of variance (ANOVA) with a Bonferroni correction for multiple comparisons was used for testing differences between otoacoustic emission types and frequency regions. All parts of this study were performed in accordance with MEEI, MIT and NIH guidelines for human studies.
3. Results
3.1 SFOAE results
Phase-gradient delays, with and without MOC activity elicited by contralateral broad-band noise, were obtained from SFOAE phase measurements done in sets of several closely spaced frequencies. Example phase versus frequency plots for SFOAEs and for SFOAEs during MOC stimulation (SFOAEmoc) are shown in Figure 2. Each data point is the average phase measurement of a single SFOAE from one subject’s ear. The slopes of the linear fits to the data in this example show phase-gradient delays of 9.2 ms and 9.0 ms for SFOAE and SFOAEmoc measurements, respectively, indicating that MOC activity reduced the delay.
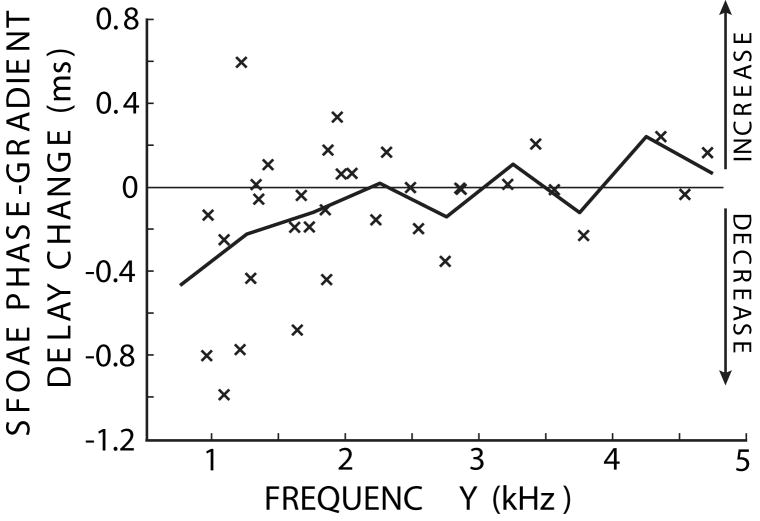
All of the measured MOC-induced changes in phase-gradient delays are shown in Figure 4. Below 2 kHz, most of the data show reductions of the phase-gradient delays, though not at a statistically significant level when the data were grouped into the 500 Hz frequency bands (t-test, 0.2<p<0.4). Above 2 kHz the data are spread around zero, so that no significant MOC effect on SFOAE phase-gradient delays was detected (t-test, 0.1<p<0.8). The 4.25 kHz region contains only one point and the 5.25 kHz region has no points. Note, however, that above 2 kHz, the phase-gradient delays are sparsely sampled. This is because few subjects had large SFOAEs at high frequencies and, in general, there were low SNRs in this region.
Figure 4.
Changes in SFOAE phase-gradient delays due to MOC activity elicited by 60 dB SPL contralateral noise. x’s show the changes for one set of SFOAE frequencies in one ear. The thick line connects the mean values in the 500 Hz-wide frequency regions.
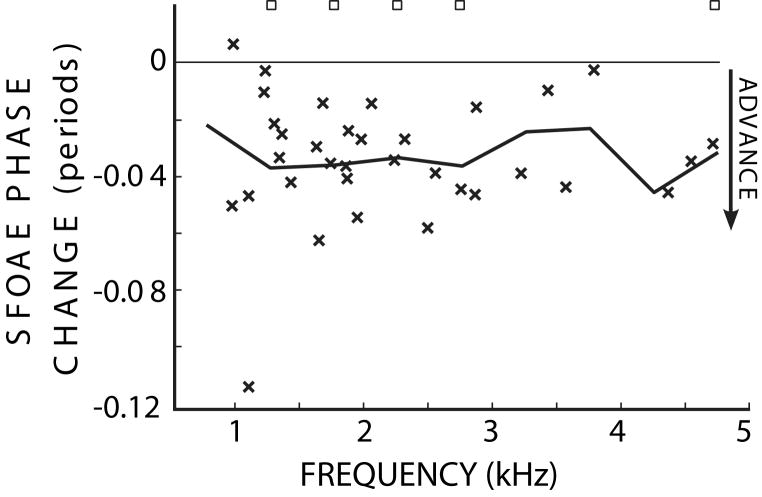
In contrast to the MOC-induced changes in SFOAE phase-gradient delays which did not reach significance, MOC activity produced significant and consistent changes in SFOAE phase. The phase change was obtained by averaging the changes at each set of the closely spaced frequencies used for the phase-gradient delay measurements (e.g. the points in figure 2). In all but one case, the data show MOC-induced phase advances (Fig. 5). The means of the phase advances varied from .02 to .045 periods across the frequency regions and were significantly different than 0 for the 1.25, 1.75, 2.25, 2.75 and 4.75 kHz frequency regions (t-test, p<0.05).
Figure 5.
The changes in SFOAE phase (x’s) due to MOC activity elicited by 60 dB SPL contralateral noise. The thick line connects the mean values in the 500 Hz-wide frequency regions. Squares indicate frequency-region means that were significantly different from zero (t-test: p<0.05).
3.2 CEOAE results
In an attempt to get more extensive results than with the SFOAE method, and perhaps to achieve statistical significance, we measured MOC-induced changes in CEOAEs. CEOAEs provide information at many frequencies simultaneously, and by averaging data across ears we might achieve greater accuracy than was obtained with SFOAEs. Kalluri and Shera (2007) demonstrated through spectral similarities that SFOAEs and CEOAEs are similarly generated, but they did not compare OAE delays. Our measurement of whether SFOAEs and CEOAEs yield the same MOC-induced delay changes tests their hypothesized equivalence in a new way.
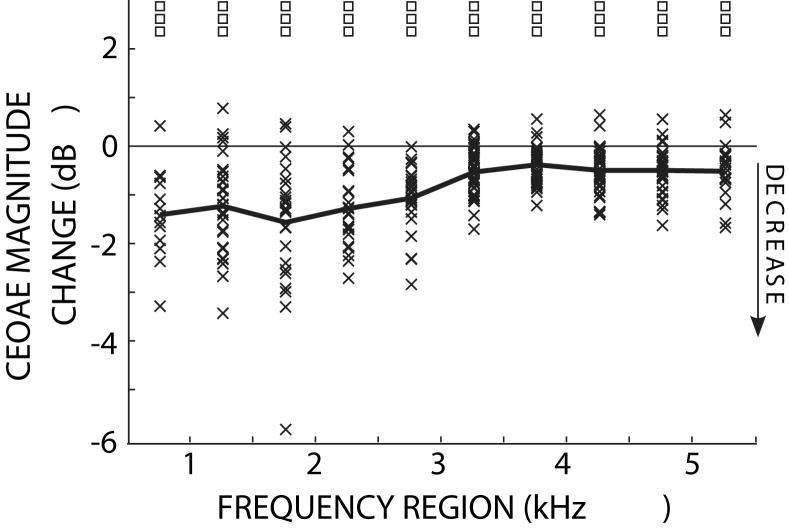
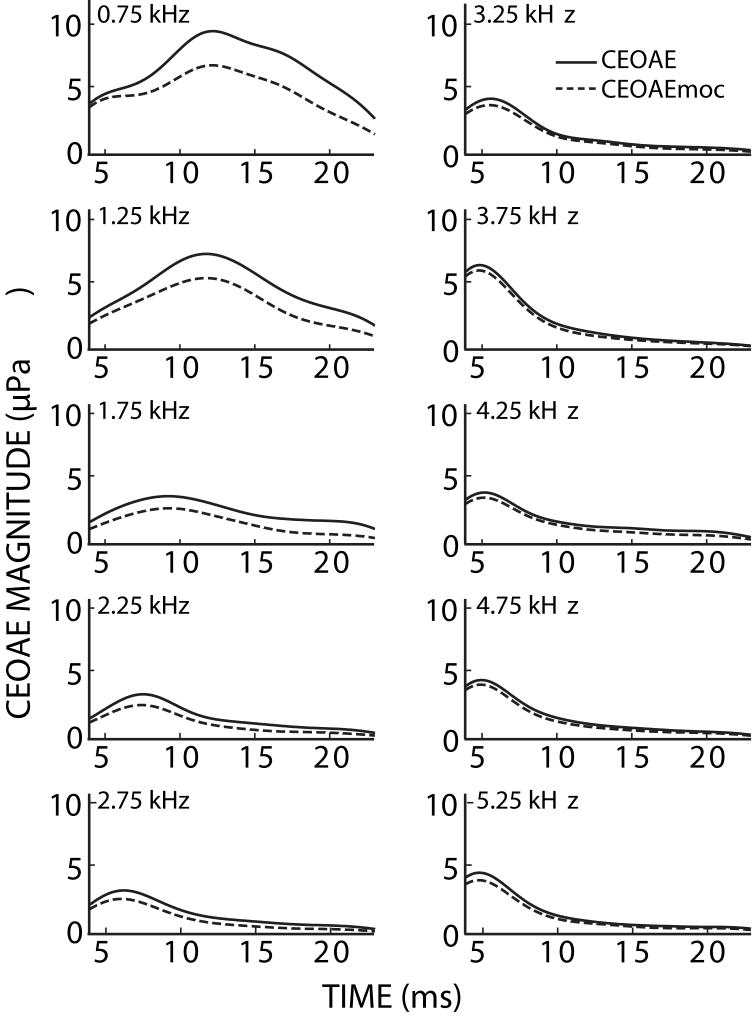
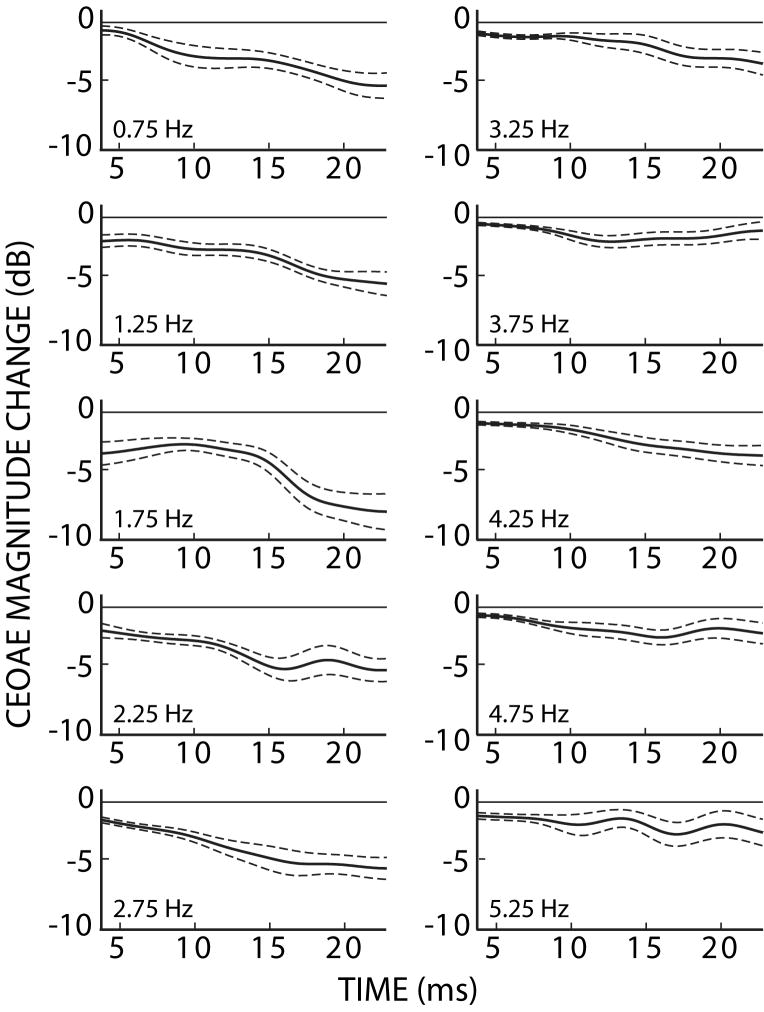
To understand the time and frequency dependence of MOC effects, CEOAEs and CEOAEmocs were analyzed into 500-Hz-wide frequency regions (see Methods). MOC activity significantly reduced CEOAE magnitudes across the range of analyzed frequencies (t-test, p<0.001), with the largest changes at low frequencies (Fig. 6). Frequency-region waveform magnitudes (envelopes), averaged across subjects, are shown in Figure 7. In all of the frequency regions, and at all times, the average CEOAE response with MOC stimulation was less than that without MOC stimulation, i.e. MOC stimulation inhibited the CEOAEs. Figure 8 shows the time-dependence of the more common way in which CEOAE magnitude changes are described, i.e., MOC-inhibition of CEOAEs in dB relative to the CEOAE without contralateral noise. In general, MOC activity reduced CEOAEs more, on a relative scale, toward the end of the response, and at low-to-mid frequencies. However, the largest absolute MOC-induced changes were at low frequencies and at latencies closer to the waveform magnitude peak (Fig. 7). This indicates that quantification of overall CEOAE waveform-magnitude changes in a given frequency-band are largely determined by changes near the waveform peak, when the effects are measured from differences between CEOAE and CEOAEmoc.
Figure 6.
Click-evoked otoacoustic emission (CEOAE) magnitude changes due to MOC activity elicited by 60 dB SPL contralateral noise. x’s show the changes (dB re: CEOAE without MOC stimulation) in each frequency region for each ear. The thick line connects the mean values in the 500 Hz-wide frequency regions. Squares indicate frequency-region means that were significantly different from zero (t-test: p<0.001).
Figure 7.
CEOAE magnitudes with (dashed) and without (solid) MOC activity elicited by 60 dB SPL contralateral noise. CEOAE responses were separated into 500 Hz-wide frequency regions and averaged across 42 ears (see Methods). Numbers at upper left in each panel are the center frequency of the region.
Figure 8.
CEOAE magnitude changes (dB re: CEOAE without MOC stimulation) due to MOC activity elicited by 60 dB SPL contralateral noise. Numbers at lower left in each panel are the center frequency of the 500 Hz-wide frequency regions. Dashed lines indicate one standard error of the mean.
3.3 CEOAE latency changes
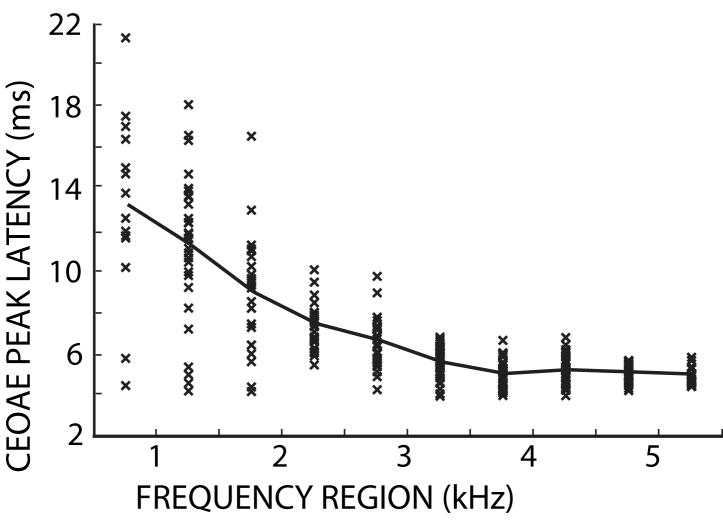
To obtain a metric for the MOC-induced change in CEOAE latency, we could measure the change in the latency at the CEOAE magnitude peak without versus with MOC stimulation by contralateral sound. However, we found that measurements depending upon a change in the peak of the response due to MOC stimulation, a single point, are highly subject to error from noise and other idiosyncrasies in individual measurements. Figure 9 shows CEOAE peak-latencies without MOC stimulation. This figure illustrates the scatter in the peak data. Similar, but uncorrelated scatter was found with MOC stimulation. Because of this scatter, we did not use a method based on the CEOAE peak magnitudes to calculate changes in CEOAE latencies.
Figure 9.
The CEOAE peak latency (without MOC stimulation) as a function of frequency region. x’s show data from each ear. The thick line connects the mean values in the 500 Hz-wide frequency regions.
We calculated the MOC-induced changes in CEOAE latencies from cross-correlation functions evaluated using the CEOAE and CEOAEmoc waveform magnitudes in each 500 Hz frequency region (see Methods). This method takes into account changes throughout the CEOAE waveform. The cross-correlation function peak indicates the CEOAE latency change. This analysis showed statistically-significant MOC-induced decreases in CEOAE latency for almost all frequency regions, i.e. the CEOAE responses most often occurred earlier in time with MOC stimulation (Fig. 10).
Figure 10.
CEOAE latency changes determined by cross-correlation. x’s show the changes in each ear due to MOC activity elicited by 60 dB SPL contralateral noise. The thick line connects the mean values in the 500 Hz-wide frequency regions. Squares indicate frequency region means that were significantly different from zero (t-test: two squares = p<0.01, three squares = p<.001).
3.4 Comparison of OAE delay changes
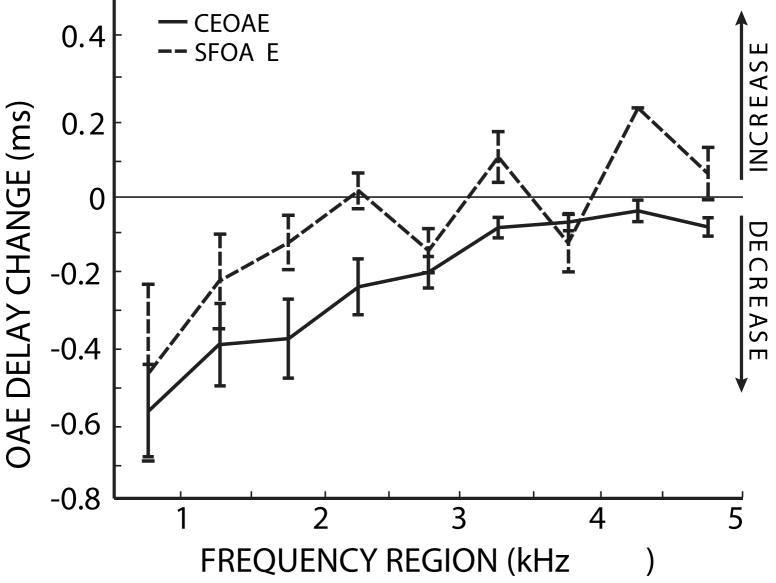
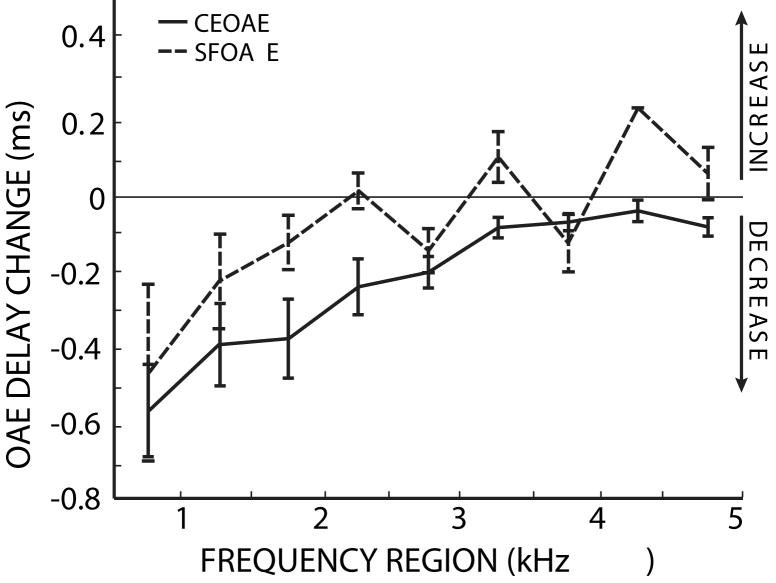
The MOC-induced changes in SFOAE phase-gradient delays and CEOAE latencies are shown together in Figure 11. While there were no significant SFOAE phase-gradient delay changes, both measures agree in showing larger MOC-induced decreases at low frequencies than at high frequencies. There was no significant difference between the two emission distributions (ANOVA, F=2.78, p=0.12). Additionally, no significant difference was found between emission types for each frequency bin using a t-test (p>0.05), but since we are interested in capturing the similar frequency dependence of the SFOAE and CEOAE delay changes, the ANOVA result is more relevant. Across the frequency regions, the two measures are highly correlated (R= 0.85, p<0.01). These data indicate that there are similar MOC-induced changes in SFOAE phase-gradient delays and CEOAE latencies.
Figure 11.
SFOAE and CEOAE delay changes are both larger at low frequencies. The lines show the changes in SFOAE (dotted) and CEOAE (solid) delays due to MOC activity elicited by 60 dB SPL contralateral noise. Error bars indicate one standard error of the mean. The 4.25 kHz SFOAE bin contains only one data point. There was not a significant difference between the distributions based on OAE type (ANOVA: F= 2.78, p=0.12).
4. Discussion
4.1 MOC-induced changes in OAE delays
The MOC-induced changes in the delays measured from CEOAEs and SFOAEs were statistically indistinguishable and both showed greater changes at lower frequencies (Fig. 11). The similarity of the results from two different methods provides additional confidence in the measurements. These results confirm in a new way that SFOAEs and CEOAEs provide similar information about cochlear mechanical responses. However, it must be kept in mind that the two measures are not simple equivalents. For example, we did not equate the sound levels reaching each cochlear filter for CEOAEs versus SFOAES (see Kalluri and Shera, 2007). Since input level affects cochlear filter bandwidths, latencies and the magnitude of MOC-inhibition, it might also affect the MOC-induced change in cochlear latency. This difference, and other unknown mechanisms, may be why MOC-induced CEOAE latency changes are, on average, slightly larger than the SFOAE phase-gradient delay changes. However, there are few SFOAE points per 500 Hz frequency region and the difference between the CEOAE and SFOAE measures is not statistically significant.
The MOC-induced advance of SFOAE phase (Fig. 5) is an interesting feature of the data that is not fully understood. It seems likely that the SFOAE phase advance is due to the same underlying causes as the MOC-induced phase advance in BM motion responses for low-level tones near the cochlear best frequency, i.e. the reduction of a delay produced by cochlear amplification (Guinan and Cooper, 2003; Cooper and Guinan 2006). It remains to be elucidated exactly why the MOC-induced phase advance remains somewhat constant across frequency (Fig. 5) while MOC effects on other quantities vary considerably with frequency (Figs. 4, 6, 10). Note that if the phase change is expressed as a time change, it looks similar to the data in figure 4, except it is 1/10th as large.
4.2 MOC-induced changes in OAE delay: implications for changes in cochlear filter bandwidths
To convert the measured MOC-induced changes in OAE delays to changes in cochlear filter bandwidths we need to know how much of the OAE delay is due to cochlear-filter build up time and how much is due to other delays. The partitioning of OAE delays into traveling wave signal-front delay and cochlear filter build-up time remains debatable, but an argument can be made that the total OAE delay is almost entirely due to cochlear filter build-up time (see de Boer, 1979, 1996 and 1997). Additionally, at the frequencies used here, there is only a very small OAE delay due to travel through the middle ear and for the fast pressure wave to travel along the cochlea (Patuzzi, 1996; Puria and Allen, 1998). Furthermore, according to the theory of coherent reflection the forward and backward cochlear “travel times” are largely attributable to cochlear filter properties (Zweig and Shera, 1995).
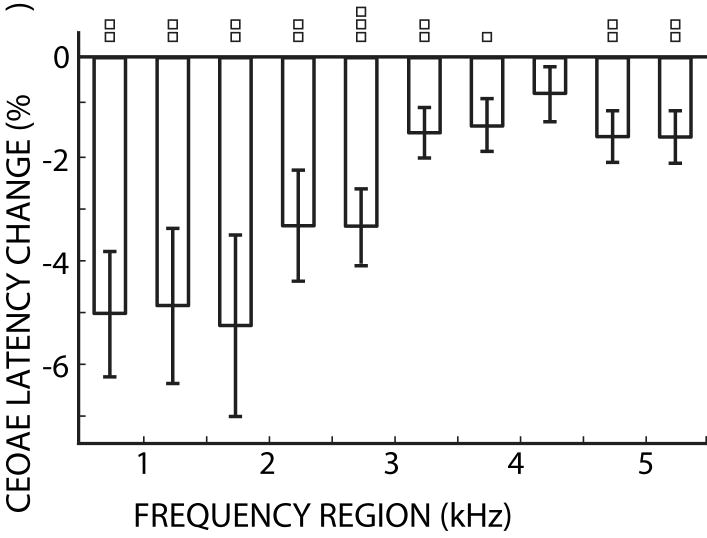
Another consideration is that the proportionality between OAE delay and cochlear-filter bandwidth is not agreed upon (Shera et al 2002; Ruggero and Temchin, 2005 and 2007). However, this proportionality constant is removed by expressing the MOC-induced changes as the ratio of the change to the original value. We calculated this ratio using the CEOAE data, which showed significant latency changes, and express the latency changes as a percentage change relative to the baseline CEOAE latency. That is, the changes in the CEOAE latencies (Fig. 10) were divided by the CEOAE peak latency without MOC stimulation (Fig. 9) and the result is given in Figure 12. The data in Figure 12 indicate that the response latencies of cochlear filters between 0.5 – 2 kHz are decreased approximately 5% by MOC activity, and that the percentage decrease becomes less as frequency increases. Thus, the 5% decrease in CEOAE latencies between 0.5 – 2 kHz indicates a 5% widening of cochlear filters in this region. If, on the other hand, the traveling wave signal-front delay is a significant part of the OAE delay (and presuming it is not affected by MOC activation), then the change in bandwidth in the 0.5 – 2 kHz frequency regions would be more than 5% (i.e. the latency change is divided by a reference latency that is less than the whole OAE latency in figure 9). Additional support for the correspondence of changes in cochlear filter bandwidths and cochlear delays is the finding that subjects who have wider psychophysical tuning curves have shorter latencies in their derived-band auditory brainstem responses (Strelcyk et al, 2009).
Figure 12.
Percent change in CEOAE latencies due to 60 dB SPL contralateral noise. Error bars indicate one standard error of the mean. Squares indicate frequency region means that were significantly different from zero (t-test: one square = p<0.05, two squares = p<0.01, three squares = p<0.001).
4.3 Comparison with previous measurements of MOC-induced OAE amplitude inhibition
Before comparing our measurements of MOC effects on OAE delays with those in the literature, we note that the MOC inhibition of OAEs reported here is similar to the inhibition reported previously. For SFOAEs, we used basically the same methods as previous reports of MOC effects on SFOAEs (Guinan et al 2003; Backus and Guinan, 2006, 2007; Lilaonitkul and Guinan, 2009a,b), and our SFOAE amplitude changes (not shown) are consistent with theirs. CAS-elicited MOC inhibition of CEOAEs was studied in many previous papers (e.g. Veuillet et al, 1991, 1996; Berlin et al, 1993, 1995; Hood et al,1996; Morand et al 2000). We do not include results using the “nonlinear CEOAE” method of Bray and Kemp (1987) because this method cancels out the majority of the CEOAE and it is unclear how to interpret the MOC-effects on the remainder of the emission. We found 1.87 dB ±1.25 dB RMS MOC inhibition of the overall CEOAE, which is consistent with previous reports using the linear CEOAE method.
Several studies analyzed the MOC inhibition of CEOAEs according to CEOAE frequency region and/or the time after the click, and found that MOC effects (measured as a dB change from the CEOAE without CAS) are greatest at low frequencies (1–2 kHz) and that MOC inhibition increases with time after the click (Berlin et al 1993, 1995; Morand et al 2000). By considering the joint dependence of these two variables, we show that MOC inhibition continues to increase with time after the click, up to 23 ms (Fig. 8) in both high and low frequency regions. This growth of MOC inhibition with time after the click is similar to the MOC inhibition of BM click responses and is directly attributable to the MOC-reduction in CA gain (Guinan and Cooper, 2008).
4.4 Comparison with previous measurements of MOC-induced OAE delay changes
Only two previous studies attempted to quantify the MOC-induced reductions in OAE latencies or phase. Giraud et al (1996) measured MOC-induced latency changes in CEOAEs using two different metrics: CEOAE and CEOAEmoc phase coherence, and a quantized latency change (the “phase-shift effect”), with unit change defined by the digital sampling rate. The phase coherence metric cannot be converted to actual changes in CEOAE latencies, and so it is not comparable to our results. The phase-shifts found by Giraud et al (1996) did have a similar frequency dependence to those we observed, although the size of the phase-shift changes were much smaller. Giraud et al (1997) measured MOC-induced changes in DPOAE phase gradients by holding F1 fixed and varying F2, and interpreted the resulting phase-gradient as showing DPOAE delays. However, Shera et al (2000) showed that DPOAE phase-gradients obtained in this way are determined by the DPOAE stimulus parameters such that the results are not generally comparable with SFOAE phase-gradients or CEOAE latencies. Another confound is that human DPOAEs are the sum of two components that have different delays (Shera and Guinan, 1999) and Giraud et al’s (1997) methods did not separate the contributions of the components. Nonetheless, it is worth noting that the results obtained by Giraud et al (1997) are similar to ours, i.e. they found the largest changes at low frequencies and the changes in cochlear response latency are similar, to the extent of being within the error of the delay changes we have observed.
4.5 Comparison with previous measurements of MOC-induced changes in cochlear filter bandwidths
Work on animals provides direct measurements of MOC influences on cochlear filter bandwidths. On cats, Guinan and Gifford (1988c) elicited MOC activity by brainstem electrical shocks and found that TCs became wider for AN fibers with CFs greater than 2 kHz and that both increases and decreases in bandwidth were found for fibers with CFs less than 2 kHz. For BM motion in the 16–20 kHz frequency region of guinea pigs, electrical MOC stimulation widened the TCs, particularly on the lower-frequency edge (Murugasu and Russell, 1996; Dolan et al 1997; Guinan and Cooper, 2003; Cooper and Guinan, 2006). However, for above-CF tones at very high sound levels, MOC stimulation made BM TCs narrower (Dolan et al 1997; Guinan and Cooper, 2003). This effect appears to be due to the interaction of two out-of-phase mechanical drives with one inhibited more than the other (Guinan and Cooper, 2003). These drives are due to two different vibrational modes of the organ of Corti, and it is not known if both of these mechanical drives are coupled to inner hair cell stereocilia and affect AN firing. To translate these results to humans, note that the range of human hearing is an octave, or more, lower than that of cats and guinea pigs. Overall, the animal results consistently indicate a predominant trend for MOC efferents to widen cochlear filters.
Several papers reported the effects of CAS-elicited MOC activity on human psychophysical tuning curves (pTCs) (Kawase et al 2000; Quaranta et al 2005; Vinay and Moore, 2008). These papers report that MOC activity produced wider pTCs for probe frequencies of 2 and 4 kHz and narrower pTCs for probe frequencies of 0.5 and 1 kHz. However, the patterns found were not simple and often showed different effects on the upper versus the lower limb of the pTCs. Furthermore, in contrast to MOC effects on physiological TCs measured in animals, the thresholds at the tips of the pTCs were changed very little by CAS-elicited MOC activity. This is probably because the MOC activity inhibited both the probe and masker responses, which points out the difficulty in interpreting these data. There are complex interactions among the three stimuli used in these experiments. CAS-elicited MOC activity reduces both masker and the probe responses, but the masker, particularly when it is at high levels at the edges of the pTCs, also elicits MOC activity which can affect both the probe response and the amount of CAS-elicited MOC activity. In addition, each of these MOC effects will have a frequency dependence that is not necessarily centered at the frequency of the sound that elicits the MOC activity (Lilaonitkul and Guinan, 2009a). Because of these complicated interactions, current reports of MOC effects on pTCs do not give a clear picture of MOC effects on cochlear filter bandwidths in humans.
4.6 Significance of the changes in cochlear response latencies to psychophysical pitch judgements
The MOC-induced change in cochlear delays might affect auditory frequency analysis in more ways than just by indicating a change in cochlear filter bandwidths. Two cues are commonly thought to provide the basis for psychophysical pitch judgments of tones: (1) the cochlear place at which the response is greatest, and (2) phase locking of the neural response. However, even in combination, these may not accurately account for the robustness of human psychophysical pitch judgments across sounds of various tonal complexity (Cedolin and Delgutte, 2005). An alternate theory is that pitch judgements are based on a profile of the response phase versus cochlear place, not on the place where the response magnitude is greatest (Shamma, 1985; Carney, 1992; Wang and Delgutte, 2009). This theory is attractive because according to cochlear models, for different frequencies the profiles across cochlear place are separated more distinctly for response phase slope than for response magnitude (Zhang et al 2001 – implemented by Wang and Delgutte, 2009). In other words, the phase function provides a better place code than the amplitude function (note: neural synchrony provides an additional benefit with either place cue). If the phase slope theory is correct, MOC-induced changes in cochlear response latencies may affect pitch judgements because cochlear filter bandwidths are changed which implies a change in the slope of the response-phase versus cochlear-place function.
4.7 Significance of the changes in cochlear response latencies to binarual localization
The changes in cochlear delays and filter bandwidths produced by MOC efferents at moderate sound levels are relatively small (5%), but at low frequencies the magnitude of the delay changes (~0.5 ms) are large compared to the delays involved in sound localization. Human binaural localization in the horizontal plane is sensitive to interaural time differences (ITDs) of a few tens of microseconds, and the OAE delay changes we measured are more than an order of magnitude larger than this. Such large changes in cochlear response latencies would exert a profound effect on binaural localization if they were not counter-balanced in some way. Indeed, unilateral cutting of efferents produced large disruptions in human binaural localization (Fisch, 1970).
There are two ways that MOC-induced changes in cochlear response latencies might be counter-balanced by the MOC system. First, it is possible that MOC collaterals to the cochlear nucleus may produce changes opposite to the MOC-induced changes in the cochlea and reduce or eliminate the change in neural delays produced by MOC efferents. There is, however, no evidence of this actually happening. Second, if MOC efferents produced the same delay change in both ears, then there would be no net change in interaural timing. In experimental animals the concentration of MOC innervation in the cochlea is not balanced overall, as shown by the crossed/uncrossed innervation ratio, which indicates that the ratio of the strength of ipsi/contra MOC effects is approximately 2:1 (reviewed by Guinan, 2006). However, these ratios can vary with frequency. In the cat, the ipsi/contra innervation ratio is much higher than 2:1 in the high-frequency cochlear base, but is close to unity in the low-frequency apex (Guinan et al 1984). In contrast, in the mouse, the innervation ratio varies little across frequency (Maison et al 2003). Perhaps this species difference came about because the mouse only hears at high frequencies and makes little use of ITD cues, whereas the cat also hears low frequencies and relies more heavily upon ITD cues. An attractive hypothesis that fits these data is that at low frequencies, where ITDs are important, the crossed/uncrossed innervation ratio has evolved to be close to unity to keep the MOC-induced change in cochlear response latencies approximately equal in both ears. The innervation ratio in humans is unknown, but sound-evoked MOC effects on SFOAEs indicate that for broad-band noise elicitors of MOC activity (but not narrow-band noise, which evokes much smaller effects), ipsilateral and contralateral MOC-inhibition is of similar magnitude (Backus and Guinan, 2006; Lilaonitkul and Guinan 2009a, 2009b). It seems reasonable to think that the equality of the ipsilateral and contralateral MOC effects at low frequencies has evolved to provide binaural balance for sound localization.
Acknowledgments
We thank Radha Kalluri, Jeffery Lichtenhan and Christopher Shera for comments on the manuscript. Supported by NIH NIDCD RO1 DC005977, P30 DC005209 and T32 DC00038.
Abbreviations
- CBBN
contralateral broad-band noise
- OAE
otoacoustic emission
- SFOAE
stimulus-frequency otoacoustic emission
- CEOAE
click-evoked otoacoustic emission
- DPOAE
distortion product otoacoustic emission
- SOAE
spontaneous otoacoustic emission
- CA
cochlear amplifier
- CAS
contralateral acoustic stimulation
- BM
basilar membrane
- MOC
medial olivocochlear
- TC
tuning curve
- AN
auditory nerve
- CF
characteristic frequency
- SNR
signal-to-noise ratio
- MEM
middle ear muscle
- STFT
short-time Fourier transform
- FFT
fast Fourier transform
- RMS
root-mean-square
- WT
wavelet transform
- ANOVA
analysis of variance
- pTC
psychophysical tuning curve
- ITD
interaural time difference
Footnotes
Publisher's Disclaimer: This is a PDF file of an unedited manuscript that has been accepted for publication. As a service to our customers we are providing this early version of the manuscript. The manuscript will undergo copyediting, typesetting, and review of the resulting proof before it is published in its final citable form. Please note that during the production process errors may be discovered which could affect the content, and all legal disclaimers that apply to the journal pertain.
References
- Backus BC, Guinan JJ., Jr Time course of the human medial olivocochlear reflex. J Acoust Soc Am. 2006;119:2889–2904. doi: 10.1121/1.2169918. [DOI] [PubMed] [Google Scholar]
- Backus BC, Guinan JJ., Jr Measurement of the Distribution of Medial Olivocochlear Acoustic Reflex Strengths Across Normal-Hearing Individuals via Otoacoustic Emissions. J Assoc Res Otolaryngol. 2007;8:484–96. doi: 10.1007/s10162-007-0100-0. [DOI] [PMC free article] [PubMed] [Google Scholar]
- Berlin CI, Hood LJ, Wen H, Szabo P, Cecola RP, Rigby P, Jackson DF. Contralateral suppression of non-linear click-evoked otoacoustic emissions. Hearing Res. 1993;71:1–11. doi: 10.1016/0378-5955(93)90015-s. [DOI] [PubMed] [Google Scholar]
- Berlin CI, Hood LJ, Hurley A, Wen H, Kemp DT. Binaural noise suppresses linear click-evoked otoacoustic emissions more than ipsilateral or contralateral noise. Hearing Res. 1995;87:6–103. doi: 10.1016/0378-5955(95)00082-f. [DOI] [PubMed] [Google Scholar]
- Bray P, Kemp D. An advanced cochlear echo technique suitable for infant screening. Br J Audiol Aug. 1987;21(3):191–204. doi: 10.3109/03005368709076405. [DOI] [PubMed] [Google Scholar]
- Brown MC, Liberman MC, Benson TE, Ryugo DK. Brainstem branches from olivocochlear axons in cats and rodents. J Comp Neurol. 1988;278(4):591–603. doi: 10.1002/cne.902780410. [DOI] [PubMed] [Google Scholar]
- Carney LH. Modeling the sensitivity of cells in the anteroventral cochlear nucleus to spatiotemporal discharge patterns. Philos Trans R Soc Lond B Biol Sci. 1992;336:403–6. doi: 10.1098/rstb.1992.0075. [DOI] [PubMed] [Google Scholar]
- Cedolin L, Delgutte B. Pitch of complex tones: rate-place and interspike interval representations in the auditory nerve. J Neurophysiol. 2005;94:347–62. doi: 10.1152/jn.01114.2004. [DOI] [PMC free article] [PubMed] [Google Scholar]
- Cooper NP, Guinan JJ., Jr Efferent-Mediated Control of Basilar Membrane Motion. J Physiol. 2006;576:49–54. doi: 10.1113/jphysiol.2006.114991. [DOI] [PMC free article] [PubMed] [Google Scholar]
- de Boer E. Travelling waves and cochlear resonance. Scand Audiol Suppl. 1979;9:17–33. [PubMed] [Google Scholar]
- de Boer E, Nuttall AL. Cochlear travel time and minimum phase. Asso Res Otolaryngol. 1996 Abstr 228, Session H1. [Google Scholar]
- de Boer E. Cochlear models and minimum phase. J Acoust Soc Am. 1997;102:3810–3813. [Google Scholar]
- Dolan DF, Guo MH, Nuttall AL. Frequency-dependent enhancement of basilar membrane velocity during olivocochlear bundle stimulation. J Acoust Soc Am. 1997;102:3587–3596. doi: 10.1121/1.421008. [DOI] [PubMed] [Google Scholar]
- Fisch U. Transtemporal surgery of the internal auditory canal: Report of 92 cases, technique, indications and results. Adv Otorhinolaryngol. 1970;17:203–240. [PubMed] [Google Scholar]
- Giraud AL, Perrin E, Chery Croze S, Chays A, Collet L. Contralateral acoustic stimulation induces a phase advance in evoked otoacoustic emissions in humans. Hear Res. 1996;94:54–62. doi: 10.1016/0378-5955(96)00002-0. [DOI] [PubMed] [Google Scholar]
- Giraud AL, Wable J, Chays A, Collet L, Chery-Croze S. Influence of contralateral noise on distortion product latency in humans: is the medial olivocochlear efferent system involved? J Acoust Soc Am. 1997;102:2219–2227. doi: 10.1121/1.419635. [DOI] [PubMed] [Google Scholar]
- Goldberg JM, Brown PB. Response of binaural neurons of dog superior olivary complex to dichotic tonal stimuli: some physiological mechanisms of sound localization. J Neurophysiol. 1969;32:613–636. doi: 10.1152/jn.1969.32.4.613. [DOI] [PubMed] [Google Scholar]
- Guinan JJ., Jr Olivocochlear Efferents: Anatomy, Physiology, Function, and the Measurement of Efferent Effects in Humans. Ear Hear. 2006;27:589–607. doi: 10.1097/01.aud.0000240507.83072.e7. [DOI] [PubMed] [Google Scholar]
- Guinan JJ, Jr, Cooper NP. Fast effects of efferent stimulation on basilar membrane motion. In: Gummer AW, Dalhoff E, Nowotny M, Scherer MP, editors. The Biophysics of the Cochlea: Molecules to Models. World Scientific; Singapore: 2003. pp. 245–251. [Google Scholar]
- Guinan JJ, Jr, Cooper NP. Medial olivocochlear efferent inhibition of basilar-membrane responses to clicks: evidence for two modes of cochlear mechanical excitation. J Acoust Soc Am. 2008;124:1080–92. doi: 10.1121/1.2949435. [DOI] [PMC free article] [PubMed] [Google Scholar]
- Guinan JJ, Jr, Gifford ML. Effects of electrical stimulation of efferent olivocochlear neurons on cat auditory-nerve fibers. III. 1988. Tuning curves and thresholds at CF. Hearing Res. 37:29–46. doi: 10.1016/0378-5955(88)90075-5. [DOI] [PubMed] [Google Scholar]
- Guinan JJ, Backus BC, Lilaonitkul W, Aharonson V. Medial olivocochlear efferent reflex in humans: otoacoustic emission (OAE) measurement issues and the advantages of stimulus frequency OAEs. J Assoc Res Otolaryngol. 2003;4:521–540. doi: 10.1007/s10162-002-3037-3. [DOI] [PMC free article] [PubMed] [Google Scholar]
- Guinan JJ., Jr . The physiology of olivocochlear efferents. In: Dallos PJ, Popper AN, Fay RR, editors. The Cochlea. Springer-Verlag; New York: 1996. pp. 435–502. [Google Scholar]
- Guinan JJ, Jr, Warr WB, Norris BE. Topographic organization of the olivocochlear projections from the lateral and medial zones of the superior olivary complex. J Comp Neurol. 1984;226:21–27. doi: 10.1002/cne.902260103. [DOI] [PubMed] [Google Scholar]
- Hood LJ, Berlin CI, Hurley A, Cecola P, Bell B. Contralateral suppression of transient-evoked otoacoustic emissions in humans: intensity effects. Hearing Res. 1996;101:113–118. doi: 10.1016/s0378-5955(96)00138-4. [DOI] [PubMed] [Google Scholar]
- Kalluri R, Shera CA. Distortion-product source unmixing: A test of the two-mechanism model for DPOAE generation. The Journal of the Acoustical Society of America. 2001;109(2):622. doi: 10.1121/1.1334597. [DOI] [PubMed] [Google Scholar]
- Kalluri R, Shera CA. Near equivalence of human click-evoked and stimulus-frequency otoacoustic emissions. J Acoust Soc Am. 2007;121:2097–110. doi: 10.1121/1.2435981. [DOI] [PubMed] [Google Scholar]
- Kawase T, Ogura M, Hidaka H, Sasaki N, Suzuki Y, Takasaka T. Effects of contralateral noise on measurement of the psychophysical tuning curve. Hear Res. 2000;142:63–70. doi: 10.1016/s0378-5955(00)00010-1. [DOI] [PubMed] [Google Scholar]
- Lilaonitkul W, Guinan JJ., Jr Reflex control of the human inner ear: a half-octave offset in medial efferent feedback that is consistent with an efferent role in the control of masking. J Neurophysiol. 2009a;101:1394–406. doi: 10.1152/jn.90925.2008. [DOI] [PMC free article] [PubMed] [Google Scholar]
- Lilaonitkul W, Guinan JJ., Jr Human Medial Olivocochlear Reflex: Effects as Functions of Contralateral, Ipsilateral, and Bilateral Elicitor Bandwidths. J Assoc Res Otolaryngol. 2009b;10(3):459–70. doi: 10.1007/s10162-009-0163-1. [DOI] [PMC free article] [PubMed] [Google Scholar]
- Maison SF, Adams JC, Liberman MC. Olivocochlear innervation in the mouse: immunocytochemical maps, crossed versus uncrossed contributions, and transmitter colocalization. J Comp Neurol. 2003;455:406–16. doi: 10.1002/cne.10490. [DOI] [PMC free article] [PubMed] [Google Scholar]
- Morand N, Khalfa S, Ravazzani P, Tognola G, Grandori F, Durrant JD, Collet L, Veuillet E. Frequency and temporal analysis of contralateral acoustic stimulation on evoked otoacoustic emissions in humans. Hear Res. 2000;145:52–58. doi: 10.1016/s0378-5955(00)00069-1. [DOI] [PubMed] [Google Scholar]
- Murugasu E, Russell IJ. The effect of efferent stimulation on basilar membrane displacement in the basal turn of the guinea pig cochlea. J Neurosci. 1996;16:325–332. doi: 10.1523/JNEUROSCI.16-01-00325.1996. [DOI] [PMC free article] [PubMed] [Google Scholar]
- Oppenheim AV, Wilsky AS. Signals and Systems. 2. Prentice Hall; New Jersey: 1997. [Google Scholar]
- Oppenheim AV, Schafer WS. Discrete-Time Signal Processing. 2. Prentice Hall; New Jersey: 1999. [Google Scholar]
- Patuzzi R. Cochlear Micomechanics and Macromechanics. In: Dallos PJ, Popper AN, Fay RR, editors. The Cochlea. Springer-Verlag; New York: 1996. pp. 186–257. [Google Scholar]
- Puria S, Allen JB. Measurements and model of the cat middle ear: evidence of tympanic membrane acoustic delay. J Acoust Soc Am. 1998;104:3463–81. doi: 10.1121/1.423930. [DOI] [PubMed] [Google Scholar]
- Quaranta N, Scaringi A, Nahum S, Quaranta A. Effects of efferent acoustic reflex activation on psychoacoustical tuning curves in humans. Acta Otolaryngol. 2005;125:520–3. doi: 10.1080/00016480510026214. [DOI] [PubMed] [Google Scholar]
- Ryan S, Kemp DT, Hinchcliffe R. The influence of contralateral acoustic stimulation on click-evoked otoacoustic emission in humans. Br J Audiol. 1991;25:391–397. doi: 10.3109/03005369109076614. [DOI] [PubMed] [Google Scholar]
- Ruggero MA, Temchin AN. Unexceptional sharpness of frequency tuning in the human cochlea. Proc Natl Acad Sci U S A. 2005;102:18614–9. doi: 10.1073/pnas.0509323102. [DOI] [PMC free article] [PubMed] [Google Scholar]
- Ruggero MA, Temchin AN. Similarity of traveling-wave delays in the hearing organs of humans and other tetrapods. J Assoc Res Otolaryngol. 2007;8(2):153–66. doi: 10.1007/s10162-007-0081-z. [DOI] [PMC free article] [PubMed] [Google Scholar]
- Shamma SA. Speech processing in the auditory system. II: Lateral inhibition and the central processing of speech evoked activity in the auditory nerve. J Acoust Soc Am. 1985;78:1622–32. doi: 10.1121/1.392800. [DOI] [PubMed] [Google Scholar]
- Shera CA, Talmadge CL, Tubis A. Interrelations among distortion-product phase-gradient delays: their connection to scaling symmetry and its breaking. J Acoust Soc Am. 2000;108:2933–48. doi: 10.1121/1.1323234. [DOI] [PubMed] [Google Scholar]
- Shera CA, Guinan JJ., Jr Evoked otoacoustic emissions arise by two fundamentally different mechanisms: A taxonomy for mammalian OAEs. J Acoust Soc Am. 1999;105:782–798. doi: 10.1121/1.426948. [DOI] [PubMed] [Google Scholar]
- Shera CA, Guinan JJ, Jr, Oxenham AJ. Revised estimates of human cochlear tuning from otoacoustic and behavioral measurements. Proc Natl Acad Sci U S A. 2002;99:3318–3323. doi: 10.1073/pnas.032675099. [DOI] [PMC free article] [PubMed] [Google Scholar]
- Shera CA, Zweig G. Noninvasive measurement of the cochlear traveling-wave ratio. J Acoust Soc Am. 1993;93(6):3333–52. doi: 10.1121/1.405717. [DOI] [PubMed] [Google Scholar]
- Sisto R, Moleti A, Shera CA. Cochlear reflectivity in transmission-line models and otoacoustic emission characteristic time delays. J Acoust Soc Am. 2007;122(6):3554–61. doi: 10.1121/1.2799498. [DOI] [PubMed] [Google Scholar]
- Strelcyk O, Christoforidis D, Dau T. Relation between derived-band auditory brainstem response latencies and behavioral frequency selectivity. J Acoust Soc Am. 2009;126(4):1878–88. doi: 10.1121/1.3203310. [DOI] [PubMed] [Google Scholar]
- Temchin AN, Rich NC, Ruggero MA. Threshold tuning curves of chinchilla auditory nerve fibers. I. Dependence on characteristic frequency and relation to the magnitudes of cochlear vibrations. J Neurophysiol. 2008;100(5):2889–98. doi: 10.1152/jn.90637.2008. [DOI] [PMC free article] [PubMed] [Google Scholar]
- Tognola G, Grandori F, Ravazzani P. Time-frequency distributions of click-evoked otoacoustic emissions. Hear Res. 1997;106(1–2):112–22. doi: 10.1016/s0378-5955(97)00007-5. [DOI] [PubMed] [Google Scholar]
- Tognola G, Grandori F, Ravazzani P. Time-frequency distribution methods for the analysis of click-evoked otoacoustic emissions. Technol Health Care. 1998;6(2–3):159–75. [PubMed] [Google Scholar]
- Torrence C, Compo GP. A practical guide to wavelet analysis. Bull Amer Meteor Soc. 1998;79:61–78. [Google Scholar]
- Veuillet E, Collet L, Duclaux R. Effect of contralateral acoustic stimulation on active cochlear micromechanical properties in human subjects: Dependence on stimulus variables. J Neurophysiol. 1991;65:724–735. doi: 10.1152/jn.1991.65.3.724. [DOI] [PubMed] [Google Scholar]
- Veuillet E, Duverdy-Bertholon F, Collet L. Effect of contralateral acoustic stimulation on the growth of click-evoked otoacoustic emissions in humans. Hearing Res. 1996;93:128–135. doi: 10.1016/0378-5955(95)00212-x. [DOI] [PubMed] [Google Scholar]
- Vinay, Moore BC. Effects of activation of the efferent system on psychophysical tuning curves as a function of signal frequency. Hear Res. 2008;240:93–101. doi: 10.1016/j.heares.2008.03.002. [DOI] [PubMed] [Google Scholar]
- Warren EH, Liberman MC. Effect of contralateral sound on auditory nerve response I. Contribution of cochlear efferents. Hear Res. 1989a;37:89–104. doi: 10.1016/0378-5955(89)90032-4. [DOI] [PubMed] [Google Scholar]
- Warren EH, Liberman MC. Effects of contralateral sound on auditory-nerve responses. II. Dependence on stimulus variables. Hear Res. 1989b;37(2):105–21. doi: 10.1016/0378-5955(89)90033-6. [DOI] [PubMed] [Google Scholar]
- Wang G, Delgutte B. Spatio-Temporal Processing of Auditory-Nerve Activity in the Cochlear Nucleus. Asso Res Otolaryngol, Abstr. 2009;32:286. (#845) [Google Scholar]
- Wit HP, van Dijk P, Avan P. Wavelet analysis of real ear and synthesized click evoked otoacoustic emissions. Hear Res. 1994;73(2):141–7. doi: 10.1016/0378-5955(94)90228-3. [DOI] [PubMed] [Google Scholar]
- Withnell RH, Hazlewood C, Knowlton A. Reconciling the origin of the transient evoked ototacoustic emission in humans. The Journal of the Acoustical Society of America. 2008;123(1):212–221. doi: 10.1121/1.2804635. [DOI] [PubMed] [Google Scholar]
- Zhang X, Heinz MG, Bruce IC, Carney LH. A phenomenological model for the responses of auditory-nerve fibers: I. Nonlinear tuning with compression and suppression. J Acoust Soc Am. 2001;109:648–70. doi: 10.1121/1.1336503. [DOI] [PubMed] [Google Scholar]
- Zweig G, Shera CA. The origin of periodicity in the spectrum of evoked otoacoustic emissions. J Acoust Soc Am. 1995;98:2018–2047. doi: 10.1121/1.413320. [DOI] [PubMed] [Google Scholar]


