Abstract
Chromosome ends are protected from degradation by the presence of the highly repetitive hexanucleotide sequence of TTAGGG and associated proteins. These so-called telomeric complexes are suggested to play an important role in establishing a functional nuclear chromatin organization. Using peptide nucleic acid (PNA) probes, we studied the dynamic behavior of telomeric DNA repeats in living human osteosarcoma U2OS cells. A fluorescent cy3-labeled PNA probe was introduced in living cells by glass bead loading and was shown to specifically associate with telomeric DNA shortly afterwards. Telomere dynamics were imaged for several hours using digital fluorescence microscopy. While the majority of telomeres revealed constrained diffusive movement, individual telomeres in a human cell nucleus showed significant directional movements. Also, a subfraction of telomeres were shown to associate and dissociate, suggesting that in vivo telomere clusters are not stable but dynamic structures. Furthermore, telomeres were shown to associate with promyelocytic leukemia (PML) bodies in a dynamic manner.
Keywords: ALT/live cell imaging/PML/PNA/telomeres
Introduction
Telomeres are the protein–DNA structures at the ends of eukaryotic chromosomes essential for maintaining chromosome stability and integrity. In addition, telomeres regulate the replicative life span of somatic cells, play a role in the chromosome pairing process during the first meiotic prophase and contribute to maintenance of chromosome topology in the cell nucleus. In vertebrates, the DNA component of telomeres consist of tandem (TTAGGG) hexanucleotide repeats, spanning 5–15 kb in length in humans. Because the length of the telomere repeat reflects the proliferative potential of normal somatic cells lacking telomerase, methods to quantitatively measure telomere length have been developed and are applied in studies of aging and associated disorders. In particular, fluorescence in situ hybridization (FISH) techniques in conjunction with digital fluorescence microscopy revealed quantitative information on telomere length in interphase cells (Henderson et al., 1996; de Pauw et al., 1998) and on the length of telomeres on individual metaphase chromosomes (Lansdorp et al., 1996; Zijlmans et al., 1997).
A remarkable feature of telomeres is that they silence genes flanking the telomere repeat (Gottschling et al., 1990; Nimmo et al., 1994; Cryderman et al., 1999). This phenomenon, called the telomere position effect, is likely modulated by telomere length and local heterochromatin structure (Baur et al., 2001; Koering et al., 2002; Ning et al., 2003). In yeast, telomeres were shown to localize in six to 10 clusters at the nuclear periphery (Gotta et al., 1996). This subnuclear organization is important for telomeric silencing, possibly by creating a nuclear subcompartment enriched for silencing factors such as Sir3 and Sir4. This nuclear subcompartment may play essential roles in the spatial regulation of gene expression. Telomeric clustering has been shown to be maintained by Ku proteins, as mutations in the encoding genes have led to disrupted nuclear organization of telomeres and loss of telomeric silencing (Laroche et al., 1998; Hediger et al., 2002). In mammalian cells, loss of Ku leads to aberrant telomere–telomere fusions (Hsu et al., 2000; Espejel et al., 2002).
In contrast to the situation in yeast, in human cells telomeres seem to be randomly positioned throughout the cell nucleus (Ludérus et al., 1996) or, as observed in T-lymphocytes, positioned within the interior 50% of the nuclear volume (Ferguson and Ward, 1992). Nevertheless, because telomeres are firmly attached to the nuclear matrix throughout interphase, they are thought to be important for the intranuclear positioning of chromosomes (de Lange, 1992; Ludérus et al., 1996; Weipoltshammer et al., 1999). Also, the occurrence of telomere–telomere associations has been suggested to play a role in nuclear organization (Nagele et al., 2001).
In tumor cells, telomere maintenance is required to overcome cellular senescence and to establish immortalized cells. In most cases this is achieved by the activation of telomerase, the enzyme that is responsible for telomere lengthening. A subset of tumors, however, do not show telomerase activity and are supposed to maintain or increase the length of telomeres through an alternative mechanism of telomere lengthening (ALT), which is based on recombination between telomeric sequences (Henson et al., 2002).
In this study, we used fluorescently labeled PNA probes to specifically target the telomeric DNA repeat sequences in U2OS cells to directly observe their dynamics in vivo. A subset of telomeres revealed a much higher degree of mobility than we anticipated, considering their association with the nuclear matrix. We show that telomeres have the ability to associate with each other in a dynamic manner. This tendency to physically associate may account for the high incidence of chromosomal rearrangements in (sub)telomeric regions found in somatic cells (Flint et al., 1995; van Overveld et al., 2000) and for the recombination-based interchromosomal telomeric DNA exchanges observed in ALT cells (Dunham et al., 2000). Interestingly, in U2OS cells that maintain their telomeres by an ALT mechanism (Scheel et al., 2001), we observed a dynamic association of telomeric DNA with relatively immobile promyelocytic leukemia (PML) bodies. Such an association was not observed in telomerase-positive HeLa cells.
Results
Visualizing telomeres in living cells
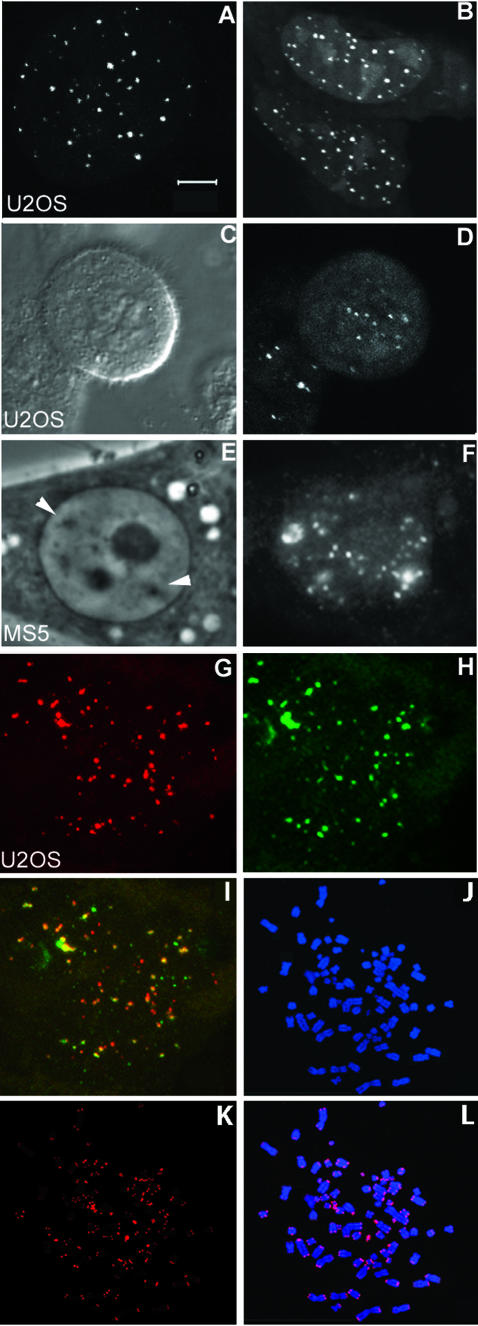
A PNA probe has been designed that shows high hybridization efficiency to the telomeric DNA repeat sequence (Lansdorp et al., 1996). Because PNA–DNA hybrids are much more stable than DNA–DNA hybrids, we anticipated that within the living cell, the PNA probe would selectively and competitively form a heteroduplex with telomeric DNA. To introduce the PNA probe into living U2OS cells we made use of glass beads (McNeil and Werder, 1987). Shortly after bead loading, specific staining of telomeres could be observed as indicated by the presence of small fluorescent foci in interphase nuclei (Figure 1A and B), as well as in mitotic cells (Figure 1C and D). The signal:background ratio increased steadily for several hours after loading, indicating that an increasing amount of PNAs associate with telomeric DNA. An optimal staining intensity of telomeres was reached after 2 h following bead loading. The fluorescence intensity of spots varied considerably within a cell, which is consistent with the heterogeneity in telomere lengths characteristic for the ALT phenotype (Scheel et al., 2001). Since U2OS cells contain an average of 77 chromosomes, we expected to observe 154 telomeres per nucleus. However, we generally observed up to 70 telomeres, even when serial optical sections, as acquired by confocal microscopy, were studied, suggesting that the brightest fluorescent spots may represent sites at which a number of telomeres are clustered together. Also, some telomeres may only be weakly stained, making it difficult to discriminate their fluorescent signals from background fluorescence.
Fig. 1. Telomere-specific PNA probe binds to telomeric DNA sequences. Human U2OS as well as mouse MS5 cells were bead-loaded with a cy3-labeled (C3TA2)3 PNA probe and monitored 2 h later. Binding of the probe to telomeric DNA in U2OS cells resulted in variable numbers of fluorescent spots that varied in size and intensity (A and B). The image of the cell depicted in (A) reveals 54 spots, while in the two cells shown in (B), 51 and 65 spots are visible. In addition to interphase cells, binding of PNA probe to telomeres in mitotic cells was also observed as indicated by the differential interference contrast image (C) and the fluorescence image (D). In mouse MS5 cells, telomeres localized to two heterochromatic regions, which are indicated by arrows in the phase contrast image (E) in addition to other nuclear sites (F). Living U2OS cells that were first loaded with lissamine- labeled PNA probe (G), and then fixed and hybridized with a FITC- labeled, telomere-specific plasmid probe (H), show colocalization as indicated in yellow in (I). Hybridization of cy3-labeled (C3TA2)3 PNA probe to metaphase spreads of U2OS cells revealed staining of telomeric DNA at nearly all chromosome ends, in addition to staining of a few extrachromosomal telomeric DNA repeats (K and L). Chromosomes were counterstained with DAPI (J). Bar = 5 µm.
In addition to U2OS cells, telomeric DNA could be detected in other cell types with varying success. Weak staining of telomeres was observed in living human fibroblasts and HeLa cells, while intense staining was observed in MS5 mouse cells. Although interpretation of the results is somewhat hampered due to possible variability of access of the PNA to telomeric DNA, our results suggest that there is a correlation between telomere length and signal intensity. In living mouse MS5 cells, in addition to single telomere spots, two clusters of fluorescent spots were visible at the heterochromatic blocks, characteristic for mouse cells (Figure 1E and F). These clusters most likely represent telomeres, but probably also represent internal tracts of TTAGGG repeats or related heterochromatin satellite repeats.
PNAs specifically stain telomeric DNA
It is essential that all fluorescent spots that become visible after introducing the telomere-specific PNA probe do indeed represent telomeric DNA. To test this, living cells were loaded with a lissamine-labeled, telomere-specific PNA probe, fixed, and hybridized with a fluoresceine-labeled, telomere-specific plasmid probe (Figure 1G–I). Because red (representing the PNA probe) and green (representing the telomere-specific plasmid probe) spots overlapped, as would be expected if the fluorescent spots do indeed mark the telomere DNA, we concluded that the PNA probes used here specifically stain telomeric DNA. In addition, similar amounts of spots and distribution patterns were observed in fixed cells compared to living cells. Regular FISH experiments using the cy3-labeled PNA probe on U2OS-derived metaphase spreads revealed that the majority of chromosomes show fluorescent spots at telomeric positions and that in addition some extrachromosomal telomeric DNA is stained (Figure 1J–L). Stretches of the T2AG3 hexamer that are present at interstitial sites (Azzalin et al., 2001) were not detected, making visualization of these sequences in living cells unlikely.
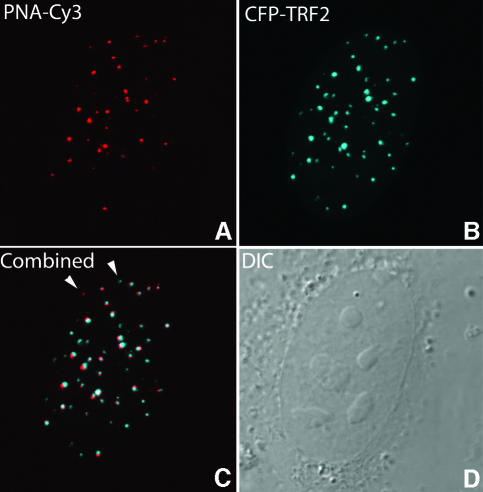
Because PNA hybridization may affect telomere structure and therefore may influence telomere movement, we investigated whether the recruitment of telomere binding proteins at telomeres is affected by PNA hybridization. Following telomere staining with a telomere-specific PNA probe, cells were transiently transfected with a cyan fluorescent protein (CFP)–TRF2 DNA construct and, following CFP–TRF2 expression, analyzed by confocal microscopy. As illustrated in Figure 2, nearly all telomeres that revealed cy3-PNA staining recruited CFP–TRF2. This result indicates that the recruitment of telomere binding proteins to telomeres is not prevented by cy3-PNA probe hybridization and suggests that telomere structure is not affected by hybridization of PNA probes. Furthermore, the hybridization efficiency of the PNA probe appeared to be high.
Fig. 2. Hybridization of PNAs to telomeric DNA does not prevent binding of CFP–TRF2 in living U2OS cells. Double labeling of cells with CFP–TRF2 and cy3-PNA results in a nearly complete colocalization of the two (C). Hybridization of cy3-PNA to telomeres is shown in (A) and recruitment of CFP–TRF2 to telomeres is shown in (B). (C) A few telomeres, indicated with arrowheads, were stained with either PNA probe or CFP–TRF2 only. A differential interference contrast image of this nucleus is shown in (D).
Labeled cells maintain their ability to undergo mitosis
Although we anticipated that the telomere-specific PNA probes hybridize to their target sequences by strand displacement, we cannot exclude the possibility that the PNA probe forms triplex configurations with telomeric DNA or hybridizes solely to single-stranded telomere DNA overhangs. Irrespective of the mechanism, PNA binding to telomeres did not prevent cells from going through the cell cycle. We monitored cell division of labeled cells for 24 h, and the cells appeared to divide normally (Supplementary figure 1, available at The EMBO Journal Online). The resulting daughter cells still revealed intense telomere staining. DNA replication did not appear to be disrupted by the presence of PNA probes at telomeres, suggesting that the PNAs are released during this process. We employed fluorescence recovery after photobleaching (FRAP) to assess PNA probe–telomeric DNA association–dissociation, which showed that PNAs are not stably associated with telomeres but exhibit a slow continuous exchange (Supplementary figure 1). The amount of telomere-bound PNA probe, however, was sufficient to study movements in time.
Telomere distribution and dynamics
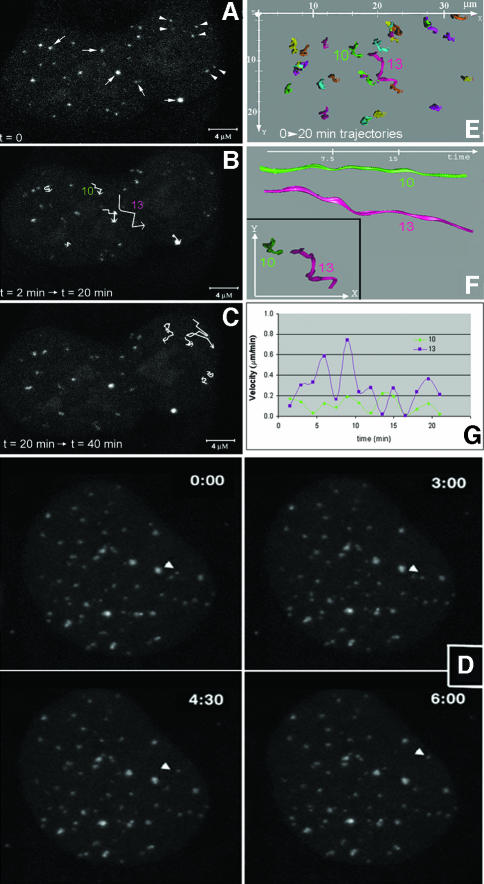
In agreement with previous studies in which telomere distribution has been analyzed in fixed cells (Ludérus et al., 1996), telomeres seem to be randomly distributed throughout the nuclei of living cells (Figure 1A and B). Three-dimensional analysis of telomere distribution did not reveal any preference of telomeres to localize centrally or at the periphery of the cell nucleus. To determine whether telomeres exhibit dynamic behavior in human cells, we followed the intranuclear positions of telomeres in 20 living U2OS cells loaded with telomere-specific cy3-PNA in interphase. For 30–60 min, image stacks were recorded every 60 or 90 s. These time-lapse experiments revealed that the majority of telomeres move only a little in the cell nucleus, while a few showed a significant degree of movement (Figure 3). Furthermore, analysis of the time-lapse images revealed that individual telomeres move within confined nuclear regions within a radius of <1 µm. To support these observations with quantitative data, we selected 10 representative cells and generated time–space trajectories of the fluorescent spots using an image analysis package for time-resolved analysis of dynamic processes (Tvaruskó et al., 1999). As an example of such an analysis, time–space trajectories of the fluorescent spots shown in Figure 3A–C are shown in Figure 3E–G. The trajectories confirm that most telomeres undergo no significant amount of movements over large distances.
Fig. 3. Live-cell imaging demonstrates dynamics of telomeric DNA. U2OS cells were loaded with cy3-labeled (C3TA2)3 PNA and image stacks were collected every 90 s for 60 min. During two different time periods, the movements of telomeres [indicated by arrows and arrowheads in (A)] were recorded and the trajectories were plotted (B and C). As indicated by the length of the trajectories, some telomeres showed a significant movement while others showed hardly any movement. (D) Another example of a cell nucleus in which a telomere spot (arrowhead) moved over a large distance within a defined (6 min) time period. From the cell in (A)–(C), the trajectories of a selected number of telomeres in the first 20 min of the time-lapse series are calculated and displayed in the xy-plane (E). While most telomeres moved in a small area, the spot indicated by trajectory number 13 showed significant movement. This difference in mobility becomes more apparent when the trajectories (F) and velocities (G) of spots 10 (green) and 13 (purple) are compared. In (F), the trajectory of the two telomeres is shown from two different viewpoints.
We next calculated the mean average velocity and the mean maximum velocity for telomeres by computing the displacements of telomere spots in a cell nucleus using the TiLLvisTRAC software, followed by a correction for cell mobility during imaging. To achieve a good estimate of cell displacement during imaging we calculated the displacement of average x and y positions of all slow-moving telomere spots and corrected displacements of individual telomere spots for this value, which is typically in the order of 0.05 µm/min (maximal 1.2 µm during a 20 min imaging period). After this correction, the mean average velocity calculated was 0.2 ± 0.1 µm/min and the mean maximum velocity was 0.3 µm/min. Individual telomeres, however, could reveal a total displacement over ∼8 µm, with an average velocity of 0.4 ± 0.3 µm/min and a maximal velocity of ∼0.8 µm/min during a 20 min time period (see, for example, spot 13 in Figure 3).
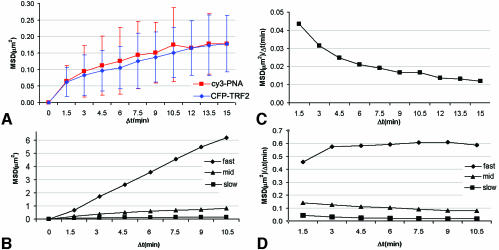
To characterize telomere mobility further, we plotted the mean square displacement (MSD) of telomere spots (after correction for cell mobility) over increasing time intervals (Δt). MSD/Δt plots of individual telomeres revealed a large variation in telomere mobility within cells, and on the basis of the distribution of the telomere MSDs, three categories of telomere movements were found. The majority of telomeres showed a slow, constrained diffusion, reaching an MSD plateau at around 0.2 µm2 (Figure 4A and B). A second category, comprising ∼10% of the telomeres, showed constrained movements over larger distances, reaching MSD plateaus between 0.4 and 2 µm2, with an average plateau value of ∼0.9 µm2 (Figure 4B). An MSD plot of a very fast moving telomere showed a linear MSD plot for the time period analyzed (Figure 4B) and thus did not show constrained movement within the time-frame of observation. From the initial slopes of the MSD plots we determined the average diffusion coefficient for telomere movement according to Vazquez et al. (2001). This was estimated to be ∼1.8 × 10⁻⁴ µm2/s for the slow telomeres, 5.8 × 10⁻⁴ µm2/s for the relatively fast moving population and 1.9 × 10⁻³ µm2/s for a selected very fast moving telomere. Next, we estimated the radius of constraint from the MSD plots for the slow and relatively fast moving telomere populations (see Materials and methods). An MSD plateau value of ∼0.2 µm2 for the most constrained population corresponds to an estimated radius of constraint of ∼0.5 µm, and an MSD plateau value of ∼0.9 µm2 for the relatively fast moving telomeres corresponds to an estimated radius of constraint of ∼1.2 µm. Furthermore, by plotting MSD/Δt as a function of Δt, the slope of which is proportional to the diffusion coefficient (Vazquez et al., 2001), it becomes clear that for the slow telomeres in particular, and to some extent for the relatively fast moving population, the diffusion coefficients decrease with increasing time intervals, consistent with constrained movement (Figure 4C and D). Notably, no decrease in diffusion coefficient was observed for the very fast moving telomeres.
Fig. 4. Quantitative analysis of telomere movements. (A) A plot of MSD against Δt for telomeres stained with either cy3-PNA or CFP–TRF2. Data represent average values of 100 telomeres (derived from five cells) for cy3-PNA and 25 telomeres for CFP–TRF2 (derived from two cells). Both plots show an indicative for constraint diffusion and reach a plateau at ∼0.2 µm2/s. (B) MSD plot of three populations of cy3-PNA labeled telomeres demonstrating different movement behavior. The squares represent the most constrained population, which is also shown in (A). The triangles represent a subpopulation of telomeres (10% of all telomeres) that show faster movement over larger distances but that still reach a plateau. The diamonds represent a fast-moving telomere. By plotting MSD/Δt, proportional to the diffusion coefficent, as a function of Δt (Vazquez et al., 2001), it becomes clear that the diffusion coefficient decreases with increasing time intervals for the two slowest populations (C and D), consistent with constrained movement, but not for the fast telomere for the time period analyzed (D).
Similar analyses of telomere motions were performed using cells expressing CFP–TRF2. Like PNA-tagged telomeres, CFP–TRF2-tagged telomeres revealed a large variability in velocities and distances traveled by individual telomeres. As shown in Figure 4A, the MSD versus Δt plot of the slow-moving CFP–TRF2-tagged telomeres is similar to that for cy3 PNA-tagged telomeres. We therefore conclude that PNA binding per se does not significantly affect telomere movement.
Telomeres join and separate in U2OS cells
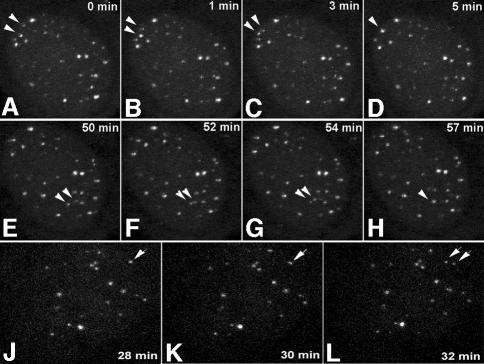
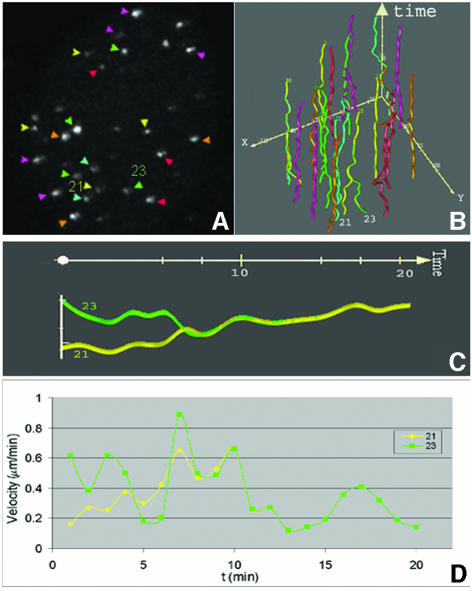
Interestingly, our time-lapse observations revealed telomeres associating with (Figure 5A–H) and also leaving telomere clusters (Figure 5J–L) in nearly all cells analyzed, suggesting that telomeres have the ability to temporarily interact with each other. A detailed motion analysis of one such event is shown in Figure 6. The spots 21 and 23 start as separately moving spots with different positions and velocities. At t = 10 min, the two telomere spots are associated and remain associated during the rest of the time-lapse period. This was clear not only from an increase in fluorescence intensity associated with fusion of the two spots, but also from the synchronization of the movements of the two spots after the fusion events. Following association, the velocity of the associated spots decreased (Figure 6D). The fact that two spots, which initially move at different velocities, continued to move at one identical velocity once they joined together and that the joining of spots could be traced in single confocal image sections exclude the possibility that we observed spots that are aligned in other focal planes. Finally, time-lapse movies of CFP–TRF2-tagged telomeres also revealed telomeres associating and dissociating from clusters (result not shown).
Fig. 5. Time-lapse microscopy demonstrates temporal interactions between telomeric DNA foci. U2OS cells were loaded with cy3-labeled (C3TA2)3 PNA and image stacks were recorded at 60-s time-intervals for 1 h. In the cell shown in (A–H), two independent fusion events were recorded as indicated by arrowheads. In another interphase cell nucleus, the separation of two telomeric DNA foci is shown (J–L, arrows). Images represent maximum projections of 16 Z-sections.
Fig. 6. Tracking of telomeric association in time and space. Twenty-one time-lapse images of the cell shown in Figure 4, including a telomere association event, were analyzed using an image tracking algorithm, and visualized graphically. The maximum projection of the first three-dimensional image stack in this time series is shown in (A). The time–space trajectories of telomeres are shown in (B). The colored trajectories in (B) correspond to the fluorescent spots indicated by colored arrowheads in (A). The association event was analyzed in more detail as shown in (C) and (D). From time point 10 min, both the movement and velocity of spots 21 and 23 are identical, indicating a stable association between two telomeres.
Centromeres and most telomeres are equally constrained in their movement
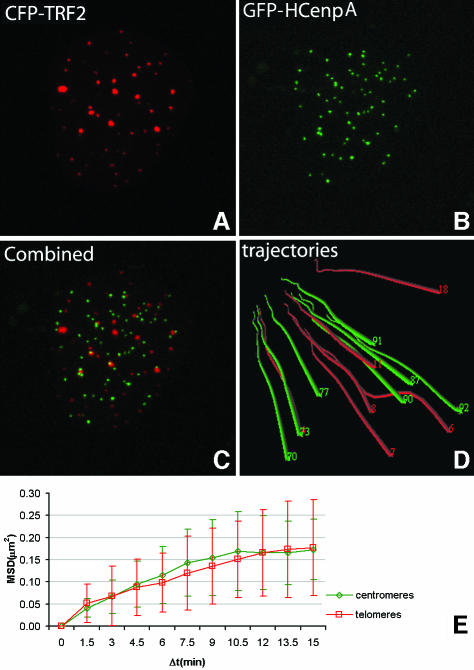
To compare the movement of telomeres with that of a second tagged site, green fluorescent protein (GFP)–hCENPA and CFP–TRF2 were co-expressed in U2OS cells (Figure 7A–C). The movements of centromeres as well as of telomeres, present in the same cell, were then analyzed simultaneously by time-lapse confocal microscopy and time-space trajectories were made. Trajectories of the population of centromeres and slow moving telomeres are shown in Figure 7D and indicate that both telomeres and centromeres move within a confined nuclear space. Next, the MSD values from both telomeres and centromeres were plotted as a function of Δt and the resulting plots show that the centromeres show a constrained movement similar to the slow population of telomeres (Figure 7E).
Fig. 7. Quantitative analysis of movement of telomeres and centromeres in a single nucleus. Telomeres and centromeres were visualized using CFP–TRF2 (A) and GFP–hCENPA (B), respectively. The overlay of these images is shown in (C). Quantitative movement analysis of telomeres and centromeres was performed using the TILLvisTRAC software as described in Materials and methods. A selection of trajectories is shown in (D). Average MSD values of both telomeres (n = 16) and centromeres (n = 16) in one nucleus plotted against Δt revealed that the average MSD of centromeres is similar to that of the population of constrained telomeres (E).
Dynamic interaction between telomeres and PML bodies
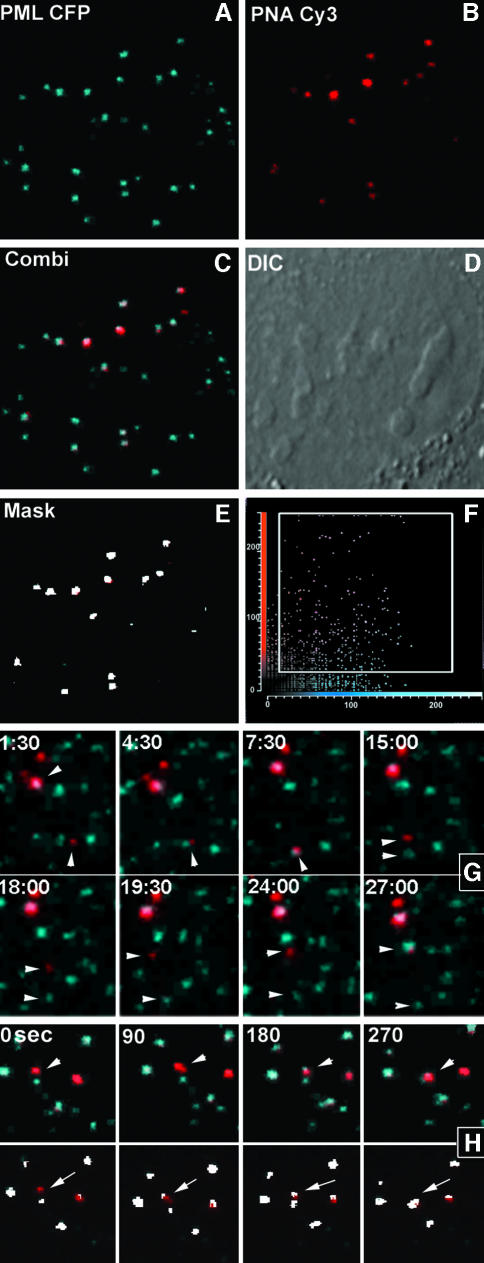
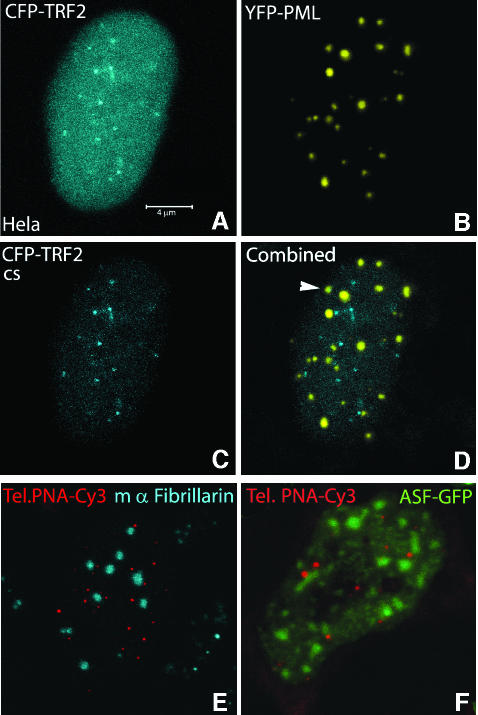
Because telomeres have been reported to be associated with PML nuclear bodies in ALT-positive cells (Yeager et al., 1999), we wanted to examine whether telomere dynamics is related to PML body movement. For this purpose, U2OS cells were transfected with a CFP–PML expression construct and telomeres were labeled with cy3-PNA. Cells that exhibited both PML body as well as telomere staining revealed variable numbers of telomeres associated with PML bodies. Figure 8A–F shows a cell in which at least 10 intensely labeled telomeres were found to be associated with PML bodies. Associations are shown most clearly in a masked image (Figure 8E) that displays only the pixels in which both colors have an intensity above a threshold value (Figure 8F). When cells were imaged for 30 min with 90-s time-intervals, it appeared that most associations between telomeres and PML nuclear bodies remained stable during this period. However, some associations proved to be dynamic as telomeres were shown to associate with and dissociate from relatively immobile PML bodies. Figure 8G shows a telomere that associates successively with two different PML bodies within 10 min. Occasionally, PML protein was shown to accumulate at telomeric DNA, before the telomere associated with a PML body already associated to telomeric DNA (Figure 8H). When U2OS cells were labeled with cy3-PNA, fixed and incubated with an antibody to stain endogenous PML, similar numbers of associations between telomeric DNA and PML nuclear bodies were observed, indicating that these associations are not induced by expressing CFP–PML (unpublished result). Furthermore, to exclude the possibility that the observed telomere–PML associations in U2OS cells reflect contacts by chance, we analyzed the distribution of telomeres relative to PML bodies in HeLa cells expressing yellow fluorescent protein (YFP)–PML and CFP–TRF2. Ten cells were analyzed by confocal microscopy, none of which revealed significant amounts of telomere–PML associations. A representative example of a double-labeled cell is shown in Figure 9A–D. Compared with U2OS cells, HeLa cells revealed a more diffuse CFP–TRF2 staining throughout the cell nucleus and a less intense staining of telomeres.
Fig. 8. Telomeric DNA associates with PML bodies in a dynamic manner. U2OS cells were transiently transfected with CFP–PML (A) and loaded with cy3-labeled (C3TA2)3 PNA (B). A subset of telomeres were shown to be associated with PML bodies (C). A differential contrast image of the cell in (A)–(C) is shown in (D). The colocalization of telomeric DNA with PML in this cell is more clearly shown in a mask image (E) that was obtained by selecting those pixels in which the intensity of both colors was above a threshold value that distinguished the specific signals from background fluorescence (F). Time-lapse images of another cell nucleus, taken every 90 s for 30 min, reveal successively the association of a telomere with a PML body, its dissociation from the body and its association with another PML body (G). Occasionally, PML protein was shown to localize to a telomeric DNA sequence before their association with a PML nuclear body (H). In the lower row, the colocalization between telomeric DNA and PML is shown in white by selecting pixels in which the intensity of both colors is above threshold value.
Fig. 9. Telomeres do not associate with PML bodies in telomerase-positive HeLa cells, nor with nucleoli, speckles and Cajal bodies in U2OS cells. Coexpression of CFP–TRF2 (A and C) and YFP–PML (B) revealed no association between telomeres and PML bodies (D). TRF2 showed a more diffuse nuclear staining and weaker telomeric signals in HeLa cells compared with U2OS cells (Figure 2). The arrow indicates an apparent colocalization between a telomere and a PML body, however the spots were derived from different Z-slices. (E and F) In U2OS cells, telomeres are not associated with nucleoli, Cajal bodies or speckles, as demonstrated after bead-loading of cells with a Cy3- labeled (C3TA2)3 PNA probe, in which either nucleoli and Cajal bodies were stained using an anti-fibrillarin antibody (E), or speckles by transfection with ASF–GFP (F).
To examine whether telomeres associate with other nuclear compartments as well in U2OS cells, we analyzed the distribution of telomeres relative to that of nucleoli, Cajal bodies and speckles by live cell imaging and immunocytochemistry. Representative images are shown in Figure 9E and F and indicate that telomeres only occasionally associate with these nuclear compartments in U2OS cells. Taken together, these results demonstrate that telomeres and PML do not contact each other by pure chance.
Discussion
We describe here the establishment of a telomere labeling procedure in living cells using fluorophore-labeled PNAs. This procedure allowed us to visualize telomere movements, dynamic telomere–telomere associations and dynamic interactions with PML bodies in U2OS cells in time-lapse experiments. We employed the glass bead loading method (McNeil and Werder, 1987) and optimized the PNA probe concentration, to detect specific labeling of telomeres with low background signals. Specific binding of (C3TA2)3 PNA probe to telomeres was confirmed by regular FISH on fixed cells and by colocalization with CFP-tagged TRF2. Importantly, PNA probe binding in living cells did not interfere with cell cycle progression. Considering the large protein complexes that assemble on telomeres to protect them from degradation, we anticipated that PNA probe binding would not significantly hamper telomere movement. Indeed, when we compared the movements of PNA- and CFP–TRF2-tagged telomeres in living cells, we observed no significant differences.
PNA probes have properties that make them particularly suitable for live cell studies. In addition to the fact that PNA–DNA hybrids are more stable than DNA–DNA hybrids, PNA probes are relatively resistant to nucleases while DNA probes are readily degraded in cell nuclei, with a half-life of 15–20 min (Fisher et al., 1993). Recently, fluorescently labeled polyamides were also shown to specifically bind telomere repeats in living cells (Maeshima et al., 2001). These polyamides that contain two hairpin DNA-binding moieties were shown to enter armyworm (Spodoptera frugiperda) derived living cells rapidly when supplied to the culture medium, and to bind to telomeres in a quantitative manner. Because polyamides do not seem to affect cell growth, they might be a good alternative for the use of PNA probes in live cell studies.
Static and dynamic telomeres in mammalian cell nuclei
Our time-lapse experiments revealed that the majority of telomeres move by constrained diffusion in a territory with a radius of ∼0.5 µm, and that some individual telomeres move over significantly larger distances within the period of time over which cells were monitored (typically between 30 and 60 min). These observations seem consistent with results obtained by quantitative motion analysis of subchromosomal foci that incorporated fluorescently labeled nucleotides, although random as well as directional motions of subchromosomal foci were observed (Bornfleth et al., 1999). The picture that emerges from studies addressing chromatin dynamics in mammalian cells is that chromatin in interphase cells is relatively immobile and shows constrained Brownian diffusion in a small submicron-sized nuclear volume (Abney et al., 1997). Nevertheless, significant changes in chromatin positions have been reported in mammalian cells after modulating their transcriptional program (Brown et al., 1999; Tumbar and Belmont, 2001), and also in yeast interphase nuclei (Heun et al., 2001).
Telomere positioning and dynamics have been most extensively studied in yeast. Yeast telomeres were shown to move continuously within a restricted volume by Hediger et al. (2002), which is consistent with human telomere dynamics. GFP-tagged lac operator sites were shown to move with a diffusion constant of 5 × 10⁻⁴ µm2/s in yeast nuclei (Marshall et al., 1997), which is nearly 3-fold faster than the majority of human telomeres, but significantly slower than the very fast moving telomeres. Also, yeast telomeres were shown to move within a slightly smaller radius of <0.3 µm, which may be explained by their tethering to the nuclear periphery. Interestingly, in human cells, telomeres appear to move only slightly faster than fluorescently tagged subchromosomal foci, for which diffusion coefficients range from 0.1 to 1.25 × 10⁻⁴ µm2/s depending on cell type (Bornfleth et al., 1999; Chubb et al., 2002). The most constrained moving population of telomeres were shown to move similar to centromeres in human cells, which is consistent with earlier data showing that the majority of centromeres are rather stationary (Shelby et al., 1996). Recently, it was shown that GFP–heterochromatin protein 1 (HP1) domains, which also include centromeres and telomeres, are relatively immobile in position and move at a velocity of ∼0.14 µm/min (Cheutin et al., 2003). This velocity is only a little slower than that measured for the majority of telomeres, i.e. ∼0.2 µm/min.
Human telomeres could be constrained in their movements by their association with the nuclear matrix (de Lange, 1992) or by their positioning in compact heterochromatic areas. It has been shown that, following nuclear extraction procedures, between 70% and 90% of telomeric DNA is associated with the nuclear matrix (de Lange, 1992; Ludérus et al., 1996; Weipoltshammer et al., 1999), indicating that not all telomeres are necessarily attached to the nuclear matrix at all times. These non-attached telomeres may have the ability to move faster and over larger distances. A reversible association of telomeres with the nuclear matrix could have important implications for the transcriptional states of subtelomeric regions. Association of telomeres with the nuclear matrix might be consistent with the formation of transcriptionally silent heterochromatic microdomains. Therefore it is tempting to speculate that dynamic telomeres, which parted from silent domains, have transcriptionally active subtelomeric genes. Consistent with this speculation is the observation that gene-dense and transcriptionally active chromatin localizes outside chromosome territories in human cells (Mahy et al., 2002).
Implication of dynamic telomere associations
Our data demonstrate that some telomeres associate with others to form clusters. These clusters are not necessarily stable structures, as associating and dissociating telomeres were observed. Telomere clustering appears to be a common phenomenon in a number of organisms, including yeast (Gotta et al., 1996) and Plasmodium falciparum (Freitas-Junior et al., 2000). More recently, a FISH study on fixed cells revealed the occurrence of telomere associations in human cells (Nagele et al., 2001). In this study, the number of telomere associations was increased in replicatively quiescent cells compared with proliferating cells. Therefore, it was suggested that telomere associations play a role in stabilizing chromosome positions in interphase nuclei. Our data show now that these associations can be transient in nature and may therefore play no role in chromosome positioning.
Telomere associations may happen by chance with no obvious consequences for the cell. However, there is increasing evidence that telomere associations provide a possibility for spontaneous recombination of subtelomeric DNA. Such recombinations between heterologous subtelomeric chromosome regions that form clusters have been demonstrated in P.falciparum (Freitas-Junior et al., 2000) and, more recently, it was shown that the subtelomeric regions themselves play an essential role in telomere clustering (Figueiredo et al., 2002). This may also occur in human cells and it is possible that telomere associations in somatic cells are responsible for the high frequency of chromosomal rearrangements in (sub)telomeric regions compared with other parts of the human genome (Cornforth and Eberle, 2001).
Transient association of telomeres with PML bodies
U2OS cells belong to the group of tumor cells that maintain their telomeres by the ALT mechanism. A characteristic feature of ALT cells is that they contain PML bodies in which telomeric DNA and telomere binding proteins colocalize with the PML protein (Yeager et al., 1999). These ALT-associated PML bodies (APBs), which were initially found to be present in only 5% of interphase nuclei within ALT cell lines, were also shown to contain proteins involved in double-strand breaks repair and/or homologous recombination, like RAD51, RAD52 and NBS1 (Yeager et al., 1999; Wu et al., 2000). Moreover, TRF1–NBS1 has been shown to be associated with BrdU foci, consistent with the idea that the telomere lengthening process indeed occurs at PML bodies (Wu et al., 2000, 2003). These observations suggest that telomeres are directed to PML bodies, which are generally immobile (Wiesmeijer et al., 2002) and may act as domains at which the telomeric DNA synthesis machinery is assembled. Further support for this idea comes from the observations that the Bloom syndrome helicase BLM interacts with the telomeric protein TRF2 to promote telomeric DNA synthesis in ALT cells (Stavropoulos et al., 2002). Further understanding of the dynamic association of telomeric DNA with PML bodies and the proteins that are involved may eventually be essential for the design of anticancer drugs directed at ALT cells.
Materials and methods
Cell culture, bead loading and cell transfection
U2OS cells (ATCC HTB-96), HeLa and MS5 mouse cells were grown on coverslips in 3.5-cm Petri dishes (MatTek Corp.) in RPMI 1640, without phenol red, supplemented with 5% fetal calf serum and buffered with 25 mM HEPES buffer to pH 7.2 (Gibco-BRL).
Cy3- and lissamine-labeled (C3TA2)3 PNA probes (DAKO) were dissolved in a buffer containing 80 mM KCl, 10 mM K2PO4, 4 mM NaCl, pH 7.2, to a final concentration of 1 µM. Glass bead loading was then performed as described previously by McNeil and Werder (1987) using 75 µM, alkali-washed, glass beads (Sigma).
Enhanced CFP (ECFP)–PML (Wiesmeijer et al., 2002), GFP–hCENPA (a generous gift of Dr W.A.Bickmore, Edinburgh), GFP–ASF (Molenaar et al., 2001) and CFP–hTRF2 (a generous gift of Dr J.M.Zijlmans, Rotterdam) were transiently expressed in U2OS cells as described previously (Wiesmeijer et al., 2002). For double labeling experiments, cells were labeled with PNA probe 2 days after transfection and imaged ∼2 h later, or cells were labeled with PNA probe first and then transfected with CFP–hTRF2.
Fluorescence in situ hybridization and immunocytochemistry
To confirm the specificity of lissamine- and cy3-labeled, telomere-specific PNA probe, cells were loaded with lissamine-PNA to label telomeres, then fixed in 3.7% formaldehyde containing 5% acetic acid in PBS for 15 min at room temperature and stored in 70% ethanol at 4°C. Before use, fixed cells were washed briefly in de-ionized water, incubated in 0.1% (w/v) pepsin, pH 2.0, for 45 s at 37°C, briefly washed in de-ionized water and dehydrated in a graded series of ethanol. A telomere-specific plasmid probe was labeled with fluorescein-dUTP by nick translation according to standard procedures. The probe was dissolved in 50% de-ionized formamide, 2× SSC (0.3 M NaCl, 0.03 M sodium citrate), 10 mM EDTA, 25 mM NaH2PO4, and 250 ng/µl sheared herring sperm DNA at a final concentration of 5 ng/µl. This mixture was incubated at 70°C for 5 min to denature the probe. Ten microliters of probe were applied to a slide and covered with an 18 × 18 mm coverslip. Hybridization was done at 37°C overnight in a moist chamber. After hybridization, cells were washed three times in 50% formamide, 2× SSC for 5 min each at 37°C, 5 min in SSC, and dehydrated in a graded series of ethanol. Finally, cells were mounted in Vectashield (Vector Laboratories). Nucleoli and Cajal bodies were stained after fixation of cells with mAb anti-fibrillarin as described previously (Snaar et al., 2000).
Time-lapse microscopy and quantitative image analysis
Cells were monitored using a Leica TCS/SP2 confocal microscope system (Wetzlar). During imaging, the temperature of the cells was kept at 37°C by using a temperature-controlled ring (Harvard Apparatus Inc.), which was placed around the culture chamber, and a microscope objective heater (Bioptechs). Twenty cells were analyzed in all experiments. Image stacks cells were acquired using a 100× NA 1.4PL APO lens and analyzed with Leica software. Generally, 16 Z-slices with a thickness of ∼0.5 µm were imaged at every time point. Scanning was performed at a speed of 800 Hz, and the image format was 256 × 256 pixels. The Z-slices were combined in a maximum projection. In the double labeling experiments, CFP and cy3 were sequentially scanned for every Z-slice to avoid cross talk. In addition to fluorescence, differential interference contrast images were recorded to judge nuclear and cellular morphology. Images were processed further using the Leica software and Adobe Photoshop. The mask images showing associations were obtained using the Leica multi-color software.
Quantitative motion analysis of time-lapse image sequences was performed using the TILLvisTRAC image analysis software package (TILL Photonics GmbH). Fluorescent telomere spots were automatically identified by diffusion filtering and adaptive thresholding. For display reasons, only a selection of telomere trajectories is presented in the figures. Average and maximum velocities were obtained using the tracking algorithm as implemented in the TILLvisTRAC software. Positional information of telomeres and centromeres derived from TILLvisTRAC was corrected for cell movement during imaging and used to calculate the MSD as a function of Δt for the individual telomere spots, according to Vazquez et al. (2001) using in-house-developed data analysis software. Cell movements were determined by calculating the average displacement of x and y positions of all slow-moving telomere spots: d = √(average Δx2 + average Δy2). We found that the MSD values were only valid for Δt-values up to 50% of the entire collection period. At higher Δt values, statistical fluctuations resulted in increasing errors in the MSD values (Vazquez et al., 2001). Diffusion coefficients were estimated from the initial slopes of the MSD plots using D = MSD/4Δt. The radii of constraint were estimated from the plateau values of the MSD plots, according to Saxton et al (1993), using the formula: lim(Δt → ∞) MSD(Δt) ≈ R2. We multiplied the calculated R-values by √(3/2) in order to correct for the fact that distances were measured in two rather then three dimensions (Chubb et al., 2002).
Supplementary data
Supplementary data are available at The EMBO Journal Online.
Acknowledgments
Acknowledgements
We thank T.Andresen at DAKO, Glostrup, for providing PNA probes, W.Bickmore for providing the GFP–hCENPA construct, T.de Lange for providing a telomere-specific plasmid probe, M.J.Zijlmans for providing the CFP–hTRF construct and J.J.Boei for providing the MS5 mouse cell line. We are also thankful to David Baker for critical reading of the manuscript. Furthermore, the contribution of the reviewers of this manuscript is much appreciated. This work was supported by the Dutch Scientific Organization NWO program ‘4D imaging of living cells and tissues’ (grant no. 901-34-144).
References
- Abney J.R., Cutler,B., Fillbach,M.L., Axelrod,D. and Scalettar,B.A. (1997) Chromatin dynamics in interphase nuclei and its implications for nuclear structure. J. Cell Biol., 137, 1459–1468. [DOI] [PMC free article] [PubMed] [Google Scholar]
- Azzalin C.M., Nergadze,S.G. and Giulotto,E. (2001) Human interchromosomal telomeric-like repeats: sequence organization and mechanisms of origin. Chromosoma, 110, 75–82. [DOI] [PubMed] [Google Scholar]
- Baur J.A., Zou,Y., Shay,J.W. and Wright,W.E. (2001) Telomere position effect in human cells. Science, 292, 2075–2077. [DOI] [PubMed] [Google Scholar]
- Bornfleth H., Edelmann,P., Zink,D., Cremer,T. and Cremer,C. (1999) Quantitative motion analysis of subchromosomal foci in living cells using four-dimensional microscopy. Biophys. J., 77, 2871–2886. [DOI] [PMC free article] [PubMed] [Google Scholar]
- Brown K.E., Baxter,J., Graf,D., Merkenschlager,M. and Fisher,A.G. (1999) Dynamic repositioning of genes in the nucleus of lymphocytes preparing for cell division. Mol. Cell, 3, 207–217. [DOI] [PubMed] [Google Scholar]
- Cheutin T, McNair,A.J., Jenuwein,T., Gilbert,D.M., Singh,P.B. and Misteli,T. (2003) Maintenance of stable heterochromatin domains by dynamic HP1 binding. Science, 299, 721–725. [DOI] [PubMed] [Google Scholar]
- Chubb JR., Boyle,S., Perry,P. and Bickmore,W.A. (2002) Chromatin motion is constrained by association with nuclear compartments in human cells. Curr. Biol., 12, 439–445. [DOI] [PubMed] [Google Scholar]
- Cornforth M.N. and Eberle,R.L. (2001) Termini of human chromosomes display elevated rates of mitotic recombination. Mutagenesis, 16, 85–89. [DOI] [PubMed] [Google Scholar]
- Cryderman D.E., Morris,E.J., Biessmann,H., Elgin,S.C.R. and Wallrath,L.L. (1999) Silencing at Drosophila telomeres: nuclear organization and chromatin structure play critical roles. EMBO J., 18, 3724–3735. [DOI] [PMC free article] [PubMed] [Google Scholar]
- de Lange T. (1992) Human telomeres are attached to the nuclear matrix. EMBO J., 11, 717–724. [DOI] [PMC free article] [PubMed] [Google Scholar]
- de Pauw E.S.D., Verwoerd,N.P., Duinkerken,N., Willemze,R., Raap,A.K., Fibbe,W.E. and Tanke,H.J. (1998) Assesment of telomeric length in hematopoietic interphase cells using in situ hybridization and digital fluorescence microscopy. Cytometry, 32, 163–169. [DOI] [PubMed] [Google Scholar]
- Dunham M.A., Neumann,A.A., Fasching,C.L. and Reddel,R.R. (2000) Telomere maintenance by recombination in human cells. Nat. Genet., 26, 447–450. [DOI] [PubMed] [Google Scholar]
- Espejel S., Franco,S., Rodriguez-Perales,S., Bouffler,S.D., Cigudosa,J.C. and Blasco,M.A. (2002) Mammalian Ku86 mediates chromosomal fusions and apoptosis caused by critically short telomeres. EMBO J., 21, 2207–2219. [DOI] [PMC free article] [PubMed] [Google Scholar]
- Ferguson M. and Ward,DC. (1992) Cell cycle dependent chromosomal movement in pre-mitotic human T-lymphocyte nuclei. Chromosoma, 101, 557–565. [DOI] [PubMed] [Google Scholar]
- Figueiredo L.M., Freitas-Junior,L.H., Bottius,E., Olivo-Marin,J.-C. and Scherf,A. (2002) A central role for Plasmodium falciparum subtelomeric regions in spatial positioning and telomere length regulation. EMBO J., 21, 815–824. [DOI] [PMC free article] [PubMed] [Google Scholar]
- Fisher T.L., Terhorst,T., Cao,X. and Wagner,R.W. (1993) Intracellular disposition and metabolism of fluorescently-labeled unmodified and modified oligonucleotides microinjected into mammalian cells. Nucleic Acids Res., 21, 3857–3865. [DOI] [PMC free article] [PubMed] [Google Scholar]
- Flint J., Wilkie,A., Buckle,V., Winter,R., Holland,A. and McDermid,H. (1995) The detection of subtelomeric chromosomal rearrangements in idiopathic mental retardation. Nat. Genet., 9, 132–139. [DOI] [PubMed] [Google Scholar]
- Freitas-Junior L.H., Bottius,E., Pirrit,L.A., Deitsch,K.W., Scheidig,C., Guinet,F., Nehrbass,U., Wellems,T.E. and Scherf,A. (2000) Frequent ectopic recombination of virulence factor genes in telomeric chromosome clusters of P.falciparum. Nature, 407, 1018–1022. [DOI] [PubMed] [Google Scholar]
- Gotta M., Laroche,T., Formenton,A., Maillet,L., Scherthan,H. and Gasser,S.M. (1996) The clustering of telomeres and colocalization with Rap1, Sir3, and Sir4 proteins in wild-type Saccharomyces cerevisiae. J. Cell Biol., 134, 1349–1363. [DOI] [PMC free article] [PubMed] [Google Scholar]
- Gottschling D.E., Aparicio,O.M., Billington,B.L. and Zakian,V.A. (1990) Position effect at S. cerevisiae telomeres: reversible repression of Pol II transcription. Cell, 63, 751–762. [DOI] [PubMed] [Google Scholar]
- Hediger F., Neumann,F.R., Van Houwe,G., Dubrana,K. and Gasser,S.M. (2002) Live imaging of telomeres: yKu and Sir proteins define redundant telomere-anchoring pathways in yeast. Curr. Biol., 12, 2076–2089. [DOI] [PubMed] [Google Scholar]
- Henderson S., Allsopp,R., Spector,D.L., Wang,S,S. and Harley,C. (1996) In situ analysis of changes in telomere size during replicative aging and cell transformation. J. Cell Biol., 134, 1–12. [DOI] [PMC free article] [PubMed] [Google Scholar]
- Henson J.D., Neuman,A.A., Yeager,T.R. and Reddel,R.R. (2002) Alternative lengthening of telomeres in mammalian cells. Oncogene, 21, 598–610. [DOI] [PubMed] [Google Scholar]
- Heun P., Laroche,T., Shimada,K., Furrer,P. and Gasser,S.M. (2001) Chromosome dynamics in the yeast interphase nucleus. Science, 294, 2181–2186. [DOI] [PubMed] [Google Scholar]
- Hsu H.-L. et al. (2000) Ku acts in a unique way at the mammalian telomere to prevent end joining. Genes Dev., 14, 2807–2812. [DOI] [PMC free article] [PubMed] [Google Scholar]
- Koering C.E. et al. (2002) Human telomeric position effect is determined by chromosomal context and telomeric chromatin integrity. EMBO Rep., 3, 1055–1061. [DOI] [PMC free article] [PubMed] [Google Scholar]
- Lansdorp P.M., Verwoerd,N.P., van de Rijke,F.M., Dragowska,V., Little,M.-T., Dirks,R.W., Raap,A.K. and Tanke,H.J. (1996) Heterogeneity in telomere length of human chromosomes. Hum. Mol. Genet., 5, 685–691. [DOI] [PubMed] [Google Scholar]
- Laroche T., Martin,S.G., Gotta,M., Gorham,H.C., Pryde,F.E., Louis,E.J. and Gasser,S.M. (1998) Mutation in yeast Ku genes disrupts the subnuclear organization of telomeres. Curr. Biol., 8, 653–656. [DOI] [PubMed] [Google Scholar]
- Ludérus M.E.E., van Steensel,B., Chong,L., Sibon,O.C.M., Cremers,F.F.M. and de Lange,T. (1996) Structure, subnuclear distribution, and nuclear matrix association of the mammalian telomeric complex. J. Cell Biol., 135, 867–881. [DOI] [PMC free article] [PubMed] [Google Scholar]
- Maeshima K., Janssen,S. and Laemmli,U.K. (2001) Specific targeting of insect and vertebrate telomeres with pyrrole and imidazole polyamides. EMBO J., 20, 3218–3228. [DOI] [PMC free article] [PubMed] [Google Scholar]
- Mahy N.L., Perry,P.E. and Bickmore,W.A. (2002) Gene density and transcription influence the localization of chromatin outside of chromosome territories detectable by FISH. J. Cell Biol., 159, 753–763. [DOI] [PMC free article] [PubMed] [Google Scholar]
- Marshall W.F., Straight,A., Marko,J.F., Swedlow,J., Dernburg,A., Belmont,A., Muray,A.W., Agard,D.A. and Sedat,J.W. (1997) Interphase chromosomes undergo constrained diffusional motion in living cells. Curr. Biol., 7, 930–939. [DOI] [PubMed] [Google Scholar]
- McNeil P.L. and Werder,E. (1987) Glass beads load macromolecules into living cells. J. Cell Sci., 88, 669–678. [DOI] [PubMed] [Google Scholar]
- Molenaar C., Marras,S.A., Slats,J.C., Truffert,J.C., Lemaitre,M,. Raap,A.K., Dirks,R.W. and Tanke,H.J. (2001) Linear 2′O-Methyl RNA probes for the visualization of RNA in living cells. Nucleic Acids Res., 29, E89. [DOI] [PMC free article] [PubMed] [Google Scholar]
- Nagele R.G., Velasco,A.Q., Anderson,W.J., McMahon,D.J., Thomson,Z., Fazekas,J., Wind,K. and Lee,H. (2001) Telomere associations in interphase nuclei: possible role in maintenance of interphase chromosome topology. J. Cell Sci., 114, 377–388. [DOI] [PubMed] [Google Scholar]
- Nimmo E.R., Cranston,G. and Allshire R.C. (1994) Telomere-associated chromosome breakage in fission yeast results in variegated expression of adjacent genes. EMBO J., 13, 3801–3811. [DOI] [PMC free article] [PubMed] [Google Scholar]
- Ning Y., Xu,J.-F., Li,Y., Chavez,L., Riethman,H.C., Lansdorp,P.M. and Weng,N.-P. (2003) Telomere length and the expression of natural telomeric genes in human fibroblasts. Hum. Mol. Genet., 12, 1329–1336. [DOI] [PubMed] [Google Scholar]
- Saxton M.J. (1993) Lateral diffusion in an archipelago: single-particle diffusion. Biophys. J., 64, 1766–1780. [DOI] [PMC free article] [PubMed] [Google Scholar]
- Scheel S. et al. (2001) Alternative lengthening of telomeres is associated with chromosomal instability in osteosarcomas. Oncogene, 20, 3835–3844. [DOI] [PubMed] [Google Scholar]
- Shelby R.D., Hahn,K.M. and Sullivan,K.F. (1996) Dynamic elastic behavior of α-satellite DNA domains visualized in situ in living human cells. J. Cell Biol., 135, 545–557. [DOI] [PMC free article] [PubMed] [Google Scholar]
- Snaar S., Wiesmeijer,K., Jochemsen,A.G., Tanke,H.J. and Dirks,R.W. (2000) Mutational analysis of fibrillarin and its mobility in living human cells. J. Cell Biol., 151, 653–662. [DOI] [PMC free article] [PubMed] [Google Scholar]
- Stavropoulos D.J., Bradshaw,P.S., Li,X., Pasic,I., Truong,K., Ikura,M., Ungrin,M. and Meyn,M.S. (2002). The Bloom syndrome helicase BLM interacts with TRF2 in ALT cells and promotes telomeric DNA synthesis. Hum. Mol. Genet., 11, 3135–3144. [DOI] [PubMed] [Google Scholar]
- Tumbar T. and Belmont,A.S. (2001) Interphase movements of a DNA chromosome region modulated by VP16 transcriptional activator. Nat. Cell Biol., 3, 134–139. [DOI] [PubMed] [Google Scholar]
- Tvaruskó W., Bentele,M., Misteli,T., Rudolf,R., Kaether,C., Spector,D.L., Gerdes,H.H. and Eils,R. (1999) Time-resolved analysis and visualization of dynamic processes in living cells. Proc. Natl Acad. Sci. USA, 96, 7950–7955. [DOI] [PMC free article] [PubMed] [Google Scholar]
- van Overveld P.G.M., Lemmers,R.J.F.L., Deidda,G., Sandkuijl,L., Padberg,G.W., Frants,R.R. and van der Maarel,S.M. (2000) Interchromosomal repeat array interactions between chromosomes 4 and 10: a model for subtelomeric plasticity. Hum. Mol. Genet., 9, 2879–2884. [DOI] [PubMed] [Google Scholar]
- Vazquez J., Belmont,A.S. and Sedat,J.W. (2001) Multiple regimes of constrained chromosome motion are regulated in the interphase Drosophila nucleus. Curr. Biol., 11, 1227–1239. [DOI] [PubMed] [Google Scholar]
- Weipoltshammer K., Schöfer,C., Almeder,M., Philimonenko,V.V., Frei,K., Wachtler,F. and Hozák,P. (1999) Intranuclear anchoring of repetitive DNA sequences: centromeres, telomeres, and ribosomal DNA. J. Cell Biol., 147, 1409–1418. [DOI] [PMC free article] [PubMed] [Google Scholar]
- Wiesmeijer K., Molenaar,C., Bekeer,I.M.L.A., Tanke,H.J. and Dirks,R.W. (2002) Mobile foci of Sp100 do not contain PML: PML bodies are immobile but PML and Sp100 proteins are not. J. Struct. Biol., 140, 180–188. [DOI] [PubMed] [Google Scholar]
- Wu G., Lee,W.-H., and Chen,P.-L. (2000) NBS1 and TRF1 colocalize at promyelocytic leukemia bodies during late S/G2 phases in immortalized telomerase-negative cells. J. Biol. Chem., 275, 30618–30622. [DOI] [PubMed] [Google Scholar]
- Wu G., Jiang,X., Lee,W.-H. and Chen,P.-L. (2003) Assembly of functional ALT-associated promyelocytic leukemia bodies requires Nijmegen breakage syndrome 1. Cancer Res., 63, 2589–2595. [PubMed] [Google Scholar]
- Yeager T.R., Neumann,A.A., Englezou,A., Huschtscha,L.I., Noble,J.R. and Reddel,R.R. (1999) Telomerase-negative immortalized human cells contain a novel type of promyelocytic leukemia (PML) body. Cancer Res., 59, 4175–4179. [PubMed] [Google Scholar]
- Zijlmans J.M., Martens,U.M., Poon,S.S., Raap,A.K., Tanke,H.J., Ward,R.K. and Lansdorp,P.M. (1997) Telomeres in the mouse have larger inter-chromosomal variations in the number of T2AG3 repeats. Proc. Natl Acad. Sci. USA, 94, 7423–7428. [DOI] [PMC free article] [PubMed] [Google Scholar]


