Abstract
The biophysical effects of blood flow are known to influence the structure and function of adult cardiovascular systems. Similar effects on the maturation of the cardiovascular system have been difficult to directly and non-invasively measure due to the small size of the embryo. Optical coherence tomography (OCT) has been shown to provide high spatial and temporal structural imaging of the early embryonic chicken heart. We have developed an extension of Doppler OCT, called spectral Doppler velocimetry (SDV), that will enable direct, non-invasive quantification of blood flow and shear rate from the early embryonic cardiovascular system. Using this technique, we calculated volumetric flow rate and shear rate from chicken embryo vitelline vessels. We present blood flow dynamics and spatial velocity profiles from three different vessels in the embryo as well as measurements from the outflow tract of the embryonic heart tube. This technology can potentially provide spatial mapping of blood flow and shear rate in embryonic cardiovascular structures, producing quantitative measurements that can be correlated with gene expression and normal and abnormal morphology.
Keywords: imaging, Doppler, optical coherence tomography
Introduction
Shear stress produced by flow of blood through vasculature is a well known stimulus for gene expression in endothelial cells (for review, see (Chien, 2007)). Regulation of genes in the endothelial lining can then alter vascular smooth muscle function (Harrison et al., 2006). Shear stress has also been shown to alter cellular identity of mesenchymal stem cells in vitro (Wang et al., 2005). Blood flow, therefore, has a powerful influence on cellular expression and identity. It has been shown that blood flow in the early embryonic heart influences the morphology of the developing heart (Hove et al., 2003; Ursem et al., 2004). Abnormal shear stress has been shown to change expression of genes in the endocardium of the embryo (Groenendijk et al., 2005). However, alterations of flow and shear stress induced by venous ligation could not be measured directly because technology has not existed that would permit accurate, non-invasive measurements in such small systems at the early stage of development during which the ligature was applied. Micro particle image velocimetry techniques have been used for whole-field velocity measurements in embryonic avian hearts as early as HH 15 (Vennemann et al., 2006) and more recently in extra embryonic vessels of an HH 18 chick (Lee et al., 2007). Doppler ultrasound has also recently been reported for non-invasive investigations of atrio-ventricular valve formation in HH 9-39 embryonic chicken hearts (Butcher et al., 2007), however limitations of spatial resolution limit identification of structural features at stages younger than HH 17 (Butcher et al., 2007; (McQuinn et al., 2007).
Optical coherence tomography (OCT) is a non-invasive imaging technique that provides cross-sectional images of biological tissue based on low-coherence interferometry (Huang et al., 1991). Recent developments in OCT technology, called Fourier-domain OCT, which includes swept-source and spectrometer based spectral-domain OCT (SDOCT), has enabled imaging at rates greater than 300,000 lines per second with maintained image quality (Fercher et al., 1995; Choma et al., 2003; Leitgeb et al., 2003; Huber et al., 2006). The high resolution (2–20 µm) and up to 2 mm imaging depth capability of OCT makes it well suited for imaging embryonic cardiovasculature in small animals (Boppart et al., 1997; Yelbuz et al., 2002; Jenkins et al., 2006; Luo et al., 2006). Also, recent demonstrations show promising application of high-speed OCT imaging of chick heart structure to study heart dynamics in four dimensions (4D = volume and time) (Jenkins et al., 2007). A functional extension of OCT, called “Doppler OCT” (DOCT) can be used to measure Doppler frequency shifts caused by motion or fluid flow (Yazdanfar et al., 1997; Wang et al., 2004; Mariampillai et al., 2007). Measurements of flow-induced shear rate in capillary tubes have also been demonstrated using DOCT (van Leeuwen et al., 1999). Here we describe an extension of DOCT called “spectral Doppler velocimetry” (SDV) which provides spatially-resolved non-invasive quantitative measurement of blood flow with high temporal resolution. In this paper we describe the SDV technique, associated challenges, and demonstrate its capability by measuring in vivo blood flow through extraembryonic vasculature in the HH17 chicken embryo. From the SDV measurements we calculate the volumetric flow rate and shear rate from a known location in each vessel. We present blood flow dynamics and spatial velocity profiles from three different vessels in the embryo as well as preliminary measurements from the outflow tract of an HH 16 chicken embryo heart. This technology enables simultaneous correlation of blood flow with the dynamic expansion and contraction of the heart tube. Also, it can potentially provide spatial mapping of blood flow and shear rate in embryonic cardiovascular structures. These measurements could then be correlated with gene expression and normal and abnormal structural developments.
Methods
Doppler SDOCT Microscope System
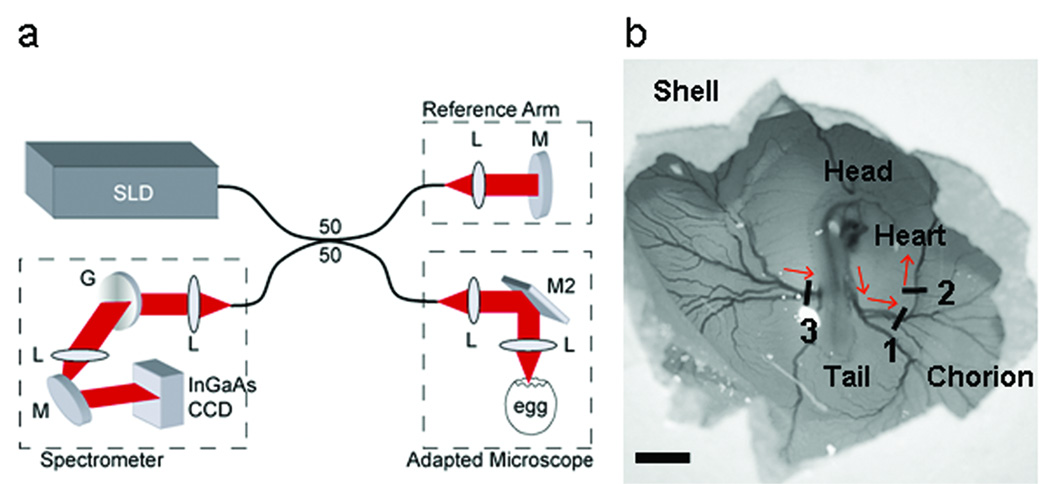
We used an SDOCT system operating at 18.9 kHz A-scan rate (Fig. 1a) (Yun et al., 2003). “A-scan” refers to acquisition of a single line of data through the depth of the animal. When the A-scan is viewed with time on the x-axis (over time), this produces an M-mode image. The light source consisted of a super luminescent diode (InPhenix) with center wavelength at 1310 nm (Δλ=84 nm full-width half-maximum). Sample arm light was coupled into the optical path of a stereo-zoom microscope (Zeiss) modified for 2D lateral scanning of the beam across the vessel. The interferogram (the result of interaction of the reference beam and the reflected beam from the microscope, Figure 1a) was detected using a custom made spectrometer with a 512 pixel InGaAs CCD camera (512LX, Sensors Unlimited). The system was driven by high-performance software that controlled the dual-axis scanner in the microscope and performed data acquisition, DC subtraction, re-scaling of the interferogram from wavelength to wavenumber, correction of group velocity dispersion mismatch between the reference and sample arms, fast-Fourier transform, display, and data archiving in real time (Bioptigen, Inc.). The measured signal-to-noise ratio from an ideal reflector (mirror with calibrated 44 dB attenuation) was 100 dB with 5 mW total optical power on the sample. This system acquires, processes, and displays 512 × 500 pixel B-mode (depth vs lateral position) images at 38 frames per second and 512 × 256 pixel DOCT images at 18 frames per second. The depth resolution (maintained along the entire depth) and lateral resolution (at the focus) is approximately 12 µm and the maximum imaging depth is 2.0 mm (air), which is sufficient for imaging embryonic structures during early development.
Figure 1.
Spectral domain optical coherence tomography (SDOCT) microscope system. (a) SDOCT system setup. A low-coherence light source (λ=1310 nm) was used in a fiber based Michelson interferometer design where the optical power was split using a 50/50 coupler into reference and sample arms. The interferogram was measured using a custom-made spectrometer containing a 512 element InGaAs CCD detector (Sensors Unlimited). (b) Scanning of the SDOCT beam across three vessels was performed using an adapted Zeiss stereo zoom microscope. Red arrows indicate direction of blood flow. SLD, superluminescent diode (InPhenix); L, lens; M, mirror; M2, dual-axis scanning mirror (Optics in Motion); G, grating (Wasatch). Scale bar = 5 mm.
Experimental Methods
We incubated fertilized Hubert Ross chicken eggs, blunt-end up at 38°C for 72 hours. Immediately prior to imaging, a small window was created through the outer shell and chorionic membrane to gain optical access to the live embryo (Fig. 1b). The egg was removed from the incubator and Doppler B-mode, SDV measurement and volume datasets were acquired across the three numbered vessels shown in Figure 1b. Each recording session required less than 2 minutes. The egg was placed back in the incubator for 5 minutes between imaging each vessel as a pre-emptive measure to ensure the embryo had a consistent heart rate for each measurement. The heart rate was monitored based on imaging the pulse rate of blood flow through the vessel of interest. In a preliminary study, we also acquired SDV measurements from the outflow tract of an HH 16 chicken embryo heart tube.
This system was originally developed for measurements of blood flow through younger embryonic heart tubes. It became apparent that measurements of flow through simpler, linear extraembryonic vessels would be necessary to interpret the more complex flow through the anatomically dynamic heart. The data presented here reflects the validation and measurements on linear embryonic vessels. Comprehensive measurements and analysis of the more complex cardiac flow is in preparation.
Doppler OCT Imaging
For B-mode DOCT imaging, four A-scans at each lateral position on the sample were acquired followed by real-time calculation and normalized color display of the Doppler frequency shift,
| (1) |
Here, Δφ is the average phase shift over the four A-scans and T is the integration time of the 512 pixel InGaAs CCD camera (52.8 µs). The minimum Doppler frequency shift detectable by this system is 21 Hz. This value indicates the lowest detectable Doppler frequency that can be resolved from the phase noise of the system and limits detection of flow that occurs in the micro-or neo- vasculature. The maximum detectable Doppler frequency shift occurs when Δφ = 2Π or is equal to 1/T which for this system is 19 kHz. Flow velocities that produce a Doppler frequency shift greater than 19 kHz will cause a 2Π phase shift or phase wrapping artifact will be addressed in further detail below.
Spectral Doppler Velocimetry
SDV is a technique we developed to study flow dynamics at a user-defined spatial location in the sample in conjunction with B-mode DOCT imaging. This technique is analogous to pulsed wave (or spatially gated) Doppler ultrasound which is widely used to study blood flow through the embryonic cardiovascular system (Phoon et al., 2002). Since SDV stems from DOCT images (Yazdanfar et al., 1997), an advantage of this technique over pulsed wave Doppler ultrasound is that it is depth-resolved. This means that SDV provides hemodynamic measurement at all depths simultaneously, rather than averaged over a focal volume. SDV is measured by acquiring Doppler M-mode (depth or A-scans vs. time) from a user defined location in the sample at a rapid rate (4.7 kHz). The blood flow velocity is calculated as a function of time, V(t) using the following equation:
| (2) |
where n is the optical index of refraction of the sample (1.33), θ is the angle of flow relative to the OCT scanning beam, λ is the center wavelength of the light source (1310 nm), and fD (t) is the Doppler frequency shift determined by Equation (1).
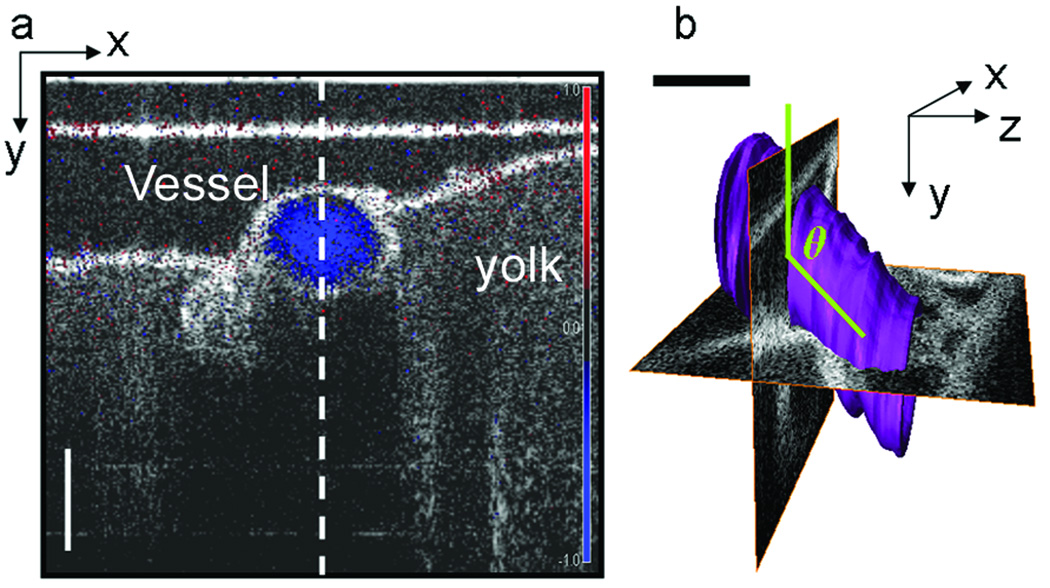
Accurate quantification of flow velocity cannot be made using a single B-mode image (Fig. 2a), unless the vessel is oriented so that the direction of flow lies in the plane of the OCT beam scan (this would be equivalent to the y-z plane in Fig. 2b). To measure the angle of flow independent of the orientation of the sample, volume images were also acquired at each SDV location. The volume datasets were manually reconstructed using Amira software package (Mercury Systems, Inc.). Then, using the volume renderings, the angle of the center of the vessel lumen relative to the OCT scanning beam was measured (Fig. 2b).
Figure 2.
SDV measurement and volume rendering of chicken embryo vessel. (a) Doppler OCT image (blue) superimposed on and SDOCT intensity image of a cross-section of Vessel 2. The vertical dotted line indicates the location SDV measurements were acquired. (b) 3D volume rendering of Vessel 2. The volume rendering is used to measure the angle of blood flow (green), relative to the OCT scanning beam. Here we have displayed two orthogonal OCT planes where the x-y plane corresponds to the image shown in (a). Scale bar = 200 µm.
Phase unwrapping
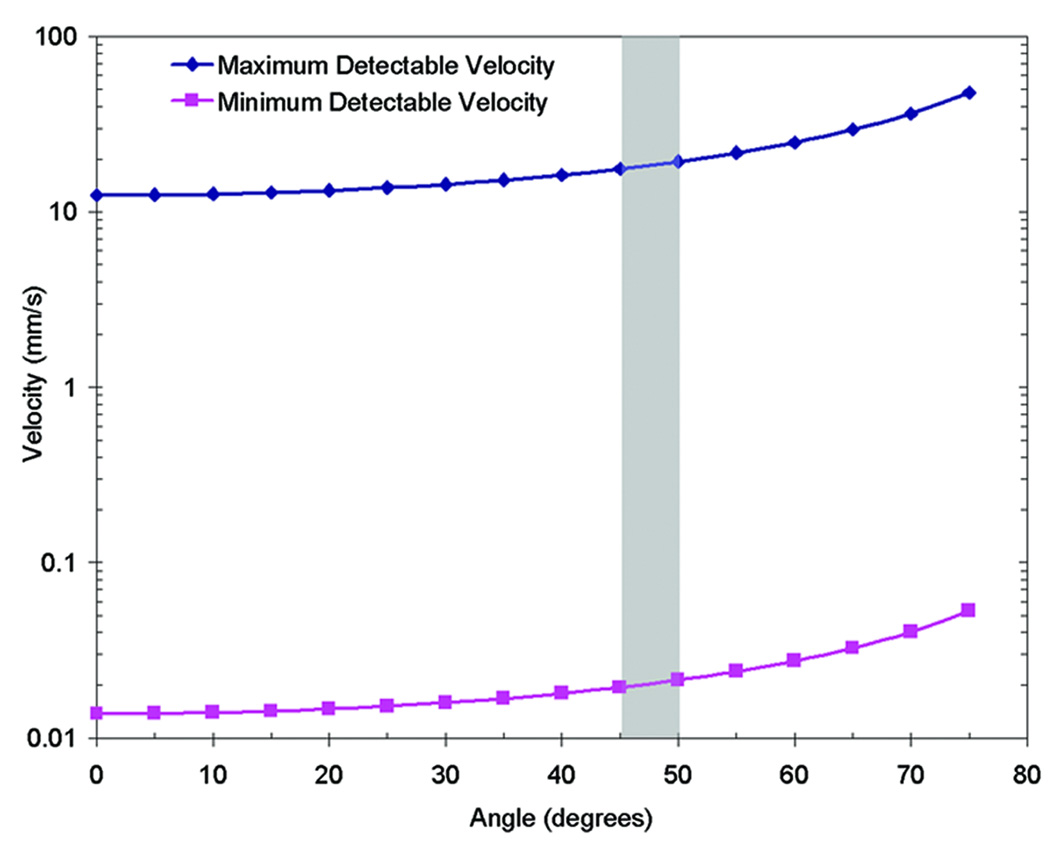
DOCT measurements are constrained by the integration time of the system, where the integration time is set by the readout time of the CCD camera. When flow rates are faster than the integration time, the measured signal becomes phase-wrapped and velocity is not uniquely extractable from the phase. Phase wrapped DOCT images appear to have “rings” of positive (red) and negative (blue) frequency shifts, as is seen in Figure 6a. To address this artifact, the Doppler measurements were low-pass filtered to reduce the phase noise and previously described two-dimensional phase-unwrapping algorithms were implemented in the SDV measurements (Ghiglia and Pritt, 1998). Figure 3 contains a plot of the minimum and maximum velocity detectable by the system for all flow angles, based on Equation (2). In this demonstration the vessels usually ran between 45 and 50 degrees relative to the OCT beam which corresponds to a maximum velocity range between 13 and 14.5 mm/s.
Figure 6.
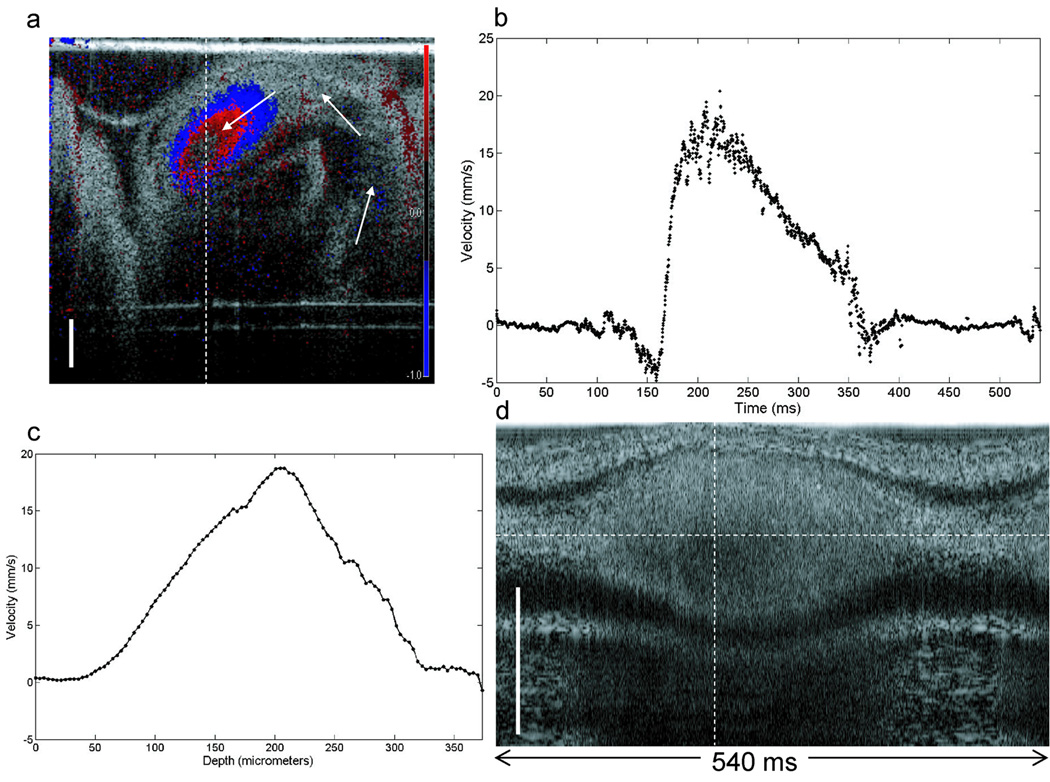
Blood flow measurement from outflow tract of HH 16 chicken embryo heart tube. (a) Doppler OCT image superimposed over SDOCT image of the primitive ventricle and outflow tract of the embryonic heart tube. Blood flows in the direction of the solid arrows. The blue-red ring is an artifact caused by phase wrapping. The DOCT signal appears to disappear in the center of the color-Doppler image because the wrapped signal at those locations results in a zero phase shift. Published unwrapping algorithms were implemented to resolve the actual phase shift and quantify blood flow velocity in (b) and (c). SDV measurements were acquired along the dotted vertical line. (b) The blood flow velocity dynamics from the center of the outflow tract shows negative, or backward, flow prior to the rapid ejection of blood. (c) Blood flow velocity profile measured along the dotted vertical line in (d). (d) M-mode OCT image of the outflow tract during the heart beat cycle shown in (b). This image used in conjunction with (b) show the relationship between the outflow tract opening with blood flow through the same location. Scale bar = 250 µm.
Figure 3.
Detectable flow velocity range. The minimum and maximum detectable flow velocity is dependent on the angle of flow relative to the OCT scanning beam, as expressed in Equation 2. Here is a plot of the maximum velocity detectable by the 19 kHz 1310 nm SDOCT system, suffering from no phase wrapping artifacts. In this study the flow angles were between 45 and 50 degrees.
Determining Vessel Diameter, Volumetric Flow Rate, and Shear Rate. The diameter of the vessels were measured using B-mode (two dimensional) and M-mode (one dimensional) datasets that were acquired at the same location as SDV measurements. The two diameter measurements were averaged where the difference between the two measurements for all three vessels was always less than 12 µm. Volumetric flow rate was calculated assuming fully developed laminar flow (Lee et al., 2007) and that the vessels and heart tube were cylindrical with a circular cross-section using the following equation:
| (3) |
Where Q is the volumetric flow rate, R is the vessel radius, and Vmax is the maximum blood flow velocity along the vessel cross-section. The shear rate is defined as (van Leeuwen et al., 1999):
| (4) |
Where τ is the shear rate (s−1) and ∂V/∂R is the change in blood flow velocity over a known radial distance, adjacent to the vessel wall. ∂V/∂R was determined by measuring the slope of the velocity rise over 25 µm from the edge of the vessel wall using the spatial velocity profile, at a time in the heartbeat cycle when the blood flow velocity was maximum.
Validation
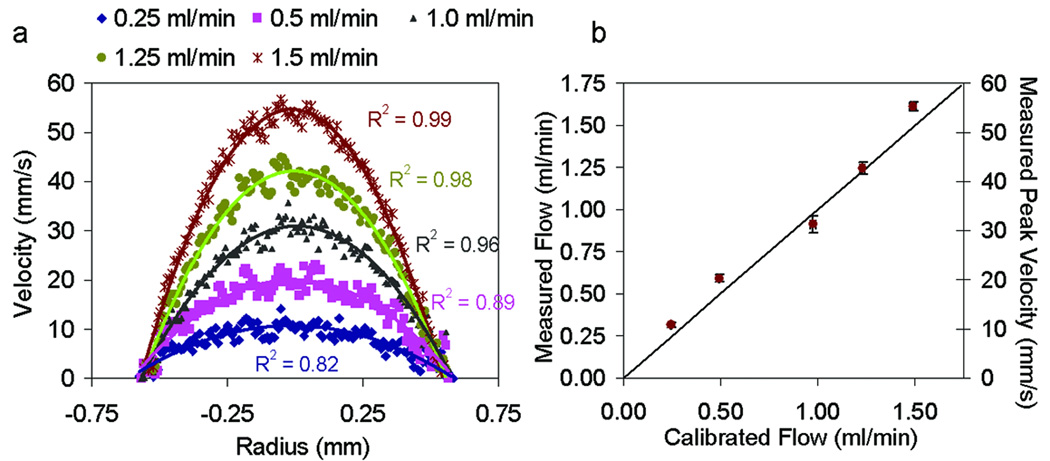
To test the accuracy of velocity and flow measurements using DOCT we measured flow of 10% Intralipid through a 1.2 mm inner diameter glass capillary tube at five different flow rates. The flow rate was controlled using a Harvard Apparatus syringe pump where we varied the flow rate between 0.25 ml/min and 1.5 ml/min. To calculate the flow rate, we plotted the average cross-sectional velocity profile from five DOCT images, for each rate. A second-order polynomial fit to each averaged profile provided the peak velocity (Vmax) used in Eq. 3. The measured and fitted velocities profiles for each flow rate is shown in Fig. 4a. Figure 4b shows a comparison between the measured flow using DOCT and the calibrated flow from the syringe pump. Syringe pump calibration was performed by measuring the volume of fluid which flowed through the system for a given amount of time. For each flow rate, calibration was performed three times. The average flow rates and standard deviations for both the Doppler and calibrated flow measurements is provided (Fig. 4b). The vertical standard deviation was calculated between the flow rate averaged from five DOCT images and the flow rate measured using each individual frame. Phase unwrapping algorithms were performed on DOCT measurements at flow rates of 1 ml/min, 1.25 ml/min, and 1.5 ml/min which correspond to peak velocities between 30 mm/s and 55 mm/s.
Figure 4.
Validation of Doppler flow measurements. Doppler measurements were acquired of 10% intralipid flowed through a 1.2 mm inner diameter capillary tube at rates of 0.25 ml/min, 0.5 ml/min, 1.0 ml/min, 1.25 ml/min and 1.5 ml/min (a) Averaged Doppler velocity profiles (dotted) and corresponding quadratic fit (solid line) at each flow rate. R2 values are provided for each fit. (b) Comparison of measured and calibrated flow rates.
Results
In vivo Doppler and three-dimensional OCT images were acquired from three blood vessels in an HH 17 chick embryo. Figure 2a contains a normalized color Doppler OCT image of blood flow through the cross-section of Vessel 2 superimposed over a B-mode OCT structural image. The red or blue of the DOCT image corresponds to blood flow in the direction towards or away from the incident OCT beam. The intensity of the grayscale structural image correlates to the reflectivity of the microstructures in the tissue. The dotted line in Figure 2a indicates the A-scan location of SDV measurement. SDV measurements were taken along the center of all three vessels as illustrated in Figure 2a. Figure 2b is a volumetric rendering of Vessel 2 (purple) with two orthogonal OCT cross-sectional images. The x-y plane pinpoints the location of the SDV measurement within the 3D vessel structure. This plane is the same as Figure 2a. The angle of flow relative to the OCT beam is measured using similar volume renderings for all three vessels.
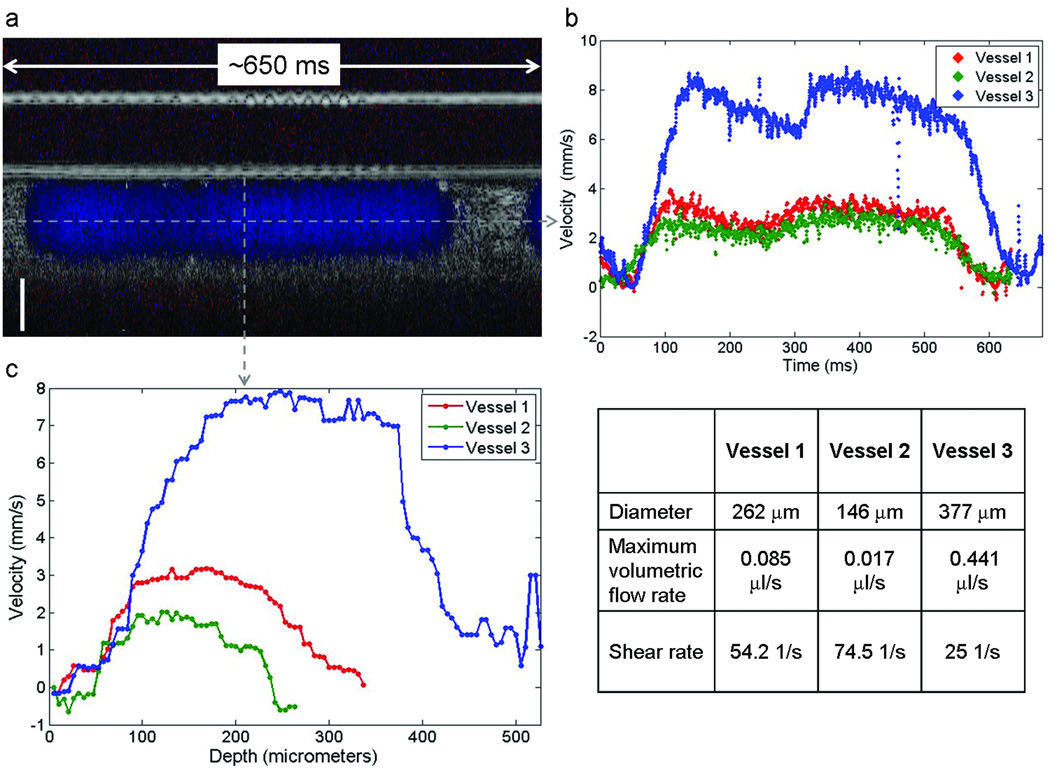
Blood flow velocity dynamics and the spatial velocity profile of the three vessels are shown in Figure 5. An example Doppler M-mode (depth – y-axis vs. time – x-axis) image from Vessel 2 is shown in Figure 5a. As in Figure 2a, the normalized color Doppler is superimposed over OCT A-scans collected over time, from the same location in the vessel. A plot of the Doppler measurement from the center of the vessel as a function of time provides information on the blood flow dynamics in the vessel (Fig. 5b). Velocity as a function of time in each vessel was calculated using Equation (2). This plot provides time-resolved velocity measurements of blood flow through Vessel 1 (red), Vessel 2 (green), and Vessel 3 (blue). The initial time for each measurement was arbitrarily chosen at a point when the velocity was near zero. These plots show the increase in velocity as blood passes through the SDV line of interrogation. Peak velocities were approximately 3.1, 2.0, and 8.0 mm/s for Vessel 1, Vessel 2, and Vessel 3, respectively; and the velocity drops to zero at times correlating to diastole. The blood velocity rates are on the order of those measured using micro particle image velocimetry (Lee et al., 2007). These results are also consistent with the expectation that peak blood flow velocities decrease in peripheral vessels further downstream from the heart. The vitelline vessel (Vessel 3) is a major blood vessel that connects to the dorsal aorta and where we measured velocity flow rates over 2.5 times faster than the other two, more peripheral vessels. In each case there is also a small decrease in velocity that occurs during peak flow. This transient decrease in flow may represent the dicrotic notch and wave that is observed in post-embryonic peripheral arteries (Troxler and Wilkinson, 2007) (see discussion).
Figure 5.
Blood flow measurements from three extraembryonic vessels. (a) Depth (y-axis) vs. time (x-axis) Doppler M-mode (blue) superimposed over M-mode OCT scans of Vessel 2. (b) SDV measurement taken along the dotted horizontal line in (a) shows the blood flow velocity dynamics as a function of time for all three vessels (Vessel 1-red, Vessel 2-green, Vessel 3-blue). (c) Velocity profile along the dotted vertical line in (a) for all three vessels. (table) Measured diameter, volumetric flow and shear rates for all three vessels. Scale bar = 100 µm.
As previously mentioned, an inherent advantage of SDV over pulsed wave Doppler ultrasound is the ability to acquire depth resolved velocity measurements. A plot of the blood flow velocity through the diameter of each vessel is shown in Figure 5c. These velocity profiles were sampled at a time near peak flow through the vessels (t = ~110 ms for Vessel 1 and 2, t = ~145 ms for Vessel 3).
One challenge in resolving the blood flow profiles is that the high optical attenuation of blood reduces optical contrast in OCT images. This is best demonstrated in Figure 2a, where a “shadow” appears below the blood vessel. This shadow can also add additional phase noise to Doppler images in the same region. As a result, accurately measuring blood flow in vessels that are large or reside deeper in tissue may prove difficult. The asymmetry of the blood flow profile from Vessel 3 was most likely caused by optical attenuation near the bottom of the vessel. The shear rate on the vessel wall was based solely on the ascending slope of the velocity profile. The calculated shear rates for Vessels 1, 2, and 3 were 54.2, 74.5, and 25 s−1, respectively. The table in Figure 5 outlines the measured diameter and volumetric flow rate from each vessel.
This investigation of extraembryonic vessels was necessary to develop the technology for interpreting flow through the more complex and dynamically beating heart tube. Figure 6 demonstrates preliminary proof-of concept measurement of blood flow through the outflow tract of an HH 16 chicken embryo heart. SDV measurements were acquired along the center of the outflow tract, as indicated by the dotted line in Figure 6a. The active pumping of the heart tube produces a more complex temporal blood flow profile than observed in the extraembryonic vessels. Figure 6b shows the blood flow velocity through the outflow tract, as a function of time, during one heart beat cycle. Using the M-mode OCT image in Figure 6d, the blood flow velocity can be correlated to the diameter of the outflow tract during ejection of blood, this data could be used to measure the volumetric flow rate. Peak blood flow during the cycle reached approximately 18 mm/s, which is within the range of measurements reported using pulsed Doppler ultrasound ((McQuinn et al., 2007): outflow velocity ~14.3 mm/s for HH 24 chick), pulsed Doppler velocimetry ((Hu and Clark, 1989): peak dorsal aorta velocity increases from ~30 mm/s to ~40 mm/s from HH 12 to HH 24 in development), and micro particle velocimetry ((Vennemann et al., 2006):peak primitive ventricle velocity ~25 mm/s in HH 15 chick embryo). To our knowledge, there is no reported data on blood flow velocities for HH 17 chick embryos measured in the outflow tract region of the heart tube. These preliminary results suggest that there is negative, or regurgitant, flow that occurs while the outflow tract is open, possibly due to incomplete formation of the endocardial cushions. The spatial blood flow velocity profile during peak flow (vertical dotted line in Fig. 6d) is shown in Figure 6c. These results are preliminary in nature but they successfully demonstrate the ability to use OCT and SDV to image and measure depth-resolved blood flow, non-invasively in these very early stage chicken embryo heart tubes.
Discussion
Cardiovascular development is a dynamic process. Relationships between blood flow, gene expression, and structural morphology in these small vessels and the early heart tube has remained open for investigation, largely because technology that could measure blood flow with spatial and temporal resolution sufficient for early embryonic development has been limited. But it is precisely at these early stages of development that considerable cardiac defects may occur as a result of aberrant flow or structural development. Advancements in ultrasound biomicroscopy can now provide resolution as low as 28 µm axially and 60 µm laterally (Sedmera et al., 1999; Phoon and Turnbull, 2003). This technology enables visualization of the heart tube in embryos as young as HH 12. and pulsed Doppler ultrasound measurements in embryos as young as HH 17 (McQuinn et al., 2007). To fully understand the relationship between blood flow, shear rate and cardiovascular development, it is desirable to measure blood flow at earlier stages of cardiovascular development, where the vessel lumen can be are as small as 100 µm in diameter. Here we described a technique for non-invasive acquisition of spatially resolved blood flow dynamics in embryonic vasculature using spectral Doppler velocimetry. Because of the high axial resolution, 12 µm, it is possible to measure blood flow profiles in vessels smaller than 250 µm in diameter which may enable measurement at earlier stages of development (Davis et al.). The high resolution also minimizes artifacts that may occur from averaging over focal volumes that cross areas of vessel wall or animal motion. Such low-velocity movements may cause underestimation of actual blood flow in the developing cardiovasculature. An additional advantage of this system is that SDV permits depth resolved velocity measurements. Shear rate, therefore, can be determined by calculating the velocity gradient near the vessel wall.
Accurate quantification of blood flow velocity in embryonic cardiovasculature using OCT is confronted with several challenges. The maximum detectable velocity is dependent on the integration time of the OCT system. In this case, flow rates which induce Doppler frequency shifts greater than 19 kHz will suffer from phase-wrapping artifacts and thus require implementation of phase unwrapping algorithms. When measuring blood flow in large vessels, these algorithms are sometimes complicated by attenuation of the OCT signal deeper in the vessel, resulting in inaccurate reconstruction of the blood flow profile. This limitation can be resolved by utilizing faster OCT systems or adjusting the OCT scan angle which will then increase the maximum detectable velocity (Fig. 3). The presence of the endocardial cushions insures that the inner surface of the heart tube is not cylindrical, as assumed here. This may produce an overestimation of volumetric flow rates. Here we have also assumed that flow is laminar. This assumption is acceptable for measurement in extraembryonic vessels (Lee et al., 2007). Flow in the developing heart, however, is complex and not likely laminar. In this report, invaginations and evaginations that may be present along the heart tube lumen were not taken into account in calculation of blood flow and sheer rates. Improved computational analyses are being developed and applied to overcome these limitations, including more recent work on developing a more general expression for volumetric flow (Wang et al., 2007).
A transient decrease in velocity occurred during forward flow in the peripheral vessels (Figure 5b). This may represent the dicrotic notch and wave that is seen in normal human peripheral blood flow measurements (Troxler and Wilkinson, 2007). The dicrotic notch in humans represents the closure of the aortic valve and the transient decrease in velocity associated with this. The dicrotic wave represents reflected flow from distal vasculature. The transient dip in velocity we observed may reflect closure of the outflow tract cushion at end-systole. Investigations of cardiac physiology are being performed to confirm this relationship.
The influence of blood flow on heart development is not completely understood, primarily due to the inability to simultaneously image heart structure and quantitatively measure blood flow with high spatial resolution early in embryogenesis. Spectral Doppler velocimetry, in conjunction with spectral-domain optical coherence tomography provides a new set of tools for non-invasively imaging and quantification of blood flow dynamics in embryonic cardiovasculature. This technology enables spatial mapping of blood flow profiles and associated shear rates that will soon be applied to studies during the earliest stages of cardiogenesis. These measurements can also be used to support and validate computational models already established to estimate the dynamic blood flow related processes that occur during embryonic development (Taber et al., 2007).
Acknowledgements
We would like to thank Laura Barbosky and Harriett Stadt in the laboratory of Dr. Peggy Kirby for their intellectual contribution and provision of the chicken embryo preparations, Tzuo Law for his work on phase-unwrapping, Bioptigen, Inc for development of the data acquisition software, and Dr. Bryce Davis for his contributions to the flow validation studies. This research was supported by the National Institute of Health (RR019769 and EB006338).
References
- Boppart SA, Tearney GJ, Bouma BE, Southern JF, Brezinski ME, Fujimoto JG. Noninvasive assessment of the developing Xenopus cardiovascular system using optical coherence tomography. Proc Natl Acad Sci U S A. 1997;94:4256–4261. doi: 10.1073/pnas.94.9.4256. [DOI] [PMC free article] [PubMed] [Google Scholar]
- Butcher JT, McQuinn TC, Sedmera D, Turner D, Markwald RR. Transitions in early embryonic atrioventricular valvular function correspond with changes in cushion biomechanics that are predictable by tissue composition. Circ Res. 2007;100:1503–1511. doi: 10.1161/CIRCRESAHA.107.148684. [DOI] [PubMed] [Google Scholar]
- Chien S. Mechanotransduction and endothelial cell homeostasis: the wisdom of the cell. Am J Physiol Heart Circ Physiol. 2007;292:H1209–H1224. doi: 10.1152/ajpheart.01047.2006. [DOI] [PubMed] [Google Scholar]
- Choma MA, Sarunic MV, Yang C, Izatt JA. Sensitivity advantage of swept-source and Fourier-domain optical coherence tomography. Opt. Express. 2003;11:2183–2189. doi: 10.1364/oe.11.002183. [DOI] [PubMed] [Google Scholar]
- Davis AM, Rothenberg F, Izatt JA. Biomedical Optics. Ft. Lauderdale, FL: Optical Society of America; 2006. Volumetric Imaging of Chick Embryo Heart Development in vivo Using a High Speed Doppler Spectral Domain OCT Microscope. p We6. [Google Scholar]
- Fercher AF, Hitzenberger CK, Kamp G, Elzaiat SY. Measurement of Intraocular Distances by Backscattering Spectral Interferometry. Optics Communications. 1995;117:43–48. [Google Scholar]
- Ghiglia DC, Pritt MD. Two Dimensional Phase Unwrapping, Theory, Algorithms, and Software. New York: Wiley; 1998. [Google Scholar]
- Groenendijk BC, Hierck BP, Vrolijk J, Baiker M, Pourquie MJ, Gittenberger-de Groot AC, Poelmann RE. Changes in shear stress-related gene expression after experimentally altered venous return in the chicken embryo. Circ Res. 2005;96:1291–1298. doi: 10.1161/01.RES.0000171901.40952.0d. [DOI] [PubMed] [Google Scholar]
- Harrison DG, Widder J, Grumbach I, Chen W, Weber M, Searles C. Endothelial mechanotransduction, nitric oxide and vascular inflammation. J Intern Med. 2006;259:351–363. doi: 10.1111/j.1365-2796.2006.01621.x. [DOI] [PubMed] [Google Scholar]
- Hove JR, Koster RW, Forouhar AS, Acevedo-Bolton G, Fraser SE, Gharib M. Intracardiac fluid forces are an essential epigenetic factor for embryonic cardiogenesis. Nature. 2003;421:172–177. doi: 10.1038/nature01282. [DOI] [PubMed] [Google Scholar]
- Hu N, Clark EB. Hemodynamics of the stage 12 to stage 29 chick embryo. Circ Res. 1989;65:1665–1670. doi: 10.1161/01.res.65.6.1665. [DOI] [PubMed] [Google Scholar]
- Huang D, Swanson EA, Lin CP, Schuman JS, Stinson WG, Chang W, Hee MR, Flotte T, Gregory K, Puliafito CA, Fujimoto JG. Optical Coherence Tomography. Science. 1991;254:1178–1181. doi: 10.1126/science.1957169. [DOI] [PMC free article] [PubMed] [Google Scholar]
- Huber R, Adler DC, Fujimoto JG. Buffered Fourier domain mode locking: Unidirectional swept laser sources for optical coherence tomography imaging at 370,000 lines/s. Opt Lett. 2006;31:2975–2977. doi: 10.1364/ol.31.002975. [DOI] [PubMed] [Google Scholar]
- Jenkins MW, Adler DC, Gargesha M, Huber R, Rothenberg F, Belding J, Watanabe M, Wilson DL, Fujimoto JG, Rollins AM. Ultrahigh-speed optical coherence tomography imaging and visualization of the embryonic avian heart using a buffered Fourier Domain Mode Locked laser. Opt. Exp. 2007;15:6251–6267. doi: 10.1364/oe.15.006251. [DOI] [PMC free article] [PubMed] [Google Scholar]
- Jenkins MW, Rothenberg F, Nikolski VP, Hu Z, Watanabe M, Wilson DL, Efimov IR, Rollins AM. 4D embryonic cardiography using gated optical coherence tomography. Optics Express. 2006;14:736–748. doi: 10.1364/opex.14.000736. [DOI] [PubMed] [Google Scholar]
- Lee JY, Ji HS, Lee SJ. Micro-PIV measurements of blood flow in extraembryonic blood vessels of chicken embryos. Physiol Meas. 2007;28:1149–1162. doi: 10.1088/0967-3334/28/10/002. [DOI] [PubMed] [Google Scholar]
- Leitgeb R, Hitzenberger CK, Fercher AF. Performance of fourier domain vs. time domain optical coherence tomography. Optics Express. 2003;11:889–894. doi: 10.1364/oe.11.000889. [DOI] [PubMed] [Google Scholar]
- Luo W, Marks DL, Ralston TS, Boppart SA. Three-dimensional optical coherence tomography of the embryonic murine cardiovascular system. J Biomed Opt. 2006;11 doi: 10.1117/1.2193465. 021014. [DOI] [PubMed] [Google Scholar]
- Mariampillai A, Standish BA, Munce NR, Randall C, Liu G, Jiang JY, Cable AE, Vitkin IA, Yang VXD. Doppler optical cardiogram gated 2D color flow imaging at 1000 fps and 4D in vivo visualization of embryonic heart at 45 fps on a swept source OCT system. Opt. Exp. 2007;15:1627–1638. doi: 10.1364/oe.15.001627. [DOI] [PubMed] [Google Scholar]
- McQuinn TC, Bratoeva M, Dealmeida A, Remond M, Thompson RP, Sedmera D. High-frequency ultrasonographic imaging of avian cardiovascular development. Dev Dyn. 2007;236:3503–3513. doi: 10.1002/dvdy.21357. [DOI] [PubMed] [Google Scholar]
- Phoon CK, Aristizabal O, Turnbull DH. Spatial velocity profile in mouse embryonic aorta and Doppler-derived volumetric flow: a preliminary model. Am J Physiol Heart Circ Physiol. 2002;283:H908–H916. doi: 10.1152/ajpheart.00869.2001. [DOI] [PubMed] [Google Scholar]
- Phoon CK, Turnbull DH. Ultrasound biomicroscopy-Doppler in mouse cardiovascular development. Physiol Genomics. 2003;14:3–15. doi: 10.1152/physiolgenomics.00008.2003. [DOI] [PubMed] [Google Scholar]
- Sedmera D, Pexieder T, Rychterova V, Hu N, Clark EB. Remodeling of chick embryonic ventricular myoarchitecture under experimentally changed loading conditions. Anat Rec. 1999;254:238–252. doi: 10.1002/(SICI)1097-0185(19990201)254:2<238::AID-AR10>3.0.CO;2-V. [DOI] [PubMed] [Google Scholar]
- Taber LA, Zhang J, Perucchio R. Computational model for the transition from peristaltic to pulsatile flow in the embryonic heart tube. J Biomech Eng. 2007;129:441–449. doi: 10.1115/1.2721076. [DOI] [PubMed] [Google Scholar]
- Troxler M, Wilkinson D. An Unusual Cause of a "Double Pulse". EJVES Extra. 2007;13:72–74. [Google Scholar]
- Ursem NT, Stekelenburg-de Vos S, Wladimiroff JW, Poelmann RE, Gittenberger-de Groot AC, Hu N, Clark EB. Ventricular diastolic filling characteristics in stage-24 chick embryos after extra-embryonic venous obstruction. J Exp Biol. 2004;207:1487–1490. doi: 10.1242/jeb.00902. [DOI] [PubMed] [Google Scholar]
- van Leeuwen T, Kulkarni MD, Yazdanfar S, Rollins AM, Izatt JA. High-flow-velocity and shear-rate imaging by use of color Doppler optical coherence tomography. Opt Lett. 1999;24:1584–1586. doi: 10.1364/ol.24.001584. [DOI] [PubMed] [Google Scholar]
- Vennemann P, Kiger KT, Lindken R, Groenendijk BC, Stekelenburg-de Vos S, Ten Hagen TL, Ursem NT, Poelmann RE, Westerweel J, Hierck BP. In vivo micro particle image velocimetry measurements of blood-plasma in the embryonic avian heart. J Biomech. 2006;39:1191–1200. doi: 10.1016/j.jbiomech.2005.03.015. [DOI] [PubMed] [Google Scholar]
- Wang H, Riha GM, Yan S, Li M, Chai H, Yang H, Yao Q, Chen C. Shear stress induces endothelial differentiation from a murine embryonic mesenchymal progenitor cell line. Arterioscler Thromb Vasc Biol. 2005;25:1817–1823. doi: 10.1161/01.ATV.0000175840.90510.a8. [DOI] [PubMed] [Google Scholar]
- Wang L, Wang Y, Guo S, Zhang J, Bachman M, Li GP, Chen Z. Frequency domain phase-resolved optical Doppler and Doppler variance tomography. Optics Communications. 2004;242:345–350. [Google Scholar]
- Wang Y, Bower BA, Izatt JA, Tan O, Huang D. In vivo total retinal blood flow measurement by Fourier domain Doppler optical coherence tomography. J Biomed Opt. 2007;12 doi: 10.1117/1.2772871. 041215. [DOI] [PubMed] [Google Scholar]
- Yazdanfar S, Kulkarni MD, Izatt JA. High resolution imaging of in vivo cardiac dynamics using color Doppler optical coherence tomography. Optics Express. 1997;1:424–431. doi: 10.1364/oe.1.000424. [DOI] [PubMed] [Google Scholar]
- Yelbuz TM, Choma MA, Thrane L, Kirby ML, Izatt JA. Optical coherence tomography: a new high-resolution imaging technology to study cardiac development in chick embryos. Circulation. 2002;106:2771–2774. doi: 10.1161/01.cir.0000042672.51054.7b. [DOI] [PubMed] [Google Scholar]
- Yun SH, Tearney GJ, Bouma BE, Park BH, de Boer JF. High-speed spectral-domain optical coherence tomography at 1 mu m wavelength. Optics Express. 2003;11:3598–3604. doi: 10.1364/oe.11.003598. [DOI] [PMC free article] [PubMed] [Google Scholar]


