

Abstract
Protein tyrosine phosphorylation represents a central regulatory mechanism in cell signaling. Here we present an extensive survey of tyrosine phosphorylation sites in a normal-derived human mammary epithelial cell line by applying anti-phosphotyrosine peptide immunoaffinity purification coupled with high sensitivity capillary liquid chromatography tandem mass spectrometry. A total of 481 tyrosine phosphorylation sites (covered by 716 unique peptides) from 285 proteins were confidently identified in HMEC following the analysis of both the basal condition and acute stimulation with epidermal growth factor (EGF). The estimated false discovery rate was 1.0% as determined by searching against a scrambled database. Comparison of these data with existing literature showed significant agreement for previously reported sites. However, we observed 281 sites that were not previously reported for HMEC cultures and 29 of which have not been reported for any human cell or tissue system. The analysis showed that the majority of highly phosphorylated proteins were relatively low-abundance. Large differences in phosphorylation stoichiometry for sites within the same protein were also observed, raising the possibility of more important functional roles for such highly phosphorylated pTyr sites. By mapping to major signaling networks, such as the EGF receptor and insulin growth factor-1 receptor signaling pathways, many known proteins involved in these pathways were revealed to be tyrosine phosphorylated, which provides interesting targets for future hypothesis-driven and targeted quantitative studies involving tyrosine phosphorylation in HMEC or other human systems.
Keywords: LC-MS/MS, phosphotyrosine, phosphoproteomics, HMEC, phosphorylation, immunoprecipitation
INTRODUCTION
Phosphorylation, particularly tyrosine phosphorylation, acts as a central regulatory mechanism for cell signaling. As such, characterizing how individual phosphorylation sites respond to different cell stimuli is critical for understanding the regulation of cellular function1. While recent advances in mass spectrometry (MS)-based phosphoproteomics technologies allow extensive profiling of site-specific phosphorylation on serine and threonine residues 2–7, the characterization of tyrosine phosphorylation is more challenging due to the significantly lower levels of tyrosine phosphorylation (pTyr) compared to phosphoserine (pSer) and phosphothreonine (pThr). For example, a relative abundance of 1800:200:1 has been estimated for pSer:pThr:pTyr in vertebrate cells8. More recently, the coupling of peptide level anti-pTyr immunoaffinity purification (IP) with LC-MS/MS has proven to be a good approach for profiling tyrosine phosphorylation 9–11, but sensitivity remains a significant challenge for obtaining extensive coverage of the phosphotyrosine proteome12. To date, several MS-based studies have investigated site-specific tyrosine phosphorylation in cellular and tissue proteomes 9, 13–16. The extensive characterization of pTyr sites in selected biological model systems will enable more directed studies that focus on the functional role of selected pTyr sites involved in specific pathways or biological processes.
In this work we present an extensive profiling of site-specific tyrosine phosphorylation in a well-studied human mammary epithelial cell line (HMEC, strain 184A1) using anti-pTyr peptide IP coupled with high sensitivity LC-MS/MS. These cells have been extensively used as a model system for studying the mechanisms controlling proliferation and differentiation in normal human cells 17, especially for understanding the role of the epidermal growth factor receptor (EGFR) signaling pathways 18–20. More recently, several studies have been focused on studying the dynamics of tyrosine phosphorylation involved in the EGFR signaling pathways by applying iTRAQ14 labeling and multiple reaction monitoring10, 21 coupled with anti-pTyr IP and LC-MS/MS. While these studies provided significant novel information regarding the dynamics of tyrosine phosphorylation, it is expected that many important tyrosine phosphorylation events within the HMEC proteome still remain to be discovered. In this study both basal (control) and epidermal growth factor (EGF)-stimulated conditions were analyzed separately to maximize coverage of the phosphotyrosine proteome. Nine replicate analyses of each condition were performed using anti-pTyr peptide IP coupled with high sensitivity LC-MS/MS. A total of 481 pTyr sites (covered by 710 unique peptides) were confidently identified, which represents a significant increase in the number of previously reported pTyr sites in HMEC.
EXPERIMENTAL SECTION
Cell Culture and Reagents
HMEC line 184A1 was obtained from Lawrence Berkeley National Laboratory22. These cells were routinely cultured in DFCI-1 medium supplemented with 12.5 ng/mL human EGF (Calbiochem, San Diego, CA) as previously described23,24. HMEC were grown to ~80% confluence in 100 mm dishes, washed with phosphate-buffered saline to facilitate removal of the fetal bovine serum, and incubated overnight (18 h) in serum-free medium consisting of alpha MEM:F12 that contained 0.1% BSA prior to stimulation and sample collections. For EGF stimulation, cells were incubated for 7.5 min with medium that contained 25 ng/mL EGF.
Protein Digestion and Cleanup
Cells were scraped using freshly prepared 8 M urea in 20 mM ammonium bicarbonate (pH 8.0) with 1 mM sodium othovanadate, and 10 mM NaF. Lysis was performed by passing the solution through an 18-gauge syringe needle and then sonicating the solution at ice temperature for 5 min. Proteins were reduced with 10 mM dithiothreitol (DTT) for 60 min at 37 °C, followed by alkylation with 40 mM iodoacetamide for 90 min at room temperature. Samples were diluted 5-fold and digested overnight at 37 °C, using sequencing grade trypsin (Promega, Madison, WI) at a 1:50 (trypsin:protein, w/w) ratio. Immediately following digestion, acetic acid was added to a final concentration of 0.5% (v/v), and the peptide samples were desalted were using SepPak Environmental-Plus C18 solid phase extraction cartridges (Waters, Milford, MA). The reversed phase media was activated, using four column volumes of methanol and then equilibrated with four volumes of 0.1% trifluoroacetic acid (TFA). After loading the acidic peptide solution, the cartridge was washed with four volumes of 5% acetonitrile (ACN) with 0.1% TFA. Peptides were eluted with two column volumes of 40% ACN (0.1% TFA) followed by two column volumes of 80% ACN (0.1% TFA). Eluted peptides were lyophilized to dryness and stored at -80 °C until needed for immunoaffinity purification.
Anti-pTyr peptide immunoaffinity purification (IP)
Anti-pTyr peptide immunoprecipitation was performed as previously described but with minor modification4 immediately before LC-MS/MS analysis. Lyophilized peptides were dissolved in IP buffer (50 mM 3-(N-morpholino)propanesulfonic acid, pH 7.2, 10 mM sodium phosphate, 50 mM NaCl) with a final peptide concentration ~ 4 mg/mL. The resulting peptide solution was transferred into a microcentrifuge tube that contained pY-100 antibody beads (Cell Signaling Technology, Danvers, MA) and incubated overnight at 4 °C. The beads were then gently washed three times with 1 mL IP buffer and twice with 1 mL of water. Peptides were eluted from the beads by incubating them in 45 μL of 0.15% TFA at room temperature for 10 min, followed by another 55 μL 0.15% TFA wash. Peptide eluates were collected following centrifugation (5 min at 1700 × g), and the enriched peptide samples were purified with micro C18 ZipTips (Millipore, Billerica, MA) prior to LC-MS/MS analysis.
Capillary LC-MS/MS analysis
Two 14 μL aliquots of IP eluate were used for each LC-MS/MS analysis, and bound peptides from both aliquots were eluted into the same 40% ACN, 0.1% TFA solution. All wash and elution volumes were 10 μL. The purified sample was dried down and reconstituted to the desired injection volume of 5 – 15 μL with 0.1% TFA.
Samples were injected into a nano-flow, metal-free nanoLC system (developed in house) with a 40-cm long, 30 μm i.d. capillary column packed (in-house) with 3 μm Jupiter (Phenomenex, Torrance, CA) C18 silica. An uncoated fused silica capillary pulled (5-μm at the capillary tip and 20 μm i.d. at the column junction) was joined to the column using a pico-clear union (both from New Objective, Woburn, MA). The gradient ran from 0% − 70% acetonitrile that contained 0.1 M acetic acid. Mass spectra were acquired using an LTQ-Orbitrap (ThermoScientific, Waltham MA) that provided 60,000 resolution Orbitrap MS survey scans, followed by 10 LTQ MS/MS scans of the most abundant parent ions in each scan, with a dynamic exclusion time of 30 s used for parent ion selection.
Data Analysis
All DTA files were generated using DeconMSn25 and analyzed using the X!Tandem26 algorithm to search the human IPI protein database (August 22, 2006; 61,225 entries). Only fully and partially tryptic peptides with carboxyamidomethylation of cysteine residues as a fixed modification (57.0215 Da) and phosphorylation of Ser, Thr, and Tyr as a variable modification (79.9663 Da) were considered. The parent ion mass tolerance was set to ±60 ppm for database searching and identifications were filtered using a tighter mass tolerance (8 ppm in this work). ProteinProphet was employed to assign unique peptide sequences to proteins and protein groups derived from the same Human IPI database27. Following ProteinProphet analysis, one IPI accession number (the first listed in an ascending sort for the members of a protein group) was chosen to represent each protein group. The phosphorylation position in the protein selected for each protein group was determined for each peptide match and tagged with a unique identifier.
The false discovery rate (FDR) was estimated using scrambled protein database searches of the data (where each protein sequence in the database was randomized) and compared against forward searches of the same data sets, applying the same filtering parameters28. To estimate the FDR for unique pTyr-containing peptide sequences, both fully and partially tryptic peptides were constrained to an 8 ppm mass error cutoff. Partially tryptic peptides were further filtered by requiring at least two observations, using an X!Tandem log expectation value of < −2 for each peptide. A FDR of ~1.0% (5 false identification sites) was determined. Fragmentation spectra for peptides with only a single observation (for fully-tryptic peptides) and those peptides corresponding to previously unknown phosphorylation sites were confirmed by manual inspection.
The total spectral counts29 (a semi-quantitative measure of abundance) for each pTyr site under each biological condition were calculated by summing among the replicates. Unknown sites were determined by comparing our results to the PhosphoELM (http://phospho.elm.eu.org/)30 and Phosphosite (http://www.phosphosite.org)31 databases.
Motif assignment
Non–redundant seed sequences that consisted of 15 or 31 amino acids were generated from the human IPI database using each identified phosphotyrosine as the central residue. These sequences were submitted in two separate batches to the motif search program Motif-X (http://motif-x.med.harvard.edu/)32. The minimum match significance was set to 1×10⁻⁶ and a minimum of five occurrences of the motif in the data set. The IPI Human Proteome provided on the Motif-X website was used as the background comparison data set. The central character and width were set appropriately for each data set being searched.
Pathway analysis
Results obtained for both control and EGF conditions were uploaded for Ingenuity Pathway Analysis (IPA). Proteins from our dataset that had known phosphorylation interactions downstream or upstream of EGFR or insulin-like growth factor 1 receptor (IGF1R) were included in the final network. The phosphorylation level for each protein was based on the total number of spectral counts for all identified sites on the protein after EGF stimulation.
RESULTS AND DISCUSSION
Analytical strategy
The general workflow for analyzing tyrosine phosphorylation is depicted in Figure 1. Basically, peptide anti-pTyr IP was coupled with high sensitivity LC-MS/MS for proteome-wide profiling, similar to what has been previously reported 4, 14. Basal (control) and acutely EGF-stimulated conditions were evaluated separately in multiple IP experiments, with nine replicate LC-MS/MS analyses for each condition to enhance coverage of pTyr sites by minimizing the potential for undersampling33. Due to the extremely low levels of pTyr peptides, a relatively large amount of protein, i.e., ~4 mg of total peptide (which corresponds to ~4 × 10⁷ cells) were used for each IP experiment. Each enriched pTyr peptide solution was typically analyzed twice by LC-MS/MS, and the resulting MS/MS spectra were searched against a human protein database, using X!Tandem. Identified peptides were filtered based on mass error (in ppm), the X!Tandem peptide expectation value, cleavage state, and peptide spectral count and an FDR estimated from a scrambled protein database search. Identified pTyr peptides were assigned a unique identification designation (SiteID) for pTyr sites. Sites with only a single spectral observation and previously unknown sites were manually examined. A total of 27 sites were removed from the list following manual examination. Spectral counts for each identified site, which provided a semi-quantitative measure of relative abundance of each pTyr site, were then rolled up by biological condition.
Figure 1.

Experimental workflow for this study. Details for the sections of the general workflow are given to the left and right.
Phosphotyrosine peptide identifications
56,104 MS/MS spectra (from a total of 570,738 collected in 18 LC-MS/MS analyses, i.e., 9 for each condition) were assigned a sequence by X!Tandem prior to any filtering. Of these 56,104 spectra, 8383 (15% of the those identified by X!Tandem) passed the final filtering criteria. In total, 710 unique pTyr peptides with 481 unique pTyr sites were identified (Supplementary Table 1 and 2) from 285 proteins. 98% of these peptides were singly tyrosine phosphorylated. Among the 13 multiply phosphorylated peptides, nine contained both pTyr and pSer/pThr and three contained multiple pTyr residues.
Figure 2 shows the mass error and expectation value distribution for pTyr-containing peptides identified in both forward (black) and scrambled (red) database searches. Figure 2a shows the unfiltered pTyr-containing peptides, where the forward matches clustered within ± 8 ppm. Figure 2b shows only the fully tryptic pTyr-peptides and contains only a few scrambled database matches within ± 8 ppm, which indicates a very low FDR for this category of peptides. Because partially tryptic pTyr-peptides (Figure 2c) yielded a higher percentage of scrambled database matches, we required at least two spectral counts for each peptide identification and a log peptide expectation value cutoff of −2 (green line) in addition to the mass error filter to enhance data confidence. With the expectation value cutoff applied, the estimated FDR values for the filtered partially tryptic and fully tryptic peptides are close (i.e., 1.9% for partially tryptic peptides and 0.7% for tryptic peptides). The overall FDR estimated for the unique pTyr-containing peptides was 1.0%.
Figure 2.
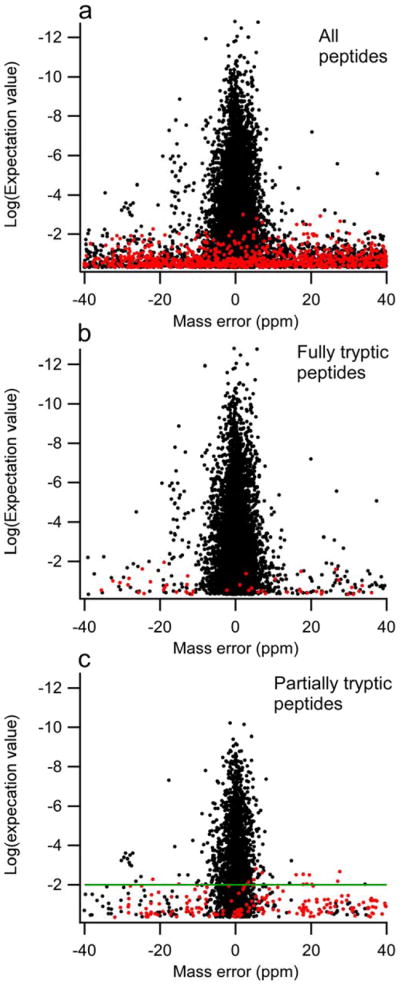
Scatter plots of data with normalized mass error and X!Tandem peptide expectation value comparing forward (black) and scrambled (red) protein database search results. a) Only phosphotyrosine-containing peptides, no other filters applied. b) The same as in 2a, but only tryptic peptides. c) Phosphotyrosine-containing partially tryptic peptides with at least two spectral counts. The applied X!Tandem log(peptide expectation value) cutoff of −2 is marked with a green line.
New pTyr sites
Of the 481 unique pTyr sites, 160 were observed only in the EGF-stimulated condition, while 85 pTyr sites were observed only in the control (Figure 3a). It is possible that many sites observed only in the EGF-stimulated condition have phosphorylation levels below detection limits under basal conditions. To determine whether new pTyr sites were observed in our HMEC samples, we first compared our dataset with two previously published MS-based tyrosine phosphorylation studies in HMEC 10, 11. Based on this comparison, we identified 281 new sites in HMECs (Figure 3b). Our results overlap with the combined results from previous studies by 200 sites (as marked in Supplementary Table 1). While approximately 30% of these new sites were observed on known tyrosine phosphorylated proteins identified in previous HMEC studies10, 11, the new sites also cover ~170 proteins that have not been reported as being tyrosine phosphorylated in HMEC. Note that 43 of these new phosphotyrosine proteins contain multiple pTyr sites and include several known cell signaling proteins, such as neural precursor cell expressed, developmentally down-regulated 9 (NEDD9), plakophilin 2 (PKP2), Insulin receptor substrate 1 (IRS1), and tensin 1 (TNS1), all of which were identified with at least four pTyr sites. Among these cell singling proteins, insulin receptor substrate 2 (IRS2) is a key protein involved in insulin signaling pathways and plays a critical role for glucose homeostasis along with IRS1 34, 35. IRS1 and IRS2 phosphorylation is regulated by insulin-like growth factor 1 receptor (IGF1R) and insulin receptor activation36. NEDD9 is also a well-characterized phosphoprotein acting as a docking protein for kinases involved in cell adhesion37. We identified nine different pTyr sites for NEDD9, only one of which had not previously been identified in other human tissues and cell lines. Tyrosine phosphorylation on NEDD9 is known to be regulated by integrin beta 138 and protein tyrosine kinase 2 (PTK2)39. NEDD9 subsequently increases the phosphorylation on mitogen-activated protein kinase 8 (MAPK8)40.
Figure 3.

a) Venn diagram showing the overlap of identified pTyr sites between the control and EGF stimulated conditions in this study. b) Venn diagram comparing the identified pTyr sites between the current data set and the combined data from two recent mass spectrometry-based, site-specific quantitative studies of tyrosine phosphorylation in HMEC culture10, 11.
In the cases of known phosphoproteins with new sites identified in this study, the sites with higher spectral counts tended to correlate with previously reported sites, suggesting that the new site identifications were due to the increased coverage achieved by this study. However, there are several instances where the previously reported sites were the sites with lower spectral counts, e.g., AHNAK nucleoprotein (AHNAK). AHNAK is an adapter protein known to associate several enzymes in the EGFR pathway, such as protein kinase C-alpha 41. The one site that was previously observed (Y2159) was only observed with two spectral counts in the EGF-stimulated condition, while the other five identified sites had spectral counts ranging from 10 to 70. Conversely, there are 153 sites identified in previous MS-based studies10, 11, but not identified here. This difference could be due to several reasons. First, the previous studies10, 11 used a much higher concentration of EGF (100 ng/mL vs. 25 ng/mL) for stimulation, which could lead to phosphorylation of more sites (although they may not be physiologically relevant). Second, the previous studies made measurements at multiple time points following stimulation, while the current study measured phosphorylation present with no stimulation (control or time zero) and a single time-point (7.5 min) after stimulation. Nearly half of the previously observed 153 sites were not detected at early time points, which are similar to the one used in this study. Finally, the 153 sites not detected in this study could possibly be due to MS/MS undersampling; however, nine replicates were performed to minimize this possibility.
By comparing known pTyr sites in the entire human proteome, we identified 29 new tyrosine phosphorylation sites that have not previously been reported in human cells (Table 1). Sites were assigned as novel by searching against the most current version of the Phosphosite and PhosphoELM databases using the detected peptide sequence. Most of the new phosphorylation sites are lower abundance modifications (about half of them have one or two spectral counts). Also, approximately half of the new phosphorylation sites had only one or two spectral counts, so are most likely lower abundance modifications. Moreover, nearly half of the new sites are located on proteins with known multiple tyrosine phosphorylation sites. For example, PTPRK is a receptor tyrosine phosphatase and the new site Y805 is observed with 55 total spectral counts. This specific phosphatase is thought to be involved with cell adhesion because its expression is regulated by cell density 42 and because of its effect on the cellular location of β-catenin complexes 43. Another protein, the transmembrane BAX inhibitor protein 1 (TMBIM1) was recently shown to be phosphorylated at S81 in human platelets44. In our data, four spectra were detected for Y73, all in the control condition. Ribosomal protein L30 (RPL30) is phosphorylated at Y26 and S9 9, 13. We did not observe phosphorylation at these known positions and instead identified phosphorylation at Y73 with 8 total spectral counts (See MS/MS spectrum in Figure 4a).
Table 1.
Novel tyrosine phosphorylation sites reported in this study. Sites are listed by SiteID (IPI accession number-modified residue-position in protein) and Entrez gene name. Counts are summed across all conditions and replicates. The X!Tandem log(expectation value) is the lowest while the hyperscore is the maximum value observed across the dataset. The listed mass error is corrected (as described previously) and is the lowest absolute value across all corresponding peptides. Proteins where phosphorylation has not been previously identified are marked as “New Proteins” and known phosphoproteins with new sites are marked as “New Site.”
| Gene Name | Mod Position | Spectral Counts | Log (Exp. Value) | Hyper-score | Mass Error (ppm) | New Protein | New Site |
|---|---|---|---|---|---|---|---|
| CTNNAL1 | 450 | 1 | −1.056 | 25.2 | −1.595 | x | |
| C3orf10 | 67 | 2 | −0.585 | 34.5 | 0.30 | x | |
| PKP2 | 12 | 2 | −2.62 | 34.7 | −0.30 | x | |
| CLOCK | 331 | 1 | −0.481 | 30.7 | 1.29 | x | |
| CD59 | 29 | 14 | −7.959 | 50.2 | −0.54 | x | |
| CD59 | 86 | 3 | −0.77 | 38.8 | −0.45 | x | |
| PTPRK | 805 | 55 | −10.076 | 84.3 | −8.0E–02 | x | |
| SH2B1 | 624 | 1 | −1.187 | 38.3 | 2.07 | x | |
| NME1 | 52 | 2 | −0.62 | 37.1 | 0.74 | x | |
| GAB1 | 183 | 10 | −4.824 | 53.4 | 7.0E–02 | x | |
| NEDD9 | 223 | 1 | −0.357 | 24.6 | 2.09 | x | |
| ITCH | 343 | 1 | −3.056 | 47.2 | 0.82 | x | |
| TOLLIP | 83 | 1 | −0.699 | 36.6 | −2.80 | x | |
| MAGI1 | 376 | 6 | −4.337 | 52.5 | −1.12 | x | |
| PHLDB2 | 851 | 1 | −0.854 | 29.5 | 9.50E–02 | x | |
| FAM59A | 74 | 2 | −1.444 | 38.7 | −0.12 | x | |
| OTUD6B | 272 | 2 | −1.276 | 34.7 | 0.67 | x | |
| RPL30 | 73 | 9 | −5.229 | 58.2 | −0.55 | x | |
| LGALS1 | 104 | 4 | −2.796 | 35.5 | 7.0E–02 | x | |
| LOC65326 | 606 | 1 | −0.444 | 31.4 | −4.23 | x | |
| 9 | |||||||
| FLNB | 1684 | 2 | −2.796 | 32.3 | 1.69 | x | |
| TMBIM1 | 73 | 4 | −3.481 | 40.1 | −3.84 | x | |
| TCP1 | 299 | 2 | −0.699 | 31.7 | −0.58 | x | |
| TLN1 | 2542 | 1 | −2.036 | 38 | 2.30 | x | |
| EPN3 | 186 | 6 | −2.721 | 43.3 | −0.38 | x | |
| COL17A1 | 396 | 4 | −6.119 | 50 | −3.5E–02 | x | |
| LOC57228 | 95 | 1 | −0.328 | 23.4 | 9.0E–02 | x | |
| LOC643596 | 8 | 1 | −0.585 | 25.6 | 4.67 | x | |
| ARHGEF5 | 1140 | 7 | −3.222 | 41.8 | 0.28 | x |
Figure 4.

Annotated tandem mass spectra for two peptides corresponding to two novel tyrosine phosphorylation sites. In the peptide sequences * denotes carboxyamidomethylation and # phosphorylation. a) RLP30 position Y73 and b) CD59 position Y29.
The study has also led to the discovery of a number of new tyrosine phosphorylated proteins in human that include chromosome 3 open reading frame 1 (C3orf10), CD59 molecule, complement regulatory protein (CD59), toll interacting protein (TOLLIP), OTU domain containing 6B (OTUD6B), lactose-binding lectin 1 (LGALS1), LOC653269, LOC57228, and LOC643596. Many of these proteins are kinases and structural proteins likely to be participants in cell signaling. For example, CD59, a membrane protein that inhibits aspects of the complement cascade, has been reported to promote tyrosine phosphorylation of a c-Src immune complex45; however, its tyrosine phosphorylation has not been reported. In this work, we discovered that both residues Y29 and Y86 of CD59 were phosphorylated (see representative MS/MS spectrum in Figure 4b). The structural protein C3of10 (also called HSPC300) can regulate actin polymerization. Its absence in tumor cells can cause morphological abnormalities, which suggests a critical role in cell development 46. Two other proteins, TOLLIP and OTUD6B are thought to be involved with ubiquitination attachment 47 and removal, 48 respectively.
Phosphorylation motifs
The coverage of pTyr sites in HMEC achieved in this study allows us to examine potentially significant motifs for tyrosine phosphorylation. Application of the motif-finding algorithm with the constraints described by Swartz et al. 32 led to the identification of six significant motifs (Table 2). The majority of these motifs were identified more than 10 times in the dataset and no motif with a significance of less than 1×10⁻⁶ was considered. Three of the motifs, i.e., y......R, G.y, and L.......y.......P..W (where “y” is pTyr, and a period represents any amino acid), have not been previously reported49. Although L.......y.......P..W had the fewest number of matches (i.e., 9), the confidence of this identification is high based on a high score and probability value. Interestingly, the motif y......R is similar to the known SHP2 phosphatase substrate EFyA.[V/I].[R/K/H]S50. The remaining three motifs are associated with tyrosine phosphorylation and have scores consistent with those previously reported32 .
Table 2.
Phosphorylation motifs identified by the X-Motif algorithm32. All sites have a minimum match significance of greater than 1×10⁻⁶. At least 5 occurrences of the motif were required to be considered valid. In the motif tag “y” represents pTyr and a period can be any amino acid residue.
| Motif Tag | Spectra l Counts | Score | Function | Gene Example |
|---|---|---|---|---|
| D..y | 43 | 7.87 | ALK kinase sub. | SHC1, LYN, ANXA2, JUP |
| Dy | 41 | 7.85 | EGFR kinase sub. | EGFR, GAB1, AHNAK, PKP2 |
| G.y | 36 | 6.46 | Novel | AHNAK, PKP2, CDK2, LYN |
| L........y........P..W | 9 | 24.4 | Novel | HCK, FYN, EPHB2, ABL2 |
| y......R | 38 | 7.46 | Novel | MAPK1, KRT5, ANXA2, CALM1 |
| y..P | 67 | 14.0 | Src Consensus | BCAR1, CAV1, JUP, ACTB |
Phosphorylation stoichiometry
We utilized spectral counting as a semi-quantitative measure to evaluate phosphorylation stoichiometry among different proteins. Specifically, we compared the spectral count information for tyrosine phosphorylated proteins identified in this study with total spectral counts obtained for proteins identified in our earlier global profiling study of HMEC51 to evaluate phosphorylation stoichiometry for individual proteins. Low-abundance proteins that show a high level of phosphorylation may represent important signaling proteins that serve a vital role in biological processes3, 52, while low-level phosphorylation in high-abundance proteins may be non-specific and not physiologically relevant. Figure 5a shows the comparison between the total spectral counts from previous global abundance profiling and the total spectral counts of tyrosine phosphorylation for selected proteins (spectral counts for all phosphorylation sites on the same protein are summed). Based on spectral counts, many of the highly phosphorylated proteins are very low-abundance proteins, while the majority of high-abundance proteins have relatively low levels of phosphorylation. For example, EGFR has 389 phosphopeptide counts, while the total spectral count in previous global profiling was 24. In contrast, filamin-B (FLNB) was observed in 532 total spectra in the previous global profiling study, but observed in only six spectra of one phosphorylation site (Y2502) in EGF-stimulated samples. Many key regulatory proteins involved in the EGFR pathways 53, such as EGFR, mitogen activated protein kinase 1 and 3 (MAPK1 and MAPK3), tyrosine protein kinase c-src (SRC), SHC-transforming protein 1 (SHC1), protein-tyrosine kinase fyn (FYN), and cell division cycle 2 protein (CDC2) were observed with high levels of phosphorylation in this study, but with low spectral counts in the global profiling study (detailed results are provided in Supplemental Table 3). GRB2-associated binding protein 1 (GAB1), Src homology 2 domain containing adaptor protein B (SHB), and the tyrosine kinse adaptor protein c-cbl (CBL) are known members of the EGFR signaling pathway and are observed to be highly phosphorylated in this study, but not observed in any spectra in previous global study. Conversely, low levels of phosphorylation were observed in a number of high-abundance proteins, such as FLNB and myosin-9 (MYH9). These data indicate that tyrosine phosphorylation in many key signaling proteins occurs with a high stoichiometry of phosphorylation. This trend mirrors our observations in an earlier comparison of the global proteome and phosphoproteome of pseudopodia in chemotatic cells 54 .
Figure 5.

Phosphorylation stoichiometry. a) Graph of selected proteins comparing spectral counts from global abundance profiling51 (cross-hatched bars) with the total spectral counts of tyrosine phosphorylation identified on the same protein after EGF stimulation (black bars). Several of the proteins displayed contain multiple phosphorylation sites. A complete listing of proteins present in both the global profiling and pTyr datasets is given in Supplemental Table 3. Graphs b) to e) depict the spectral counts for selected multi-phosphorylated proteins. EGF response is in black and the control condition is cross-hatched. b) EGFR, c) IRS2, d) AHNAK, e) SHB.
Phosphorylation differences among multiple sites for a given protein
Spectral count information also provides a means of examining the differences in phosphorylation levels for multiple sites within a given protein, which can vary widely. Phosphorylation differences among multiple sites provide insight as to possible key signaling sites for protein-protein interactions.
In our data set, 284 proteins had two or more phosphorylation sites. For example, seven pTyr sites were identified in EGFR (Figure 5b), of which highly phosphorylated sites Y1197 (190 counts), Y1172 (96 counts), Y1110 (57 counts), and Y1092 (26 counts) interact with the key adaptor protein SHC1 and growth factor receptor bound protein 255. IRS2 is another example with five identified pTyr sites (Figure 5c). The two dominantly phosphorylated sites Y677 and Y825 bind to phosphoinositide-3-kinase56, a key signaling component of the EGFR and insulin signaling pathway.
Other proteins with one or two dominant phosphorylation sites include AHNAK (Figure 5d), annexin A2 (ANXA2), breast cancer anti-estrogen resistance 1 (BCAR1), caveolin 1 (CAV1), v-crk sarcoma virus CT10 oncogene homolog (CRK), catenin delta 1 (CTNND1), epithelial cell receptor protein tyrosine kinase (EPHA2), FYN, inositol polyphosphate phosphatase-like 1 (INPPL1), keratin 7 (KRT7), NEDD9, plakophilin 4 (PKP4), PTK2, protein tyrosine phosphatase-2 (PTPN11), SHC1, and tensin 3 (TNS3). Proteins such as cortactin (CTTN), hypothetical protein LOC64762 (FAM59A), ephrin-B2 (EFNB2), SHB (Figure 5e), and signal transduction adaptor molecule 2 (STAM2) show little difference in phosphorylation levels among the different sites. In these examples, phosphorylation trends among multiple sites are generally in good agreement between the two conditions. Note that this type of information cannot be obtained from isotopic labeling methods as they only measure relative differences between conditions.
Responses to EGF stimulation
Recently, dynamic changes of tyrosine phosphorylation in the EGF signaling pathways of the HMEC system have been studied in detail by mass spectrometry-based approaches10, 11. While the main purpose of the current effort is to identify potential novel pTyr sites, we find that the semi-quantitative spectral count-based abundance changes determined for sites following EGF-stimulation studies are in good agreement well with quantitative results reported in previous studies for the sites that were common. Selected phosphorylation sites along with their increased level of phosphorylation following EGF stimulation are listed in Table 3. Corresponding phosphoproteins with a high number of spectral counts in the EGF-stimulated sample include EGFR(Y1092, Y1172 & Y1197), CAV1(Y6), SHC1(Y428), MAPK3(Y204), MAPK1(Y186), KRT7(Y39). CDC2(Y15) and sodium-potassium-ATPase (ATP1A1) (Y260) are example proteins with a high degree of phosphorylation that decreases sharply upon application of EGF. Other phosphoproteins, such as AHNAK(Y468, Y717, Y1222, and Y2906), CBL(Y674), and MYO6(Y1114) are new identifications in the current study. In all cases, EGF stimulation clearly had an effect on the level of phosphorylation.
Table 3.
Examples of phosphorylation sites demonstrating different patterns of response to EGF simulation. Spectral counts for each pTyr site are specified for the Control and EGF stimulated conditions.
| Gene Name | pTyr Position | Control (spectral counts) | EGF (spectral counts) |
|---|---|---|---|
| Increase following EGF stimulation | |||
| EGFR | 998 | 0 | 10 |
| 1092 | 1 | 26 | |
| 1172 | 28 | 190 | |
| 1197 | 21 | 96 | |
| CBL | 674 | 6 | 52 |
| CAV1 | 6 | 2 | 16 |
| MAPK1 | 186 | 43 | 112 |
| MAPK3 | 204 | 49 | 114 |
| MYO6 | 1114 | 0 | 10 |
| SHC1 | 428 | 44 | 117 |
| PLEC1 | 4615 | 0 | 10 |
| AHNAK | 468 | 12 | 66 |
| 717 | 3 | 31 | |
| 1222 | 7 | 32 | |
| 2906 | 0 | 11 | |
| No change following EGF stimulation | |||
| ANAX2 | 42 | 14 | 18 |
| 265 | 88 | 85 | |
| CAV1 | 14 | 28 | 27 |
| CDK2 | 15 | 24 | 24 |
| PKP4 | 478 | 21 | 20 |
| SHB | 355 | 20 | 19 |
| STAT3 | 708 | 18 | 21 |
| Decrease following EGF stimulation | |||
| CDC2 | 15 | 197 | 96 |
| ATP1A1 | 260 | 163 | 89 |
| PTPN11 | 62 | 74 | 37 |
We also observed that phosphorylation levels for a number of proteins appeared to be independent of EGF stimulation. Examples of proteins that exhibited little change between control and EGF conditions include ANXA2(Y42 and Y265), CAV1(Y14), cyclin-dependent kinase 2 (CDK2) (Y15), PKP4(Y478), SHB(Y355), and signal transducer and activator of transcription 3 (STAT3) (Y708). Conversely, phosphorylation levels actually decreased following EGF stimulation in the case of CDC2(Y15), ATP1A1(Y260), and PTPN11(Y62), which is consistent with observations in the other studies10, 11. The consistency among the different studies further demonstrates the reproducibility of phosphorylation levels for particular proteins.
Pathway and protein interaction network analysis
The tyrosine phosphorylated sites identified in the current study can also be mapped to signaling pathways of interest and protein interaction networks based on prior knowledge. Although protein-protein interactions have been extensively reported in the literature 57–59, it is often unclear whether these interacting proteins involve phosphorylation and if so, which residues are modified. Figure 6 shows a simplified phosphoprotein interaction network for proteins downstream of EGFR and IGF1R that was generated from Ingenuity Pathway Analysis tool60. Although IGF1R was not identified in this work, the figure shows that the data set can be utilized to map a pathway of interest to identify what proteins in that pathway are modified. This type of visualization is useful for determining which proteins in network pathways are phosphorylated. The map consists of 31 proteins in the current data set with total represented spectral counts ranging from 1 to 635 (in the case of EGFR). Ten of the proteins: annexin A11 (ANXA11), CBL, IRS2, IRS1, protein tyrosine phosphatase non-receptor type 6 (PTPN6), protein tyrosine phosphatase receptor type K (PTPRK), src-signal transducer and activator of transcription 1 (STAT1), SRC, and c-src tyrosine kinase (CSK), heat shock protein 1 (HSPE1), have not been observed as tyrosine phosphorylated in previous HMEC studies10, 11. Based on the diversity of other proteins that they interact with, many enzymes with multiple and increased phosphorylation upon EGF treatment, such as BCAR1, paxillin (PXN), GAB1, PTK2, PTPN11, and SHC1 are potential “hub” proteins. This information can guide selection of specific target proteins and pTyr sites for follow-up directed quantitative signaling studies.
Figure 6.

An example of protein interaction networks downstream of EGFR and IGF1R. Scheme showing identified proteins that are known to participate in phosphorylation events with EGFR and IGF1R. For simplicity, protein-protein interactions (with 26 additional proteins) were not included on this diagram. Solid lines refer to direct interaction and dashed lines to indirect interactions. The color shading (darker represents higher total spectral counts) is indicative of the total spectral count (or total phosphorylation) on the protein where the total counts are summed across all sites, conditions, and replicates.
CONCLUSIONS
Extensive characterization of tyrosine phosphorylation sites in human cells provides a confident reference dataset useful for hypothesis-driven, as well as directed studies of dynamic cell signaling. The extensive survey of tyrosine phosphorylation in a normal HMEC resulted in identification of 481 unique pTyr sites from 285 proteins, of which 281 pTyr sites were considered as novel for HMEC and 29 pTyr sites had never been reported for the human proteome. The use of available spectral count information for pTyr sites and HMEC global profiling51 revealed known signaling proteins such as GAB1, SHC1, MAPK1 and MAPK3 that had high levels of phosphorylation, but relatively low total abundances (based on spectral count information). This study also uncovered many proteins with multiple pTyr sites and observed that phosphorylation levels were site specific. For a given protein, sites with dominant levels of phosphorylation are usually known to interact with key binding partners involved in signaling pathways, as illustrated by EGFR and IRS2. As such, the site-specific phosphorylation spectral count data provide unique information for determining potentially important pTyr sites and signaling proteins. The extensive coverage of the pTyr sites allows these phosphoproteins to be mapped to specific signaling pathways and protein interaction networks to guide the selection of signaling proteins for directed studies. In summary, this extensive data set of site-specific tyrosine phosphorylation along with the semi-quantitative phosphorylation information for individual pTyr sites provides a reference resource for the scientific community to facilitate more focused biological studies in cell signaling.
Supplementary Material
Acknowledgments
This work was supported in part by the Pacific Northwest National Laboratory Biomolecular Systems Initiative LDRD program, NIH R01 DK074795, the NIH National Center for Research Resources RR018522, and the Environmental Molecular Science Laboratory, a national scientific user facility sponsored by the U.S. Department of Energy (DOE) Office of Biological and Environmental Research and located at Pacific Northwest National Laboratory (PNNL). PNNL is operated by Battelle Memorial Institute for the DOE under Contract No. DE-AC05-76RLO-1830
ABBREVIATIONS
- ACN
acetonitrile
- DTT
dithiothreitol
- EGF
epidermal growth factor
- FDR
false discovery rate
- HMEC
human mammary epithelial cell
- IP
immunoprecipitation
- LC-MS/MS
liquid chromatography coupled with tandem mass spectrometry
- pTyr
phosphotyrosine
- pSer
phosphoserine
- pThr
phosphothreonine
- TFA
trifluoroacetic acid
Footnotes
SUPPORTING INFORMATION AVAILABLE
Full listing of the identified tyrosine phosphorylation sites, all detected unique peptide sequences with corresponding spectral count information, and a comparison of phosphorylation sites with a previously reported global study on the same cell system are available as a Microsoft Excel worksheet. All files are downloadable free of charge at http://pubs.acs.org.
References
- 1.Hunter T, Cooper JA. Protein-Tyrosine Kinases. Annu Rev Biochem. 1985;54(1):897–930. doi: 10.1146/annurev.bi.54.070185.004341. [DOI] [PubMed] [Google Scholar]
- 2.Ficarro SB, McCleland ML, Stukenberg PT, Burke DJ, Ross MM, Shabanowitz J, Hunt DF, White FM. Phosphoproteome analysis by mass spectrometry and its application to Saccharomyces cerevisiae. Nat Biotechnol. 2002;20(3):301–305. doi: 10.1038/nbt0302-301. [DOI] [PubMed] [Google Scholar]
- 3.Olsen JV, Blagoev B, Gnad F, Macek B, Kumar C, Mortensen P, Mann M. Global, in vivo, and site-specific phosphorylation dynamics in signaling networks. Cell. 2006;127(3):635–648. doi: 10.1016/j.cell.2006.09.026. [DOI] [PubMed] [Google Scholar]
- 4.Rush J, Moritz A, Lee KA, Guo A, Goss VL, Spek EJ, Zhang H, Zha XM, Polakiewicz RD, Comb MJ. Immunoaffinity profiling of tyrosine phosphorylation in cancer cells. Nat Biotechnol. 2005;23(1):94–101. doi: 10.1038/nbt1046. [DOI] [PubMed] [Google Scholar]
- 5.Paradela A, Albar JP. Advances in the Analysis of Protein Phosphorylation. J Proteome Res. 2008;7(5):1809–1818. doi: 10.1021/pr7006544. [DOI] [PubMed] [Google Scholar]
- 6.Hoffert JD, Knepper MA. Taking aim at shotgun phosphoproteomics. Anal Biochem. 2008;375(1):1–10. doi: 10.1016/j.ab.2007.11.023. [DOI] [PMC free article] [PubMed] [Google Scholar]
- 7.Morandell S, Stasyk T, Grosstessner-Hain K, Roitinger E, Mechtler K, Bonn GK, Huber LA. Phosphoproteomics strategies for the functional analysis of signal transduction. Proteomics. 2006;6(14):4047–4056. doi: 10.1002/pmic.200600058. [DOI] [PubMed] [Google Scholar]
- 8.Hunter T. The Croonian Lecture 1997. The phosphorylation of proteins on tyrosine: Its role in cell growth and disease. Philos T Roy Soc B. 1998;353(1368):583–605. doi: 10.1098/rstb.1998.0228. [DOI] [PMC free article] [PubMed] [Google Scholar]
- 9.Rikova K, Guo A, Zeng Q, Possemato A, Yu J, Haack H, Nardone J, Lee K, Reeves C, Li Y, Hu Y, Tan Z, Stokes M, Sullivan L, Mitchell J, Wetzel R, MacNeill J, Ren JM, Yuan J, Bakalarski CE, Villen J, Kornhauser JM, Smith B, Li D, Zhou X, Gygi SP, Gu T-L, Polakiewicz RD, Rush J, Comb MJ. Global Survey of Phosphotyrosine Signaling Identifies Oncogenic Kinases in Lung Cancer. Cell. 2007;131(6):1190–1203. doi: 10.1016/j.cell.2007.11.025. [DOI] [PubMed] [Google Scholar]
- 10.Wolf-Yadlin A, Hautaniemi S, Lauffenburger DA, White FM. Multiple reaction monitoring for robust quantitative proteomic analysis of cellular signaling networks. Proc Nat Acad Sci USA. 2007;104(14):5860–5865. doi: 10.1073/pnas.0608638104. [DOI] [PMC free article] [PubMed] [Google Scholar]
- 11.Wolf-Yadlin A, Kumar N, Zhang Y, Hautaniemi S, Zaman M, Kim H-D, Grantcharova V, Lauffenburger DA, White FM. Effects of HER2 overexpression on cell signaling networks governing proliferation and migration. Mol Syst Biol. 2006:2. doi: 10.1038/msb4100094. [DOI] [PMC free article] [PubMed] [Google Scholar]
- 12.Ding SJ, Qian WJ, Smith RD. Quantitative proteomic approaches for studying phosphotyrosine signaling. Expert Rev Proteomics. 2007;4(1):13–23. doi: 10.1586/14789450.4.1.13. [DOI] [PubMed] [Google Scholar]
- 13.Villen J, Beausoleil SA, Gerber SA, Gygi SP. Large-scale phosphorylation analysis of mouse liver. Proc Nat Acad Sci USA. 2007;104(5):1488–1493. doi: 10.1073/pnas.0609836104. [DOI] [PMC free article] [PubMed] [Google Scholar]
- 14.Zhang Y, Wolf-Yadlin A, Ross PL, Pappin DJ, Rush J, Lauffenburger DA, White FM. Time-resolved mass spectrometry of tyrosine phosphorylation sites in the epidermal growth factor receptor signaling network reveals dynamic modules. Mol Cell Proteomics. 2005;4(9):1240–1250. doi: 10.1074/mcp.M500089-MCP200. [DOI] [PubMed] [Google Scholar]
- 15.Zheng H, Hu P, Quinn DF, Wang YK. Phosphotyrosine Proteomic Study of Interferon alpha Signaling Pathway Using a Combination of Immunoprecipitation and Immobilized Metal Affinity Chromatography. Mol Cell Proteomics. 2005;4(6):721–730. doi: 10.1074/mcp.M400077-MCP200. [DOI] [PubMed] [Google Scholar]
- 16.Lemeer S, Ruijtenbeek R, Pinkse MWH, Jopling C, Heck AJR, den Hertog J, Slijper M. Endogenous Phosphotyrosine Signaling in Zebrafish Embryos. Mol Cell Proteomics. 2007;6(12):2088–2099. doi: 10.1074/mcp.M600482-MCP200. [DOI] [PubMed] [Google Scholar]
- 17.Stampfer MR, Yaswen P. Culture systems for study of human mammary epithelial cell proliferation, differentiation and transformation. Cancer Surv. 1993;18:7–34. [PubMed] [Google Scholar]
- 18.Jacobs JM, Waters KM, Kathmann LE, Camp IIDG, Wiley HS, Smith RD, Thrall BD. The Mammary Epithelial Cell Secretome and Its Regulation by Signal Transduction Pathways. J Proteome Res. 2008;7(2):558–569. doi: 10.1021/pr0704377. [DOI] [PubMed] [Google Scholar]
- 19.Rodland KD, Bollinger N, Ippolito D, Opresko LK, Coffey RJ, Zangar R, Wiley HS. Multiple mechanisms are responsible for transactivation of the epidermal growth factor receptor in mammary epithelial cells. J Biol Chem. 2008:M800456200. doi: 10.1074/jbc.M800456200. [DOI] [PMC free article] [PubMed] [Google Scholar]
- 20.Willmarth NE, Ethier SP. Autocrine and Juxtacrine Effects of Amphiregulin on the Proliferative, Invasive, and Migratory Properties of Normal and Neoplastic Human Mammary Epithelial Cells. J Biol Chem. 2006;281(49):37728–37737. doi: 10.1074/jbc.M606532200. [DOI] [PubMed] [Google Scholar]
- 21.Mayya V, Rezual K, Wu L, Fong MB, Han DK. Absolute Quantification of Multisite Phosphorylation by Selective Reaction Monitoring Mass Spectrometry: Determination of Inhibitory Phosphorylation Status of Cyclin-Dependent Kinases. Mol Cell Proteomics. 2006;5(6):1146–1157. doi: 10.1074/mcp.T500029-MCP200. [DOI] [PubMed] [Google Scholar]
- 22.Stampfer MR, Bartley JC. Induction of transformation and continuous cell lines from normal human mammary epithelial cells after exposure to benzo[a]pyrene. Proc Nat Acad Sci USA. 1985;82(8):2394–2398. doi: 10.1073/pnas.82.8.2394. [DOI] [PMC free article] [PubMed] [Google Scholar]
- 23.Band V, Sager R. Distinctive traits of normal and tumor-derived human mammary epithelial cells expressed in a medium that supports long-term growth of both cell types. Proc Nat Acad Sci USA. 1989;86(4):1249–1253. doi: 10.1073/pnas.86.4.1249. [DOI] [PMC free article] [PubMed] [Google Scholar]
- 24.Stampfer MR, Pan CH, Hosoda J, Bartholomew J, Mendelsohn J, Yaswen P. Blockage of EGF receptor signal transduction causes reversible arrest of normal and immortal human mammary epithelial cells with synchronous reentry into the cell cycle. Exp Cell Res. 1993;208(1):175–188. doi: 10.1006/excr.1993.1236. [DOI] [PubMed] [Google Scholar]
- 25.Mayampurath AM, Jaitly N, Purvine SO, Monroe ME, Auberry KJ, Adkins JN, Smith RD. DeconMSn: a software tool for accurate parent ion monoisotopic mass determination for tandem mass spectra. Bioinfomatics. 2008;24(7):1021–1023. doi: 10.1093/bioinformatics/btn063. [DOI] [PMC free article] [PubMed] [Google Scholar]
- 26.Craig R, Beavis RC. TANDEM: matching proteins with tandem mass spectra. Bioinformatics. 2004;20(9):1466–1467. doi: 10.1093/bioinformatics/bth092. [DOI] [PubMed] [Google Scholar]
- 27.Nesvizhskii AI, Keller A, Kolker E, Aebersold R. A Statistical Model for Identifying Proteins by Tandem Mass Spectrometry. Anal Chem. 2003;75(17):4646–4658. doi: 10.1021/ac0341261. [DOI] [PubMed] [Google Scholar]
- 28.Qian WJ, Liu T, Monroe ME, Strittmatter EF, Jacobs JM, Kangas LJ, Petritis K, CampIi DG, Smith RD. Probability-Based Evaluation of Peptide and Protein Identifications from Tandem Mass Spectrometry and SEQUEST Analysis: The Human Proteome. J Proteome Res. 2005;4(1):53–62. doi: 10.1021/pr0498638. [DOI] [PubMed] [Google Scholar]
- 29.Liu H, Sadygov RG, Yates JR. A Model for Random Sampling and Estimation of Relative Protein Abundance in Shotgun Proteomics. Anal Chem. 2004;76(14):4193–4201. doi: 10.1021/ac0498563. [DOI] [PubMed] [Google Scholar]
- 30.Diella F, Gould CM, Chica C, Via A, Gibson TJ. Phospho.ELM: a database of phosphorylation sites update 2008. Nucleic Acids Res. 2008;36(suppl_1):D240–244. doi: 10.1093/nar/gkm772. [DOI] [PMC free article] [PubMed] [Google Scholar]
- 31.Hornbeck PV, Chabra I, Kornhauser JM, Skrzypek E, Zhang B. Phosphosite: A bioinformatics resource dedicated to physiological protein phosphorylation. Proteomics. 2004;4(6):1551–1561. doi: 10.1002/pmic.200300772. [DOI] [PubMed] [Google Scholar]
- 32.Schwartz D, Gygi SP. An iterative statistical approach to the identification of protein phosphorylation motifs from large-scale data sets. Nat Biotechnol. 2005;23(11):1391–1398. doi: 10.1038/nbt1146. [DOI] [PubMed] [Google Scholar]
- 33.Wang N, Li L. Exploring the Precursor Ion Exclusion Feature of Liquid Chromatography & Electrospray Ionization Quadrupole Time-of-Flight Mass Spectrometry for Improving Protein Identification in Shotgun Proteome Analysis. Anal Chem. 2008;80(12):4696–4710. doi: 10.1021/ac800260w. [DOI] [PubMed] [Google Scholar]
- 34.White MF. IRS proteins and the common path to diabetes. Am J Physiol Endocrinol Metab. 2002;283(3):E413–422. doi: 10.1152/ajpendo.00514.2001. [DOI] [PubMed] [Google Scholar]
- 35.Dong X, Park S, Lin X, Copps K, Yi X, White MF. Irs1 and Irs2 signaling is essential for hepatic glucose homeostasis and systemic growth. J Clin Invest. 2006;116(1):101–114. doi: 10.1172/JCI25735. [DOI] [PMC free article] [PubMed] [Google Scholar]
- 36.Greene MW, Garofalo RS. Positive and Negative Regulatory Role of Insulin Receptor Substrate 1 and 2 (IRS-1 and IRS-2) Serine/Threonine Phosphorylation. Biochemistry. 2002;41(22):7082–7091. doi: 10.1021/bi015992f. [DOI] [PubMed] [Google Scholar]
- 37.Tachibana K, Urano T, Fujita H, Ohashi Y, Kamiguchi K, Iwata S, Hirai H, Morimoto C. Tyrosine Phosphorylation of Crk-associated Substrates by Focal Adhesion Kinase. A Punative Mechanism for the Intergrin-mediated Tyrosine Phosphorylation of Crk-Assosciated Substrates. J Biol Chem. 1997;272(46):29083–29090. doi: 10.1074/jbc.272.46.29083. [DOI] [PubMed] [Google Scholar]
- 38.Manie SN, Beck ARP, Astier A, Law S, Canty T, Hirai H, Druker BJ, Avraham H, Haghayeghi N, Sattler M, Salgia R, Griffin J, Golemis E, Freedman AS. Involvement of p130Cas and p105HEF1, a Novel Cas-like Docking Protein, in a Cytoskeleton-dependent Signaling Pathway Initiated by Ligation of Integrin or Antigen Receptor on Human B Cells. J Biol Chem. 1997;272(7):4230–4236. doi: 10.1074/jbc.272.7.4230. [DOI] [PubMed] [Google Scholar]
- 39.van Seventer G, Salmen HJ, Law SF, O'Neill GM, Mullen MM, Franz AM, Kanner SB, Golemis EA, van Seventer Jean M. Focal adhesion kinase regulates beta1integrin-dependent T cell migration through an HEF1 effector pathway. Eur J Immunol. 2001;31(5):1417–1427. doi: 10.1002/1521-4141(200105)31:5<1417::AID-IMMU1417>3.0.CO;2-C. [DOI] [PubMed] [Google Scholar]
- 40.Law SF, O'Neill GM, Fashena SJ, Einarson MB, Golemis EA. The Docking Protein HEF1 Is an Apoptotic Mediator at Focal Adhesion Sites. Mol Cell Biol. 2000;20(14):5184–5195. doi: 10.1128/mcb.20.14.5184-5195.2000. [DOI] [PMC free article] [PubMed] [Google Scholar]
- 41.Lee IH, Lim HJ, Yoon S, Seong JK, Bae DS, Rhee SG, Bae YS. Ahnak Protein Activates Protein Kinase C (PKC) through Dissociation of the PKC-Protein Phosphatase 2A Complex. J Biol Chem. 2008;283(10):6312–6320. doi: 10.1074/jbc.M706878200. [DOI] [PubMed] [Google Scholar]
- 42.Zondag GCM, Koningstein GM, Jiang Y-P, Sap J, Moolenaar WH, Gebbink MFBG. Homophilic Interactions Mediated by Receptor Tyrosine Phosphatases μ and kappa. 1995;270:14247–14250. doi: 10.1074/jbc.270.24.14247. [DOI] [PubMed] [Google Scholar]
- 43.Novellino L, De Filippo A, Deho P, Perrone F, Pilotti S, Parmiani G, Castelli C. PTPRK negatively regulates transcriptional activity of wild type and mutated oncogenic [beta]-catenin and affects membrane distribution of [beta]-catenin/E-cadherin complexes in cancer cells. Cell Signal. 2008;20(5):872–883. doi: 10.1016/j.cellsig.2007.12.024. [DOI] [PubMed] [Google Scholar]
- 44.Zahedi R, Lewandrowski U, Wiesner J, Wortelkamp S, Moebius J, Schuetz C, Walter U, Gambaryan S, Sickmann A. Phosphoproteome of Resting Human Platelets. J Proteome Res. 2008;7(2):526–534. doi: 10.1021/pr0704130. [DOI] [PubMed] [Google Scholar]
- 45.Wang W, Shang L-H, Jacobs DO. Complement regulatory protein CD59 involves c-SRC related tyrosine phosphorylation of the creatine transporter in skeletal muscle during sepsis. Surgery. 2002;132(2):334–340. doi: 10.1067/msy.2002.125312. [DOI] [PubMed] [Google Scholar]
- 46.Cascón A, Escobar B, Montero-Conde C, Rodríguez-Antona C, Ruiz-Llorente S, Osorio A, Mercadillo F, Letón R, Campos JM, García-Sagredo JM, Marcos JB, Robledo MM. Loss of the actin regulator HSPC300 results in clear cell renal cell carcinoma protection in Von Hippel-Lindau patients. Hum Mutat. 2007;28(6):613–621. doi: 10.1002/humu.20496. [DOI] [PubMed] [Google Scholar]
- 47.Katoh Y, Shiba Y, Mitsuhashi H, Yanagida Y, Takatsu H, Nakayama K. Tollip and Tom1 Form a Complex and Recruit Ubiquitin-conjugated Proteins onto Early Endosomes. J Biol Chem. 2004;279(23):24435–24443. doi: 10.1074/jbc.M400059200. [DOI] [PubMed] [Google Scholar]
- 48.Kayagaki N, Phung Q, Chan S, Chaudhari R, Quan C, O'Rourke KM, Eby M, Pietras E, Cheng G, Bazan JF, Zhang Z, Arnott D, Dixit VM. DUBA: A Deubiquitinase That Regulates Type I Interferon Production. Science. 2007;318(5856):1628–1632. doi: 10.1126/science.1145918. [DOI] [PubMed] [Google Scholar]
- 49.Amanchy R, Periaswamy B, Mathivanan S, Reddy R, Tattikota SG, Pandey A. A curated compendium of phosphorylation motifs. Nat Biotechnol. 2007;25(3):285–286. doi: 10.1038/nbt0307-285. [DOI] [PubMed] [Google Scholar]
- 50.Walchli S, Espanel X, Harrenga A, Rossi M, Cesareni G, Hooft van Huijsduijnen R. Probing protein-tyrosine phosphatase substrate specificity using a phosphotyrosine-containing phage library. J Biol Chem. 2004;279(1):311–318. doi: 10.1074/jbc.M307617200. [DOI] [PubMed] [Google Scholar]
- 51.Liu T, Qian W-J, Chen W-NU, Jacobs JM, Moore RJ, Anderson DJ, Gritsenko MA, Monroe ME, Thrall BD, II, DGC, Smith RD. Improved proteome coverage by using high efficiency cysteinyl peptide enrichment: The human mammary epithelial cell proteome. Proteomics. 2005;5(5):1263–1273. doi: 10.1002/pmic.200401055. [DOI] [PMC free article] [PubMed] [Google Scholar]
- 52.Blagoev B, Ong S-E, Kratchmarova I, Mann M. Temporal analysis of phosphotyrosine-dependent signaling networks by quantitative proteomics. Nat Biotechnol. 2004;22(9):1139–1145. doi: 10.1038/nbt1005. [DOI] [PubMed] [Google Scholar]
- 53.Oda K, Matsuoka Y, Funahashi A, Kitano H. A comprehensive pathway map of epidermal growth factor receptor signaling. Mol Syst Biol. 2005:1. doi: 10.1038/msb4100014. [DOI] [PMC free article] [PubMed] [Google Scholar]
- 54.Wang Y, Ding S-J, Wang W, Jacobs JM, Qian W-J, Moore RJ, Yang F, Camp DG, Smith RD, Klemke RL. Profiling signaling polarity in chemotactic cells. Proc Nat Acad Sci USA. 2007;104(20):8328–8333. doi: 10.1073/pnas.0701103104. [DOI] [PMC free article] [PubMed] [Google Scholar]
- 55.Schulze WX, Deng L, Mann M. Phosphotyrosine interactome of the ErbB-receptor kinase family. Mol Syst Biol. 2005:1. doi: 10.1038/msb4100012. [DOI] [PMC free article] [PubMed] [Google Scholar]
- 56.Hanke S, Mann M. The phosphotyrosine interactome of the insulin receptor family and its substrates IRS-1 and IRS-2. Mol Cell Proteomics. 2008:M800407–MCP800200. doi: 10.1074/mcp.M800407-MCP200. [DOI] [PMC free article] [PubMed] [Google Scholar]
- 57.Kolch W. Meaningful relationships: the regulation of the Ras/Raf/MEK/ERK pathway by protein interactions. Biochem J. 2000;351:289–305. [PMC free article] [PubMed] [Google Scholar]
- 58.De Las Rivas J, de Luis A. Interactome data and databases: different types of protein interaction. Compar Funct Genom. 2004;5(2):173–178. doi: 10.1002/cfg.377. [DOI] [PMC free article] [PubMed] [Google Scholar]
- 59.Kelly WP, Stumpf MPH. Protein-protein interactions: from global to local analyses. Curr Opin Biotechnol. 2008;19(4):396–403. doi: 10.1016/j.copbio.2008.06.010. [DOI] [PubMed] [Google Scholar]
- 60.Mayburd AL, Martinez A, Sackett D, Liu HT, Shih J, Tauler J, Avis I, Mulshine JL. Ingenuity network-assisted transcription profiling: Identification of a new pharmacologic mechanism for MK886. Clin Cancer Res. 2006;12(6):1820–1827. doi: 10.1158/1078-0432.CCR-05-2149. [DOI] [PubMed] [Google Scholar]
Associated Data
This section collects any data citations, data availability statements, or supplementary materials included in this article.