

Abstract
Linearly growing ultrathin polyelectrolyte multilayers (PEMs) films of strong polyelectrolytes, poly(diallyldimethylammonium chloride) (PDAC) and sulfonated poly(styrene), sodium salt (SPS), exhibit a gradual shift from cytophilic to cytophobic behavior, with increasing thickness for films of less than 100nm. Previous explanations based on film hydration, swelling or changes in elastic modulus cannot account for the cytophobicity observed with these thin films as the number of bilayers increases. We implemented a finite element analysis to help elucidate the observed trends in cell spreading. The simulation results suggest that cells maintain a constant level of energy consumption (energy homeostasis) during active probing and thus respond to changes in the film stiffness as the film thickness increases by adjusting their morphology and the amount of focal adhesions recruited, and thereby attachment onto a substrate.
Keywords: polyelectrolyte multilayers, linear growth, cell adhesion, mechanotransduction, cellular homeostasis, focal adhesion
Introduction
A major challenge in the field of tissue engineering is to optimize the surface characteristics to achieve a controlled or desired level of cell adhesion under physiological conditions. The cell adhesive property of the surfaces can be modulated through various physical, chemical and mechanical properties of the surface, individually or in combination. These properties include the hydrophobicity and hydrophilicity1, surface charge2, surface roughness or topography3, 4, and stiffness5-7 of the substrate. Layer-by-layer (LbL) assembled polyelectrolyte multilayer (PEM) thin films, introduced by Decher8, provide a versatile approach for altering physical, chemical or mechanical properties of a substrate to address this challenge. Over the past decade, LbL films have shown promise for various clinically relevant biological applications9. For example, cytophobic (cell resistive) LbL thin film coatings on implantable hydrogels for nerve repair applications4, 10 have been put forth as a possible method for controlling the growth of leptomeningeal fibroblasts, which hinder the progression of regenerating axons4. LbL films have also been applied to create three-dimensional cellular multilayers11, patterned co-cultures2, microarrays12, biosensors13, functional cell surfaces14, etc. Many of these applications capitalize on the tunability of the cell adhesive behavior on the thin films.
Different deposition parameters, such as the type and composition of polyelectrolytes15-18, pH19-22 and salt concentration19, 23-30, during LbL fabrication influence the film swelling, hydration, and mobility of the polymer chains within the films. These factors affect the intrinsic properties of the LbL films, such as surface roughness, stiffness, degree of hydration, and thickness, which in-turn, alter the cytophobic or cytophilic characteristic of the surface15, 16, 19, 21, 31, 32. Here, we show that increasing the number of bilayers of PDAC/SPS films from 10 to 20, corresponding to a film thickness of 37.6nm (~ 40nm) to 95.9nm (~ 100 nm), respectively, switches the films from a cytophilic to a cytophobic surface (Schematic 1). We demonstrate this effect with bone marrow mesenchymal stem cells (MSCs) and NIH3T3 fibroblasts. The thickness increases linearly as the number of bilayers increases, causing a shift to cytophobic behavior with concomitant decrease in cell spreading and adhesion (see Results and Discussion). A factor previously shown to influence the cell adhesion of linearly growing PEMs consisting of strong polyelectrolytes, i.e. high ionic strength of the deposition salts19 which causes film swelling and hydration, was kept constant in this study. Therefore, the salt concentration cannot explain the switch in the adhesive behavior observed as the number of bilayers (deposition cycles) increases.
Schematic 1.
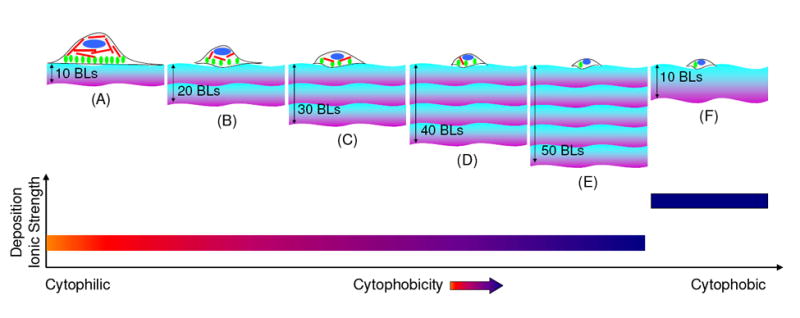
Diagram showing multilayers composed of linearly growing strong polyelectrolytes i.e. PDAC and SPS, fabricated at a deposition ionic strength of 0.1M NaCl, exhibit increased cytophobicity as the number of bilayers increases, as shown in images (A) to (E). Bands with violet and blue colors represents positively charged PDAC and negatively charged SPS polyelectrolyte chains, respectively; and one set of violet/purple colored band represents ten bilayers of PDAC/SPS. Red, green and blue colors inside the cell structure represent actin filaments, focal adhesion contacts and nucleus of the cell, respectively. Image (F) illustrates a previous study19 with a higher deposition ionic strength, the multilayers exhibit more cytophobicity due to swelling and hydration within the multilayer structure. The thickness band in image (F) represents a more loopy configuration of the polyelectrolytes with enhanced swelling and hydration within the multilayer19 as compared to those in images (A-E).
Cellular adhesion behavior in response to their physical surroundings (i.e. substrate) are modulated through mechanotransduction33-35. In order to sense mechanical states or changes in their surroundings, cells actively apply traction forces on the substrate through focal adhesion proteins and complexes. The mechanical response of the substrate from active probing is then transmitted through the pre-stressed cytoskeleton by actin filaments and other signaling molecules, finally reaching the inner nuclear membrane proteins34-36. The pre-stress is the pre-existing tensional stress borne by the cytoskeleton. The fidelity and speed of this intracellular mechanical signaling is modulated through the pre-stress of the cytoskeletal filaments. It is suggested that remodeling of the focal adhesions plays a critical role in regulating the pre-stress by recruiting and anchoring actin filaments, thereby balancing the pre-stress of the cytoskeleton with the traction on the substrate. When the pre-stress is perturbed above a threshold value, the cells rapidly remodel in an attempt to maintain a homeostatic state36. To date, however, mathematical models have addressed only the role of matrix mechanical properties in directing cell adhesion on substrate, but have not incorporated recent understanding of active cellular mechanosensing, the cellular pre-stress, and focal adhesion remodeling in mechanotransduction37, 38.
Thus, to explain the experimentally observed contraction in the cell area as the number of PDAC/SPS bilayers increases, we implemented a two-dimensional, axisymmetric finite element model of the film subject to traction forces generated by the focal adhesions. Then, we correlated the deformation of the cell focal adhesion contact area to the mechanical stiffness of the thin LbL films that the cells are able to sense and the stored energy in the film due to the cellular traction to the energy required by a cell to maintain a constant traction force. Our approach is similar to the recent work by Sen et al.37, who used an axisymmetric finite element model to determine how deep the cells sense their substrate. Sen et al., however, calculated cellular spreading energetics in terms of the strain energy stored within the cell and proposed a relative energy index (the ratio of the strain energies between two different cell sizes multiplied by an efficiency factor) that governs cell spreading which requires an estimation of the cell volume37. In contrast, we calculate the strain energy stored by the film undergoing deformation due to the traction force generated by the cell, thus this quantity measures the amount of work done by the cell on the film. The advantage of correlating the stored strain energy in the film with cellular spreading energetics is that this calculation is independent of the volume of the cell and the structural remodeling of the cytoskeleton within the cell (i.e. the cytoskeleton incurs remodeling in order to reduce the stress in its actin fibers39-41). Using the computational simulation, we were able to explain the observed cell adhesion behavior with respect to increasing film thickness.
Materials and Methods
Materials
Sulfonated poly(styrene), sodium salt (SPS) (Mw ~ 70,000), poly(diallyldimethylammonium chloride) (PDAC) (Mw ~ 100,000 – 200,000) as a 20 wt% solution, sodium chloride (NaCl), and epidermal growth factor were purchased from Sigma-Aldrich (USA). Barnstead Nanopure Diamond (Barnstead International, Dubuque, IA) purification system was used as a source for deionized (DI) water with a resistivity of 18.2 MΩ cm. Dulbecco’s modified Eagle medium (DMEM), fetal bovine serum (FBS), penicillin, streptomycin, 0.25% trypsin-EDTA, 1X-phosphate buffered saline (PBS), and immunostaining components (rabbit anti-paxillin antibody, Alexa Fluor 488 goat anti-rabbit IgG secondary antibody, Texas Red-X phalloidin, DAPI, and ProLong Gold mounting medium) were purchased from Invitrogen (Carlsbad, CA).
Polyelectrolyte Multilayer (PEM) Fabrication
PDAC and SPS polyelectrolyte solutions used to fabricate the multilayer assemblies were prepared in DI water to final concentrations of 10mM each with respect to the repeat unit of the polyelectrolytes, with an ionic strength of 0.1M NaCl. The deposition ionic strength of 0.1M NaCl was kept constant in fabricating the multilayer assemblies of varying number of PEM bilayers. Solutions were filtered with a 0.22 μm cellulose acetate filter (Corning, NY) before use. Multilayers were fabricated on tissue culture polystyrene (TCPS) plates (Costar, Corning, NY), glass (Corning Glass Works, Corning, NY) (for confocal and AFM imaging), or gold (for ellipsometric measurements) substrates. Glass slides were cleaned with DI water followed by 100% ethanol and dried under N2 gas. Prior to beginning the multilayer fabrication process, TCPS plates and glass slides were further cleaned using a plasma cleaner (Harrick Scientific Corporation, NY) for 10 min at 0.15 torr and 50 sccm flow of O2. Gold slides were cleaned in piranha solution (7:3; concentrated sulfuric acid: 30% hydrogen peroxide) (Caution: piranha solution reacts violently with organic material, handle with extreme care), dried under N2 gas and coated with lipoic acid (Sigma–Aldrich) followed by multilayer deposition. Here, plasma treated TCPS or glass, and lipoic acid coated gold are henceforth referred to as “substrates” for multilayer deposition. A Carl Zeiss slide stainer was used to prepare all multilayers. To form the first bilayer, substrate was immersed for 20 min in a PDAC solution, followed by two sets of 5 min rinses in DI water with agitation, and subsequent placement of the substrate in a SPS solution for 20 min. Substrate was then rinsed twice in DI water for 5 min each. Depositing a layer of polycation/polyanion pair was followed by a 2 min ultrasonic cleaning in DI water to remove weakly bounded polyelectrolytes. This process was repeated to build multiple layers, abbreviated as (PDAC/SPS)n, where n represents the number of PDAC/SPS bilayers (BLs), and equals to 10, 20, 30, 40 or 50 with SPS as the topmost layer in each case. Cell adhesion experiments were also performed on multilayers with PDAC as the topmost layer for fibroblast cell type and similar results were obtained (data not shown). After assembly, the films were allowed to air dry and were stored in a covered container under ambient conditions until use.
Cell Cultures
All procedures of cell isolation were approved by the Institutional Animal Care and Use Committee at Michigan State University. Multilayer coated substrates were sterilized under UV light using a germicidal 30W UV-C lamp (Philips, TUV 30W/G30T8) for at least 20 minutes prior to cell seeding. Unless specified otherwise, cells on the surfaces were cultured in FBS supplemented medium.
Bone Marrow MSCs
Bone marrow mesenchymal stem cells were isolated from 6-8 week old Sprague-Dawley female rats as previously described42. In brief, femurs and tibias from a 6-8 week old rat were dissected and the two ends were cut open. The marrow was flushed out using a needle and syringe. The cell suspension was filtered through a 65μm nylon mesh to remove bone debris and blood aggregates. Cells were cultured in DMEM (catalog no. 11885, Invitrogen) supplemented with 10% FBS, 100 μg/ml streptomycin and 100U/ml penicillin, and placed in the incubator with a humidified atmosphere containing 5% CO2 at 37°C. Non-adherent cells were removed on the second day after plating. The medium was replaced every 3 to 4 days until the cells reached 90% confluence. Confluent cells were detached by 0.25% trypsin-EDTA and plated at a density of 5×10⁴ cells per ml with 2 ml added to all surfaces studied.
Fibroblasts
NIH3T3 fibroblasts were purchased from American Type Culture Collection (USA). Cells were cultured in DMEM (high glucose (4.5 g/l) and sodium bicarbonate (3.7 g/l), catalog no. 11995, Invitrogen) supplemented with 10% FBS, 100 μg/ml streptomycin and 100 U/ml penicillin, and placed in the incubator with a humidified atmosphere containing 10% CO2 at 37°C. Cells grown to 80% confluency were detached by 0.25% trypsin-EDTA and plated at a density of 3×10⁵ cells per ml with 2 ml added to all surfaces studied. The cell culture medium was replaced with fresh 2 ml medium 24 hrs post cell seeding.
Cell Immunostaining
Immunocytochemistry was performed 48 hrs post cell seeding on the surfaces at room temperature. Cells were rinsed with PBS, followed by fixation with 4.0% paraformaldehyde in PBS for 15 min, rinsed 3 times in PBS, then permeabilized with 0.1% Triton X-100 in PBS for 15 min and washed 3 times with PBS. After washing, cells were blocked in 1% Bovine Serum Albumin (BSA, US Biological) for 30 minutes. Cells were incubated with rabbit anti-paxillin primary antibody (1:50 dilution in 1% BSA solution) for 1 hour followed by three washes in 1X PBS, and then incubated with Alexa Fluor 488 goat anti-rabbit IgG secondary antibody (1:500 dilution in 1% BSA solution) for 1 hour. Cells were washed further, three times in 1X PBS. During secondary antibody incubation, cells were additionally incubated with Texas Red-X phalloidin (5μl stock per 200μl of 1% BSA solution) to visualize actin filaments (data not shown). Cells were then incubated for 5 minutes in 300nM DAPI (Invitrogen) to visualize the nucleus. After two final washes with 1X PBS, dry glass slides were removed from each well, and ProLong Gold mounting medium (Invitrogen) was applied to the stained the cells. Thin cover-slips (22 mm square, Corning) were adhered to the substrates, taking care to avoid air bubbles. Mounted and stained cover-slips were allowed to cure for 24 hours at room temperature in the dark.
Cell Imaging
Confocal laser scanning microscopy (CLSM) images were obtained with Olympus Fluoview 1000 laser scanning confocal microscope using 40X oil objective. Phase contrast images were collected with Leica DM IL inverted microscope (Bannockburn, IL) equipped with SPOT RT color camera (Diagnostics Instruments, MI) using 10X dry objective.
Computational Methodology
Calculation of Mean Cell Adhesion Areas
To obtain the cell and focal adhesion areas, images from cell immunostaining were subject to image analysis using NIS-Elements BR 3.0 (Nikon Instruments, NY). To determine the number of focal adhesions acting within a cell in a particular image, a binary highlighting on a RGB (red, green, blue) scale was used. Then, a region of interest (ROI) area was created around the individual cells. Finally, the ratio of ROI area to binary highlighting within each ROI was calculated to determine the active area for computation. Average cell and focal adhesion areas were calculated from ROIs combined from at least three different cell images for a given film thickness. Finally, assuming the cell and focal adhesion areas to be circular, the equivalent cell and focal adhesion radii were calculated for the finite element model. The results of these calculations are summarized in Tables 1 and 2 for MSCs and fibroblasts, respectively. Note that for both cell types, the cell area decreased as the number of bilayers were increased, which is consistent with the experimental findings from Maloney et al.38.
Table 1.
The cell and focal adhesion radii are calculated from the average cell and focal adhesion areas of the MSCs, where the focal adhesion area is the sum of all focal adhesions in a single cell.
| Number of Bilayers | Cell Area (μm2) | Cell Radius (μm) | FA Area (μm2) | FA Radius (μm) |
|---|---|---|---|---|
| Control | 4917 | 39.4 | 1935 | 24.5 |
| 10 BLs | 3664 | 33.6 | 1545 | 21.7 |
| 20 BLs | 2031 | 24.5 | 896 | 16.6 |
| 30 BLs | 1545 | 22.0 | 1049 | 18.1 |
| 40 BLs | 1405 | 21.1 | 896 | 16.9 |
| 50 BLs | 738 | 15.1 | 454 | 11.8 |
Table 2.
The cell and focal adhesion radii are calculated from the average cell and focal adhesion areas of the fibroblasts, where the focal adhesion area is the sum of all focal adhesions in a single cell.
| Number of Bilayers | Cell Area (μm2) | Cell Radius (μm) | FA Area (μm2) | FA Radius (μm) |
|---|---|---|---|---|
| Control | 1611 | 22.0 | 1215 | 17.7 |
| 10 BLs | 1274 | 19.3 | 543 | 12.9 |
| 20 BLs | 791 | 15.8 | 173 | 7.4 |
| 30 BLs | 657 | 14.4 | 319 | 10.1 |
| 40 BLs | 387 | 11.1 | 88 | 4.2 |
| 50 BLs | 384 | 11.0 | 142 | 6.7 |
Finite Element Model
To study how the thickness of the substrate film influences cellular probing, a two-dimensional, axisymmetric finite element model of a PDAC/SPS film was constructed. As shown in Schematic 2a and 2b, we assume an ideal circular shape for a cell on the film, and as a boundary condition, assume constant traction (force/area) generated by focal adhesion complexes. The mean cell and focal adhesion radii (Ro and Ri, respectively) calculated from the cell immunostaining are used to prescribe the cell adhesion area for each film thickness. For the model shown in Schematic 2a and 2b, the cell area is defined as the film surface area encompassed by the outer edges of the cell. The focal adhesion area, then, is a region that exists within the cell area that exhibits adhesion. The bottom boundary was fixed, with all other boundaries unconstrained. The focal adhesion area was also idealized to an annulus spanning from the outer edge of the cell, which is consistent with Munevar et al.43, who used force microscopy to show that the majority of the traction generated by focal adhesions is located near or at the outer edges of the cell. Although the distribution of expression of focal adhesion proteins and the traction force on the substrate can be heterogeneous and localized near the cell boundary39, 40, the total adhesion force exerted by a cell increases proportionally with increasing focal adhesion area41. It has been also shown that the assumption of uniformly distributed binding with a constant force on each bond provides excellent agreement with experimental observations of adhesion strength44. Since we are interested in the average cell morphology and cell-substrate interactions, we assume that the traction (force/area) exerted by the cell is constant over the focal adhesion area.
Schematic 2.
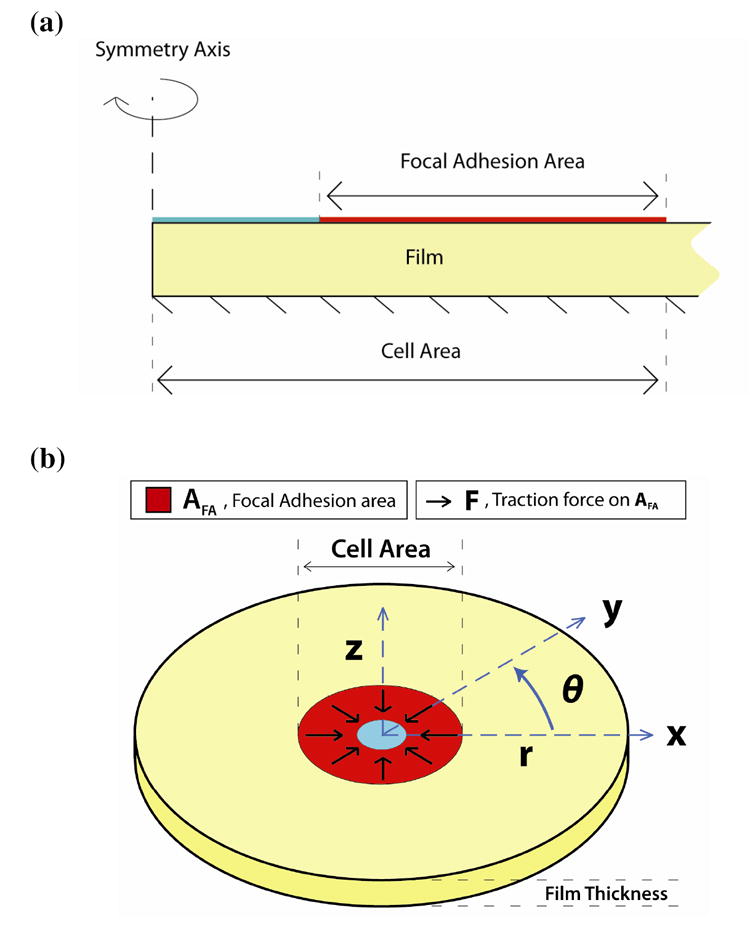
(a) Two-dimensional drawing of the axisymmetric computational domain. All forces are imposed on the boundary marked “Focal Adhesion Area”, where the bottom is fixed. In the computations, the film extends to a radius about ten-fold that of the cell area in order to eliminate edge effects (the drawing is not to scale). (b) Three-dimensional representation of the finite element model. This drawing shows the analog between the cartesian and cylindrical coordinates used in the axisymmetric model, as well as the direction of traction force over the focal adhesion area domain. The forces generated by the focal adhesion area are directed radially inward to simulate the effect of cellular probing.
| Modeling Assumptions | Reference | Modeling Limitations |
| Rigid attachment between film and glass | 45 | Neglect mechanical crosstalk between cells |
| Axisymmetric cell shape | 38 | Neglect effect of dynamic cellular motion |
| Constant traction force | 44 | Neglect cell clumping effects |
| Linear elastic material | 46 | Neglect surface roughness |
Model Parameter Values
The PEM film was assumed to be an isotropic, linear elastic material based on previous results from Oommen et al., which showed using finite element analysis that with film thicknesses less than ~200 nm, the mechanical response of both linear and hyper-elastic materials are similar46. Thus the PEM film can be modeled with two independent material parameters, the Young’s modulus and the Poisson’s ratio. PDAC/SPS multilayers have been reported with varying Young’s Modulus values, depending on whether they are planar or capsule PEMs30, 47-49. Here, we used a previously reported elastic modulus of 24 MPa for planar PDAC/SPS multilayers48 to calculate the mean displacement and energy used by the cell, where the deposition conditions were the same and the number of deposition cycles (130 layers) were close to that used in the present study. The Poisson’s ratio of the film was taken to be 0.3347. Additionally, for control simulations (i.e. no film), 50 GPa was used as the Young’s Modulus for glass37. The portion of the top boundary occupied by the focal adhesion complexes was subject to an inward traction of 30 kdyn/cm2 (3 kPa) for the MSCs50 and 20 kdyn/cm2 (2 kPa) for the fibroblasts51.
Finally, we use film thickness values based on a best-fit line calculated by comparing our data to ellipsometric measurements done by Krogman et al.28.
Calculations: Effective Stiffness
Previous studies on cell probing have used stress, strain, and stiffness as quantities that affect the cell’s behavior, which are independent of the cell5, 43, 52, 53. They correlated Young’s modulus or an “effective modulus” of the material to the mechanosensitive behavior of the cells. This captures only the material properties of the substrate, which, by itself, may not directly capture the stiffness that the cells sense. More recent studies suggest that cell probing could be understood in terms of the mechanical response of the substrate upon active cell pulling37, 54. To determine the effect of varying film thickness on the stiffness of the substrate that the cells are able to sense, we define an “effective stiffness” of the film as the ratio of applied traction by a cell to a mean radial strain of a film surface area on which the cell is attached, where the effective stiffness is calculated according to the following equation,
| (1) |
where keff is the effective stiffness of the film, t is the magnitude of the radial traction exerted by the cell on the substrate during active cellular probing. The quantity is the mean displacement of the film, which is determined from the finite element analysis (see Computational Methodology in Supporting Information), and R̄ = (Ro + Ri)/2 is the mean radius of the focal adhesion area. The denominator of keff represents mean radial strain. From equation (1), the effective stiffness depends not only on the material properties of the film and its geometry (i.e. thickness), but also on the amount of focal adhesions recruited.
Calculations: Shear Stress Contours
Since the cell traction imposed by the cell is parallel to the surface plane, the main deformation of the substrate is shear. Therefore, shear stress provides an indication of the effect of cell traction on the substrate. We plot the amount of resulting shear stress within the film and determine whether a portion of the load generated by the cell is borne by the rigid foundation underlying the film. When the shear stress propagates to the bottom of the substrate, the load generated by the cell is shared between the film and the underlying rigid foundation. Thus, the cell senses the rigidity of the underlying foundation. In contrast, for a thick film the shear stress induced by the cell is distributed predominantly within the film, and its effect diminishes prior to reaching the underlying material. To determine the amount of shear stress acting on the film, we use the following relationship from linear elasticity,
| (2) |
where τrz is the shear stress, γrz is the shear strain (determined from the displacement obtained by the finite element analysis), E is the Young’s Modulus of the material, and ν is the Poisson’s ratio of the material.
Calculations: Stored Energy
The cell has to perform work on the substrate in order to exert tension on the focal adhesion area. To calculate the stored strain energy in the substrate (or work done on the substrate), we correlated the focal adhesion area to the amount of work done by the cell during active mechanosensing. In a linear elastic material, the work done on an object is equivalent to the strain energy that results from deformation, which is calculated using the following equation
| (3) |
where W is the stored energy, V is the volume of the film, σr, σθ, σz represent normal stresses in the radial, circumferential, and vertical directions, respectively, εr, εθ, εz represent normal strains in the radial, circumferential, and vertical directions, respectively, τrz represents the shear stress, and γrz is the shear strain. We use the mean cell and focal adhesion radii calculated from the cell immunostaining experiments and compare the resulting stored energy values with those calculated from the simulation based on a fixed cell area and focal adhesion area.
All computational models were created and analyzed with COMSOL Multiphysics 3.3. All meshes used triangular elements, and were refined around the site of maximal deformation (i.e. the boundary of AFA).
Results and Discussion
PDAC/SPS multilayers, composed of two strong polyelectrolytes, PDAC and SPS, follow a linear growth profile (Supporting Information, Figure S1) and behave like a compact solid, exhibiting high ionic cross-linking density when assembled in low salt concentration water23, 26-28. However these films swell at higher salt concentration water, largely due to a decrease in the ionic cross-linking density19, 23-25, 55-57. Mendelsohn et al. showed that PDAC/SPS multilayers exhibit cytophilic behavior at 25 bilayers when assembled in water without salt. In contrast, 10 bilayers of PDAC/SPS were cytophobic when assembled in water containing 0.25M NaCl19. The response of the latter was attributed to the increase in swelling of the 10 bilayers of PDAC/SPS due to the salt (0.25M NaCl) in comparison with the 25 bilayers of PDAC/SPS assembled without salt. High salt concentration changes the conformation of the polyelectrolyte chains of the PDAC/SPS multilayers from a dense, ionically cross-linked structure to a loose, ionically cross-linked structure, and the films are thicker and more cytophobic19. However, in the present study, the salt concentration was kept constant for the multilayer assemblies of varying number of bilayers. The water content of PDAC/SPS films depends on the ionic strength of the depositing solution58, and any swelling of the films is attributed largely to the addition of external salt ions23-25, 55. Since the concentration of the deposition ions was kept constant in this study, the previous explanations of swelling and hydration cannot explain the observed cell adhesion behavior.
Surface topography or roughness can also modulate the adhesion and proliferation of cells on the surface3, 4. In order to assess the changes in the roughness of PDAC/SPS multilayers across the different number of bilayers, we analyzed the surface topography of 30 and 50 bilayers using AFM (Supporting Information, Figures S2a and S2b). The RMS roughness values were 1.924 ± 0.15 nm and 1.617 ± 0.13 nm, respectively. This correspond to the value reported previously for 10 bilayers of PDAC/SPS26. Thus, no significant differences in the roughness values were found for 10 to 50 bilayers. This suggests that the surface roughness is not likely a factor for the varying cell adhesive behavior observed with varying number of bilayers, ranging from 10 to 50.
Yang et al. showed that a single bilayer coating of polyacrylamide(PAAm)/PAA or PAAm/poly(methacrylic acid) (PMAA) was enough to turn the surface cytophobic to mammalian fibroblast cells59. Kidambi et al. showed that 10.5 bilayers of PDAC/SPS (i.e. PDAC as topmost layer, ~ 39 nm) were favorable to fibroblast adhesion, but not primary hepatocytes2. This suggests that even at extremely low thicknesses, the cells can sense the effect of the underlying film, such that the film thickness impacts their adhesion.
Adhesion of Mesenchymal Stem Cells (MSCs) and Fibroblasts on PDAC/SPS Multilayers
Figures 1a and 1b show the phase contrast and focal adhesion/nuclei staining images of bone marrow mesenchymal stem cells (MSCs) and fibroblasts, respectively, on PDAC/SPS multilayers assembled with different number of bilayers. As the thickness of the PDAC/SPS multilayers increased with increasing number of bilayers (while keeping all other parameters constant), fewer cells (both MSCs and fibroblasts) attached onto these multilayers. As illustrated by the phase contrast images, a significant difference was found between the 10 and 20 bilayers for both the MSCs and fibroblasts; and also between control (no multilayer) and 10 bilayers for MSCs. In addition, a significant difference in the cell attachment was found between 20 and 30 bilayers for both cell types. Further, as evident from nuclei staining images, the few fibroblasts that adhered on the 30-50 bilayers tended to clump together. In contrast, a smaller fraction of MSCs remained attached but those that remained exhibited less clumping on the 30-50 bilayers. Despite differences in the cell adhesion behavior of the MSCs and fibroblasts, both cell types showed reduced adherence onto PDAC/SPS multilayers as the number of bilayers increased under fixed deposition conditions. Similar cell adhesive response was observed for primary rat hepatocytes, i.e., fewer primary cells adhered with increasing number of bilayers (data not shown). Next, we performed a finite element study to explain why cells adhered less to films with higher number of bilayers.
Figure 1.
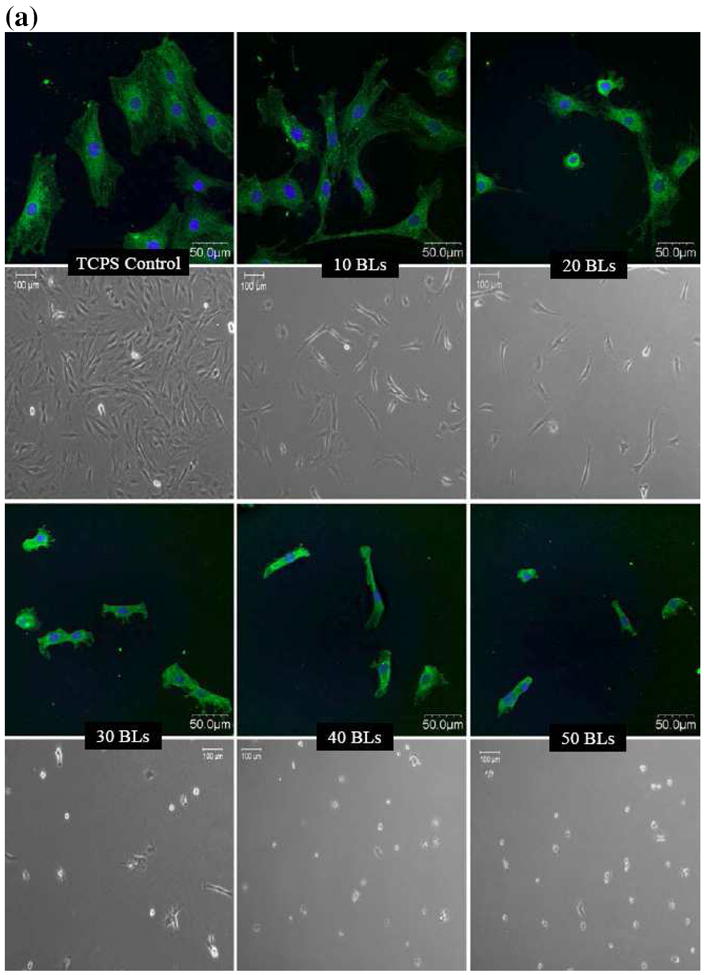
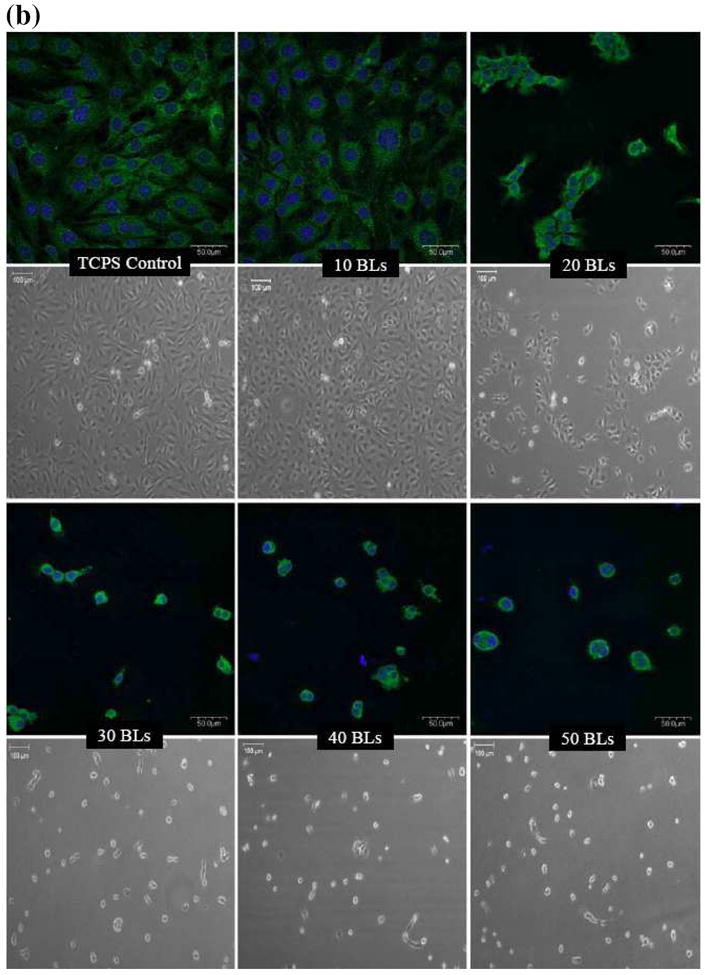
Confocal laser scanning and phase contrast microscopy images of (a) bone marrow mesenchymal stem cells (MCSs) and (b) NIH3T3 fibroblasts, cultured on (PDAC/SPS)n multilayers. n represents the number of PDAC/SPS bilayers (BLs), as indicated on the images. Non-coated TCPS or glass served as control surfaces. Green and blue channels show the focal adhesion sites mapped by rabbit anti-paxicillin primary antibody and Alexa Fluor 488 goat anti-rabbit IgG secondary antibody, and nuclei mapped by DAPI, respectively. CLSM images were acquired at 40X magnification, and phase contrast images were acquired at 10X magnification. Images were immunolabeled 48 hrs post cell seeding. Phase contrast images were obtained just prior to immunostaining.
Variation of Effective Stiffness with Respect to Changes in Film Thickness
To determine the effect of film thickness on the effective film stiffness, we calculate the 1) effective stiffness, keff, based on equation 1, and 2) shear stress (τrz) contour plots using equation 2. As shown in Figure 2a, keff decreases monotonically with increasing film thickness within the experimental (10 – 50 bilayer) thickness range. The theoretical prediction of keff is computed with a fixed cell area in Figure 2b. This graph shows that keff reaches an asymptotic value at around 50 μm, which is consistent with Maloney et al38 (Supporting Information, Figure S3). The change of keff with respect to film thickness implies that the cell is able to sense the underlying rigid substrate within the experimental thickness range. To help support the observed trend in keff for the experimental thickness range for MSCs and fibroblasts, we calculate τrz contours (Figures 3a and 3b) and plotted the shear stress distribution for 10 (~ 40 nm) and 50 bilayer (~ 200 nm) films when subject to constant traction forces. Figures 3a and 3b show the τrz distribution in i) 10 bilayer films, ii) 50 bilayer films, and iii) very thick films. For illustration purposes, let us consider the traction applied by the focal adhesion on the top surface of the film for a MSC, which is 3 kPa. Thus in Fig 3a(i), the region to the right of the contour line -2.75 kPa represents a “high shear stress region”, where the magnitude of the shear stress is larger than 2.75 kPa and captures approximately 90% of the traction applied. Following this contour line from the inner interface of focal adhesion at the “top surface” of the film, one sees that the contour line intersects the “bottom surface” of the film, which indicates that the traction forces applied by the cells are borne by both the film and the underlying rigid substrate (i.e. load sharing occurs between the film and the rigid substrate). Thus, the right side of the intersecting contour line at the bottom surface has shear stress larger than 2.75 kPa. Similarly, Fig 3a(ii) shows that a high shear stress region also exists at the bottom of the film for 50 bilayer film. As the film thickness increases, this high shear stress region gradually become localized near the site of the focal adhesion in the film, and the shear stress reduces at the base of the film, eventually becoming negligible for thick films (e.g.. a 50 μm thick film in Fig 3a(iii)). As shown in Fig 2b, for thick films keff becomes constant. The shear stress plots for MSCs are similar to those for the fibroblasts (Fig 3b).
Figure 2.
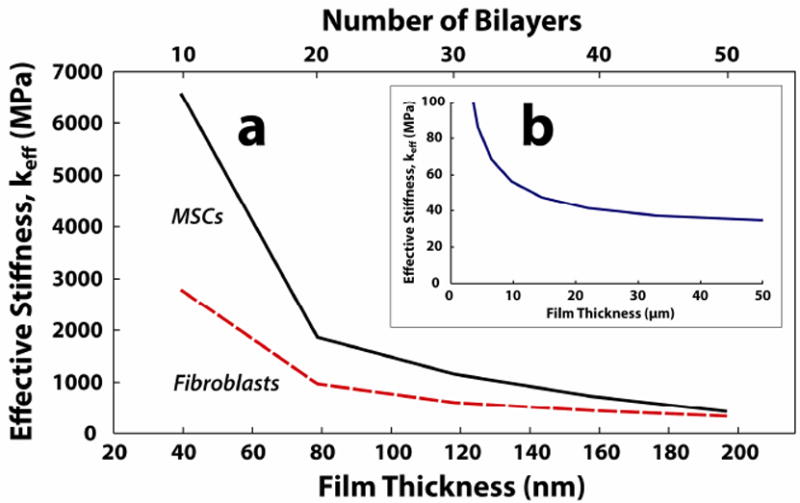
Calculated effective stiffness (keff) with respect to film thickness a) of the best-fit film thickness range for MSCs and fibroblasts, and b) of the asympototic limit (50 μm). The mean displacement varies linearly with increasing film thickness in a), thus giving an inverse relationship between the keff and film thickness.
Figure 3.
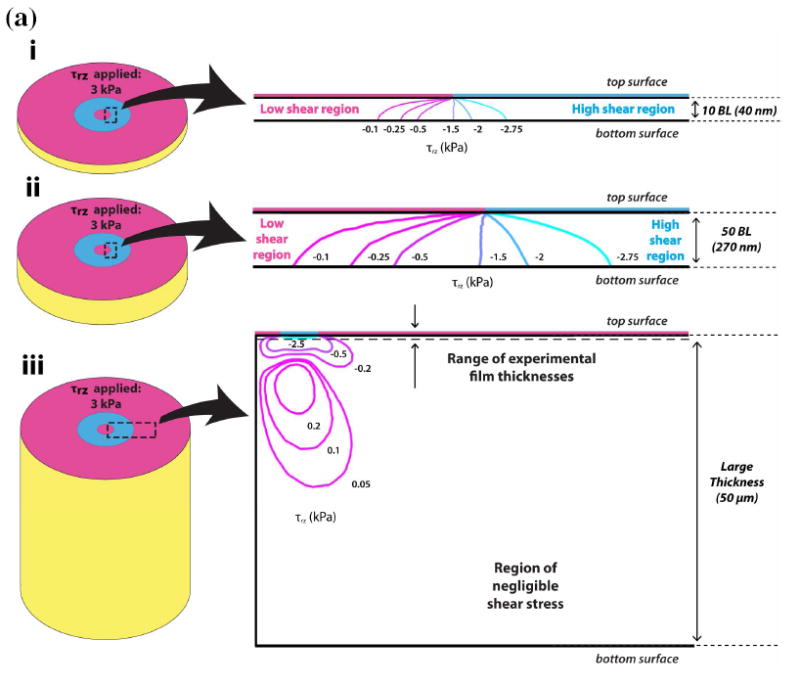
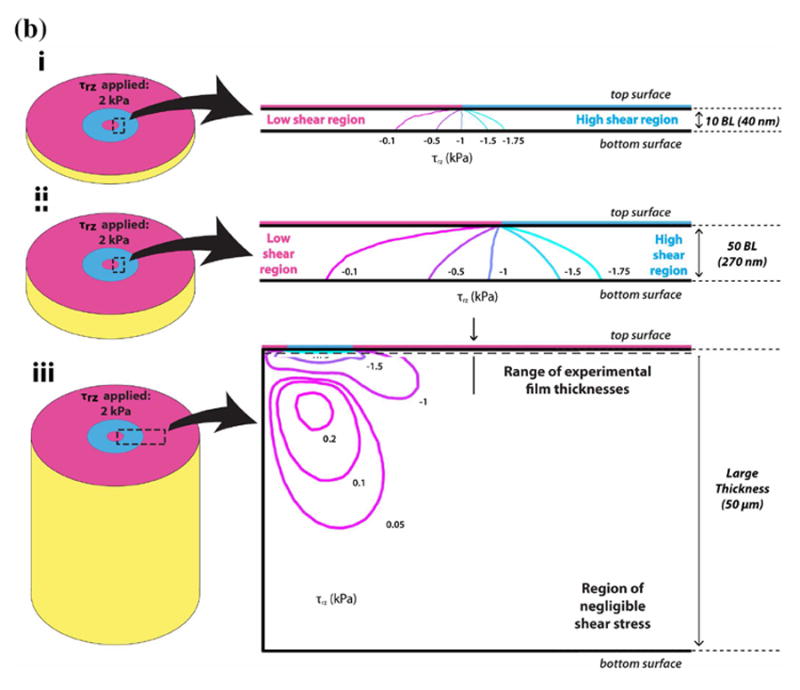
(a, b) Shear stress contour plots for (a) MSCs and (b) fibroblasts at i) 10 BL, ii) 50 BL, and iii) very large film (50 μm) thicknesses. The large arrows indicate the close-up region of the contour plot relative to the model shown in Schematic 2b. In i), τrz is − 3 kPa and − 2 kPa at the top (focal adhesion) surfaces of the film for MSCs and fibroblasts, respectively. In both i) and ii) for MSCs and fibroblasts, the traction load penetrates the entire film, and is also borne by the underlying rigid substrate. However, in iii), the tractions from both MSCs and fibroblasts produce negligible amounts of shear stress τrz at the bottom surface of the film. In these cases, the traction load is borne solely by the film, thus the effective stiffness keff is constant for further increases in thickness.
Results similar to both Figures 2 and 3 have been obtained by previous investigators38, 45. Maloney et al., showed, using analytical methods, that the attenuation in cellular displacement converged to a constant value as the thickness of the film exceeded the cell area38. Furthermore, Merkel et al. reported that the “finite thickness effects” of substrate films are present in film thicknesses below 60 μm, which is consistent with Figs 3a(iii) and 3b(iii) in our study that showed at 50 μm thick films the cells are no longer able to sense the underlying substrate45.
The influence of film thickness on cellular movement and differentiation has been confirmed with both experimental and computational studies2, 5, 37, 45, 50, 54. Sen et al.37 showed that at sufficiently low film thicknesses (i.e., on the nanometer scale), the spreading response of the cells becomes “equivalent to that on a much stiffer gel.” Yang et al.59 showed that extremely thin films (i.e. on the order of a nm) the cells are able to discern the effect of an underlying surface beneath the film. Thus, the mechanosensitive length-scale of the cell is governed not only by the Young’s Modulus of the film, but also the geometrical properties (i.e., thickness) of the film45. Consistent with these studies, the results from Figures 2 and 3, and Table 1 collectively demonstrate that load sharing between a sufficiently thin film and a stiffer underlying substrate helps to promote cell spreading.
Stored Strain Energy Level to Maintain a Constant Tensional Field in the Cell
As previously stated, a network of cell signaling molecules promotes rapid signal transduction and induces morphological changes in order to maintain a constant, homeostatic tension level60, 61. Using equation (3), we estimate the energy used by both MSCs and fibroblasts to generate constant traction field over the focal adhesion area, assuming the total work done by a cell is equal to the total strain energy (W) stored in the film. In addition to calculating W from the experimental data, we compared the experimental data with the model prediction when the cell and focal adhesion area are fixed, to observe the difference in the W required to maintain the cell morphology. The results of this calculation are shown in Figures 4a and 4b.
Figure 4.
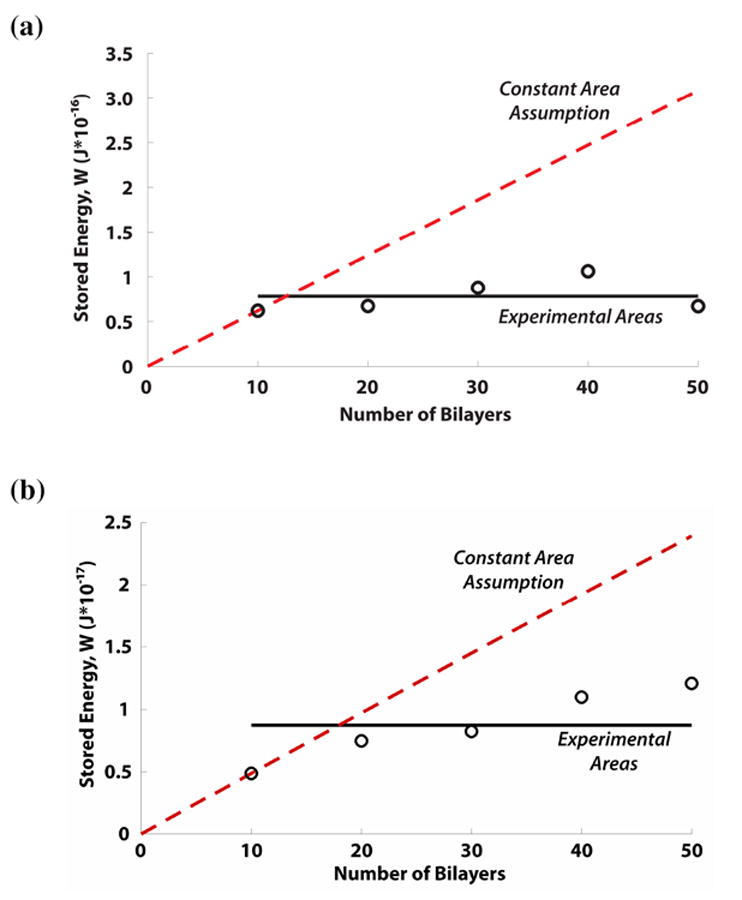
(a) Stored energy comparison for MSCs within the experimental range of film thicknesses. Assuming no change in cell shape and morphology (red, dotted line), the stored energy increased linearly with respect to film thickness. Using the measured cell size and morphology, the stored energy remained at a nearly constant level (black, solid line with ‘o’ markers). (b). Stored energy comparison for fibroblasts within the experimental range of film thicknesses. Assuming no change in the cell shape and morphology (red, dotted line), the stored energy increased linearly with respect to film thickness. Conversely, the stored energy calculated from experimental data (black, solid line with ‘o’ markers) converges to a near constant value. The slight positive slope for the 30 – 50 bilayers for fibroblasts may be due to non-adherent clumping that resulted in a larger cell area over which the traction was exerted.
Figures 4a and 4b show that when using the geometric parameters obtained from the actual experiment (i.e. when the cell adhesion area changes with respect to film thickness), W remains relatively constant. This trend holds for MSCs, but is not as readily apparent for fibroblasts, where W appears to increase slightly with the film thickness. However, these results with the fibroblast may be due to the considerable non-adherent clumping (as mentioned above) exhibited by the fibroblasts in the 30-50 bilayers range, which may promote additional intercellular mechanical coupling37, 62, and thereby imposing a limitation in the current computational model. The clumping between fibroblasts may have resulted in a larger measured area than the actual area of a single cell alone. Thus, in Figure 4b, clumping contributes to higher calculated stored energy values in the 30-50 bilayer range, resulting in a slightly positive slope. Nevertheless, the results from Figures 4a and 4b suggest that the cell adjusts its morphology in response to changes in the film thickness in order to maintain a constant level of energy usage, thereby maintaining a constant traction field over the focal adhesion area. This observation is readily apparent when comparing the W calculated using the constant focal adhesion area assumption (i.e. unchanged cell morphology) over the experimental range of film thicknesses (see red dash lines in Figures 4a and 4b), where W (and thus energy requirement) increases proportionally with film thickness.
Sen et al. previously calculated cellular spreading energetics in terms of the strain energy stored within the cell, whereby energetically favorable shapes were achieved using an efficiency factor that accounted for the “metabolic-to-mechanical energy conversion rates”37. In contrast, we calculate the strain energy stored by the film undergoing deformation due to traction forces generated by focal adhesion complexes, thus this quantity measures the amount of work done by the cell on the film. The advantage of using the stored strain energy in the film to quantify cellular spreading energetics is that this calculation is independent of the structural remodeling of the cytoskeleton within the cell (i.e. the cytoskeleton incurs remodeling in order to reduce the stress in its actin fibers39-41). Therefore, the study presented here may provide a more suitable measure of the energy consumed by the cell during probing. To further confirm this idea of the cells maintaining a constant energy, which in turn modulates the cell shape and morphology, we cultured cells in serum-free media (Supporting Information, Figure S4), which have less overall energy available to them63-65. The computational results using the measured focal adhesion area, which varied for the different number of (PDAC/SPS) bilayers, showed that the stored energy for the serum-deprived MSCs were maintained at a constant level (Supporting Information, Figure S5), similar to what was observed with the serum-treated cells (Figure 4). Thus, we showed that cells tend to maintain their energy level under a given cell culture condition by adjusting their focal adhesion area, either in serum-treated or in serum-deprived culture condition.
Conclusions
The film thickness is an important parameter to consider in surface modification of LbL multilayers. Excessive increases in film thickness may result in a suboptimal response of biomedical devices. We show that linearly growing ultrathin PEM films of strong polyelectrolytes, PDAS and SPS, exhibit a gradual shift from cytophilic to cytophobic behavior, with increasing film thickness. Previous explanations of film hydration, swelling or change in elastic modulus could not explain the observed behavior with this pair of PEMs. We employed a finite element model to computationally investigate this behavior and found that when cells sense changes in the effective stiffness of thin LbL films they adjust their morphology to maintain a homeostatic energy level, which we correlate with the amount of work done on the film. Prior models have correlated either the Young’s modulus or an “effective modulus” of the material to the mechanosensitive behavior of the cells. This captures only the material properties of the substrate, which by itself, may not account for the cell’s response to the traction generated by the cell and the change in the cell morphology upon sensing its environment. In our model, we capture the cells response by incorporating the mean cell and focal adhesion radii calculated from the cell immunostaining to prescribe the cell adhesion area for each film thickness.
Thus, in our model, the mechanosensitive length-scale of the cell is governed not only by the Young’s Modulus of the film, but also the film thickness, which affects the stiffness that the cells sense and captured by the focal adhesion area, as shown also by others 37, 38, 45, 50. Finally, while most of these previous studies suggest either stress or stiffness of the substrate as a mechanical stimulus that govern cellular adhesion, the results from this study suggest that the energy consumed by the cells during active probing with a constant adhesion force, regulates the cell morphology and adhesion behavior. Furthermore, the computational method presented provides a unique way to estimate work done by a cell on a substrate of varying thickness and elastic modulus and may be used eventually in designing engineered tissue to guide specific cellular behavior.
Supplementary Material
Acknowledgments
The work was supported in part by the National Institute of Health (R01GM079688, R21RR024439 and P42 ES004911), the National Science Foundation (CBET 0941055 and CBET 0832730), the MUCI and the MSU Foundation and the Center for Systems Biology.
Footnotes
Supporting Information Available Thickness measurements and AFM topography of PDAC/SPS multilayers, comparison of MSCs cultured on PDAC/SPS multilayers in presence and absence of serum, effective stiffness and computation methodology. This information is available free of charge via the Internet at http://pubs.acs.org/.
References
- 1.Sagvolden G, Giaever I, Pettersen EO, Feder J. Proceedings of the National Academy of Sciences of the United States of America. 1999;96:471–476. doi: 10.1073/pnas.96.2.471. [DOI] [PMC free article] [PubMed] [Google Scholar]
- 2.Kidambi S, Lee I, Chan C. Journal of the American Chemical Society. 2004;126:16286–16287. doi: 10.1021/ja046188u. [DOI] [PubMed] [Google Scholar]
- 3.Kidambi S, Udpa N, Schroeder SA, Findlan R, Lee I, Chan C. Tissue Engineering. 2007;13:2105–2117. doi: 10.1089/ten.2006.0151. [DOI] [PMC free article] [PubMed] [Google Scholar]
- 4.Mehrotra S, Lynam D, Maloney R, Pawelec KM, Tuszynski MH, Lee I, Chan C, Sakamoto J. Advanced Functional Materials. 2010;20:247–258. doi: 10.1002/adfm.200901172. [DOI] [PMC free article] [PubMed] [Google Scholar]
- 5.Engler A, Bacakova L, Newman C, Hategan A, Griffin M, Discher D. Biophysical Journal. 2004;86:617–628. doi: 10.1016/S0006-3495(04)74140-5. [DOI] [PMC free article] [PubMed] [Google Scholar]
- 6.Engler AJ, Richert L, Wong JY, Picart C, Discher DE. Surface Science. 2004;570:142–154. [Google Scholar]
- 7.Pelham RJ, Wang YL. Proceedings of the National Academy of Sciences of the United States of America. 1997;94:13661–13665. doi: 10.1073/pnas.94.25.13661. [DOI] [PMC free article] [PubMed] [Google Scholar]
- 8.Decher G. Science. 1997;277:1232–1237. [Google Scholar]
- 9.Tang ZY, Wang Y, Podsiadlo P, Kotov NA. Advanced Materials. 2006;18:3203–3224. [Google Scholar]
- 10.Stokols S, Sakamoto J, Breckon C, Holt T, Weiss J, Tuszynski MH. Tissue Engineering. 2006;12:2777–2787. doi: 10.1089/ten.2006.12.2777. [DOI] [PubMed] [Google Scholar]
- 11.Rajagopalan P, Shen CJ, Berthiaume F, Tilles AW, Toner M, Yarmush ML. Tissue Engineering. 2006;12:1553–1563. doi: 10.1089/ten.2006.12.1553. [DOI] [PubMed] [Google Scholar]
- 12.Mehrotra S, Lee I, Chan C. Acta Biomaterialia. 2009;5:1474–1488. doi: 10.1016/j.actbio.2009.01.004. [DOI] [PMC free article] [PubMed] [Google Scholar]
- 13.Germain M, Balaguer P, Nicolas JC, Lopez F, Esteve JP, Sukhorukov GB, Winterhalter M, Richard-Foy H, Fournier D. Biosensors & Bioelectronics. 2006;21:1566–1573. doi: 10.1016/j.bios.2005.07.011. [DOI] [PubMed] [Google Scholar]
- 14.Swiston AJ, Cheng C, Um SH, Irvine DJ, Cohen RE, Rubner MF. Nano Letters. 2008;8:4446–4453. doi: 10.1021/nl802404h. [DOI] [PubMed] [Google Scholar]
- 15.Elbert DL, Herbert CB, Hubbell JA. Langmuir. 1999;15:5355–5362. [Google Scholar]
- 16.Richert L, Engler AJ, Discher DE, Picart C. Biomacromolecules. 2004;5:1908–1916. doi: 10.1021/bm0498023. [DOI] [PubMed] [Google Scholar]
- 17.Hubsch E, Ball V, Senger B, Decher G, Voegel JC, Schaaf P. Langmuir. 2004;20:1980–1985. [Google Scholar]
- 18.Porcel C, Lavalle P, Decher G, Senger B, Voegel JC, Schaaf P. Langmuir. 2007;23:1898–1904. doi: 10.1021/la062728k. [DOI] [PubMed] [Google Scholar]
- 19.Mendelsohn JD, Yang SY, Hiller J, Hochbaum AI, Rubner MF. Biomacromolecules. 2003;4:96–106. doi: 10.1021/bm0256101. [DOI] [PubMed] [Google Scholar]
- 20.Shiratori SS, Rubner MF. Macromolecules. 2000;33:4213–4219. [Google Scholar]
- 21.Thompson MT, Berg MC, Tobias IS, Rubner MF, Van Vliet KJ. Biomaterials. 2005;26:6836–6845. doi: 10.1016/j.biomaterials.2005.05.003. [DOI] [PubMed] [Google Scholar]
- 22.Yoo D, Shiratori SS, Rubner MF. Macromolecules. 1998;31:4309–4318. [Google Scholar]
- 23.Schlenoff JB, Dubas ST. Macromolecules. 2001;34:592–598. [Google Scholar]
- 24.Dubas ST, Schlenoff JB. Langmuir. 2001;17:7725–7727. [Google Scholar]
- 25.Dubas ST, Schlenoff JB. Macromolecules. 1999;32:8153–8160. [Google Scholar]
- 26.McAloney RA, Sinyor M, Dudnik V, Goh MC. Langmuir. 2001;17:6655–6663. [Google Scholar]
- 27.Clark SL, Montague MF, Hammond PT. Macromolecules. 1997;30:7237–7244. [Google Scholar]
- 28.Krogman KC, Zacharia NS, Schroeder S, Hammond PT. Langmuir. 2007;23:3137–3141. doi: 10.1021/la063085b. [DOI] [PubMed] [Google Scholar]
- 29.Schlenoff JB, Ly H, Li M. Journal of the American Chemical Society. 1998;120:7626–7634. [Google Scholar]
- 30.Jaber JA, Schlenoff JB. Journal of the American Chemical Society. 2006;128:2940–2947. doi: 10.1021/ja055892n. [DOI] [PubMed] [Google Scholar]
- 31.Hillberg AL, Holmes CA, Tabrizian M. Biomaterials. 2009;30:4463–4470. doi: 10.1016/j.biomaterials.2009.05.026. [DOI] [PubMed] [Google Scholar]
- 32.Wu ZR, Ma J, Liu BF, Xu QY, Cui FZ. Journal of Biomedical Materials Research Part A. 2007;81A:355–362. doi: 10.1002/jbm.a.30993. [DOI] [PubMed] [Google Scholar]
- 33.Huang S, Ingber DE. Nature Cell Biology. 1999;1:E131–E138. doi: 10.1038/13043. [DOI] [PubMed] [Google Scholar]
- 34.Ingber DE. Annual Review of Physiology. 1997;59:575–599. doi: 10.1146/annurev.physiol.59.1.575. [DOI] [PubMed] [Google Scholar]
- 35.Jaalouk DE, Lammerding J. Nature Reviews Molecular Cell Biology. 2009;10:63–73. doi: 10.1038/nrm2597. [DOI] [PMC free article] [PubMed] [Google Scholar]
- 36.Na S, Collin O, Chowdhury F, Tay B, Ouyang MX, Wang YX, Wang N. Proceedings of the National Academy of Sciences of the United States of America. 2008;105:6626–6631. doi: 10.1073/pnas.0711704105. [DOI] [PMC free article] [PubMed] [Google Scholar]
- 37.Sen S, Engler AJ, Discher DE. Cellular and Molecular Bioengineering. 2009;2:39–48. doi: 10.1007/s12195-009-0052-z. [DOI] [PMC free article] [PubMed] [Google Scholar]
- 38.Maloney JM, Walton EB, Bruce CM, Vliet KJ. Physical Review E. 2008;78 doi: 10.1103/PhysRevE.78.041923. [DOI] [PubMed] [Google Scholar]
- 39.Na S, Trache A, Trzeciakowski J, Sun Z, Meininger GA, Humphrey JD. Annals of Biomedical Engineering. 2008;36:369–380. doi: 10.1007/s10439-008-9438-7. [DOI] [PubMed] [Google Scholar]
- 40.Costa KD, Hucker WJ, Yin FCP. Cell Motility and the Cytoskeleton. 2002;52:266–274. doi: 10.1002/cm.10056. [DOI] [PubMed] [Google Scholar]
- 41.Wang JHC, Goldschmidt-Clermont P, Moldovan N, Yin FCP. Cell Motility and the Cytoskeleton. 2000;46:137–145. doi: 10.1002/1097-0169(200006)46:2<137::AID-CM6>3.0.CO;2-8. [DOI] [PubMed] [Google Scholar]
- 42.de Hemptinne I, Vermeiren C, Maloteaux JM, Hermans E. Journal of Neurochemistry. 2004;91:155–166. doi: 10.1111/j.1471-4159.2004.02709.x. [DOI] [PubMed] [Google Scholar]
- 43.Munevar S, Wang YL, Dembo M. Molecular Biology of the Cell. 2001;12:3947–3954. doi: 10.1091/mbc.12.12.3947. [DOI] [PMC free article] [PubMed] [Google Scholar]
- 44.Goffin JM, Pittet P, Csucs G, Lussi JW, Meister JJ, Hinz B. Journal of Cell Biology. 2006;172:259–268. doi: 10.1083/jcb.200506179. [DOI] [PMC free article] [PubMed] [Google Scholar]
- 45.Merkel R, Kirchgebner N, Cesa CM, Hoffmann B. Biophysical Journal. 2007;93:3314–3323. doi: 10.1529/biophysj.107.111328. [DOI] [PMC free article] [PubMed] [Google Scholar]
- 46.Oommen B, Van Vliet KJ. Thin Solid Films. 2006;513:235–242. [Google Scholar]
- 47.Mueller R, Kohler K, Weinkamer R, Sukhorukov G, Fery A. Macromolecules. 2005;38:9766–9771. [Google Scholar]
- 48.Salomaki M, Laiho T, Kankare J. Macromolecules. 2004;37:9585–9590. [Google Scholar]
- 49.Gao CY, Leporatti S, Moya S, Donath E, Mohwald H. Langmuir. 2001;17:3491–3495. [Google Scholar]
- 50.Engler AJ, Sen S, Sweeney HL, Discher DE. Cell. 2006;126:677–689. doi: 10.1016/j.cell.2006.06.044. [DOI] [PubMed] [Google Scholar]
- 51.Munevar S, Wang YL, Dembo M. Biophysical Journal. 2001;80:1744–1757. doi: 10.1016/s0006-3495(01)76145-0. [DOI] [PMC free article] [PubMed] [Google Scholar]
- 52.Charras GT, Horton MA. Biophysical Journal. 2002;83:858–879. doi: 10.1016/S0006-3495(02)75214-4. [DOI] [PMC free article] [PubMed] [Google Scholar]
- 53.Dembo M, Wang YL. Biophysical Journal. 1999;76:2307–2316. doi: 10.1016/S0006-3495(99)77386-8. [DOI] [PMC free article] [PubMed] [Google Scholar]
- 54.Bischofs IB, Schwarz US. Proceedings of the National Academy of Sciences of the United States of America. 2003;100:9274–9279. doi: 10.1073/pnas.1233544100. [DOI] [PMC free article] [PubMed] [Google Scholar]
- 55.Jaber JA, Schlenoff JB. Chemistry of Materials. 2006;18:5768–5773. [Google Scholar]
- 56.Miller MD, Bruening ML. Chemistry of Materials. 2005;17:5375–5381. [Google Scholar]
- 57.Gao CY, Leporatti S, Moya S, Donath E, Mohwald H. Chemistry-a European Journal. 2003;9:915–920. doi: 10.1002/chem.200390113. [DOI] [PubMed] [Google Scholar]
- 58.Jaber JA, Schlenoff JB. Langmuir. 2007;23:896–901. doi: 10.1021/la061839g. [DOI] [PubMed] [Google Scholar]
- 59.Yang SY, Mendelsohn JD, Rubner MF. Biomacromolecules. 2003;4:987–994. doi: 10.1021/bm034035d. [DOI] [PubMed] [Google Scholar]
- 60.Wang N, Tytell JD, Ingber DE. Nature Reviews Molecular Cell Biology. 2009;10:75–82. doi: 10.1038/nrm2594. [DOI] [PubMed] [Google Scholar]
- 61.Mizutani T, Haga H, Kawabata K. Cell Motility and the Cytoskeleton. 2004;59:242–248. doi: 10.1002/cm.20037. [DOI] [PubMed] [Google Scholar]
- 62.Follonier L, Schaub S, Meister JJ, Hinz B. Journal of Cell Science. 2008;121:3305–3316. doi: 10.1242/jcs.024521. [DOI] [PubMed] [Google Scholar]
- 63.Gallant ND, Michael KE, Garcia AJ. Molecular Biology of the Cell. 2005;16:4329–4340. doi: 10.1091/mbc.E05-02-0170. [DOI] [PMC free article] [PubMed] [Google Scholar]
- 64.Ren XD, Kiosses WB, Schwartz MA. Embo Journal. 1999;18:578–585. doi: 10.1093/emboj/18.3.578. [DOI] [PMC free article] [PubMed] [Google Scholar]
- 65.Tan JL, Tien J, Pirone DM, Gray DS, Bhadriraju K, Chen CS. Proceedings of the National Academy of Sciences of the United States of America. 2003;100:1484–1489. doi: 10.1073/pnas.0235407100. [DOI] [PMC free article] [PubMed] [Google Scholar]
Associated Data
This section collects any data citations, data availability statements, or supplementary materials included in this article.