Abstract
Background
Although tympanic membrane perforations are common, there have been few systematic studies of the structural features determining the magnitude of the resulting conductive hearing loss. Our recent experimental and modeling studies predicted that the conductive hearing loss will increase with increasing perforation size, be independent of perforation location (contrary to popular otologic belief), and increase with decreasing size of the middle-ear and mastoid air space (an idea new to otology).
Objective
To test our predictions regarding determinants of conductive hearing loss in tympanic membrane perforations against clinical data gathered from patients.
Study Design
Prospective clinical study.
Setting
Tertiary referral center.
Inclusion Criteria
Patients with tympanic membrane perforations without other middle-ear disease.
Main Outcome Measures
Size and location of perforation; air-bone gap at 250, 500, 1,000, 2,000, and 4,000 Hz; and tympanometric estimate of volume of the middle-ear air spaces.
Results
Isolated tympanic membrane perforations in 62 ears from 56 patients met inclusion criteria. Air-bone gaps were largest at the lower frequencies and decreased as frequency increased. Air-bone gaps increased with perforation size at each frequency. Ears with small middle-ear volumes, ≤4.3 ml (n = 23), had significantly larger air-bone gaps than ears with large middle-ear volumes, >4.3 ml (n = 39), except at 2,000 Hz. The mean air-bone gaps in ears with small volumes were 10 to 20 dB larger than in ears with large volumes. Perforations in anterior versus posterior quadrants showed no significant differences in air-bone gaps at any frequency, although anterior perforations had, on average, air-bone gaps that were smaller by 1 to 8 dB at lower frequencies.
Conclusion
The conductive hearing loss resulting from a tympanic membrane perforation is frequency-dependent, with the largest losses occurring at the lowest sound frequencies; increases as size of the perforation increases; varies inversely with volume of the middle-ear and mastoid air space (losses are larger in ears with small volumes); and does not vary appreciably with location of the perforation. Effects of location, if any, are small.
Keywords: Audiometry, Conductive hearing loss, Perforation, Tympanic membrane, Tympanometry
The tympanic membrane (TM) serves as a key component of the tympano-ossicular system for sound transmission. Perforation of the TM is common in an otologic practice and can result from various causes such as trauma and chronic otitis media. Perforations of the TM can result in a conductive hearing loss (CHL) that ranges from negligible to 50 dB. Until recently, the effects of TM perforations on middle-ear sound transmission were not well characterized. For example, Terkildsen (1) stated that “There is no general agreement among clinicians about the magnitude and the configuration of the hearing loss that is caused by various types of tympanic-membrane perforations.” Glasscock and Shambaugh (2) observed that “Seemingly identical perforations in size and location produce different degrees of hearing loss. The reasons for the variations in the hearing effects of simple perforations are not easily defined.”
Recent work in our laboratory investigated the mechanisms by which a TM perforation causes hearing loss in a systematic and quantitative manner by using an experimental and a theoretical approach (3–5). In the experimental approach, measurements of middle-ear sound transmission were made in cadaveric temporal bones before and after controlled TM perforations of various sizes and locations. In the theoretical approach, a quantitative, physics-based model of the human middle-ear was used to understand the mechanisms of hearing loss resulting from a TM perforation. Our experimental data and model analysis indicated that the dominant mechanism causing hearing loss in ears with TM perforations is a reduction in the sound pressure difference across the TM (not phase cancellation at the round window) (6). We made the following predictions, based on our work:
In any given perforation, hearing loss will be largest at the lowest frequencies and will decrease as the frequency increases.
Hearing loss will increase with increasing size of a TM perforation.
Hearing loss will not depend on location of the TM perforation. Note that this result contradicts a widely held clinical view that perforations over the region of the round window (i.e., posteroinferior quadrant) result in significantly greater hearing losses than anterior perforations.
Hearing loss will vary inversely with the volume of air within the middle-ear and mastoid (3–5). The notion of volume of the middle-ear and mastoid air space influencing the CHL resulting from a TM perforation is a concept new to otology and may help to explain some of the clinical observations of variability in effects of TM perforations. Indeed, our model predicts that, all other things being equal (such as size and location of perforation), the hearing loss resulting from a perforation can vary by up to 35 dB, depending on the volume of air in the middle ear and mastoid.
The goal of the present study was to test our previous experimental findings and model predictions by a prospective clinical study of TM perforations. We studied ears where a TM perforation was the sole cause of a CHL. In each ear, we determined the size and location of the perforation and the volume of air in the middle-ear and mastoid. The volume measurements were estimated using tympanometry. We also compared the measured air-bone gap (ABG) in each ear to the predicted ABG (based on our model).
PATIENTS AND METHODS
Recruitment of Subjects
Fifty-six subjects with isolated TM perforations were recruited, ranging in age from 6 to 74 years, with a mean age of 25.6 years. Six patients had bilateral perforations, for a total of 62 ears. Of the 62 perforated ears, 32 were from male subjects and 30 were from female subjects. The enrolled subjects were required to have no history of middle-ear disease or surgery, as defined by an oral history and an otologic examination. In addition, to ensure that only patients with isolated TM perforations without additional middle-ear disease were studied, the following inclusion criteria were used: 1) ears that underwent Type I tympanoplasty or myringoplasty, which were found to have a normal middle-ear intraoperatively and which showed postoperative closure of the ABG (n = 19); 2) ears with traumatic TM perforations that healed spontaneously with resulting closure of the ABG (n = 6); and 3) ears with small ABGs (≤20 dB at any frequency) in the setting of a TM perforation (e.g., perforations resulting from previous tympanostomy tubes), suggesting lack of additional ossicular disease (n = 37).
Protocol for Data Collection
The research protocol was approved by the Institutional Review Board at the Massachusetts Eye and Ear Infirmary. Each ear was examined by otomicroscopy, and a 1-mm hook or similar otologic instrument was used to estimate the diameter of the perforation. A drawing of the TM perforation indicating size and location was performed for each ear by the first author (R. P. M.). When possible, photodocumentation was also performed by recording a digital image of the perforation next to a scale. The location of each perforation was determined to be anterior or posterior with respect to an imaginary line drawn across the TM at the level of the manubrium.
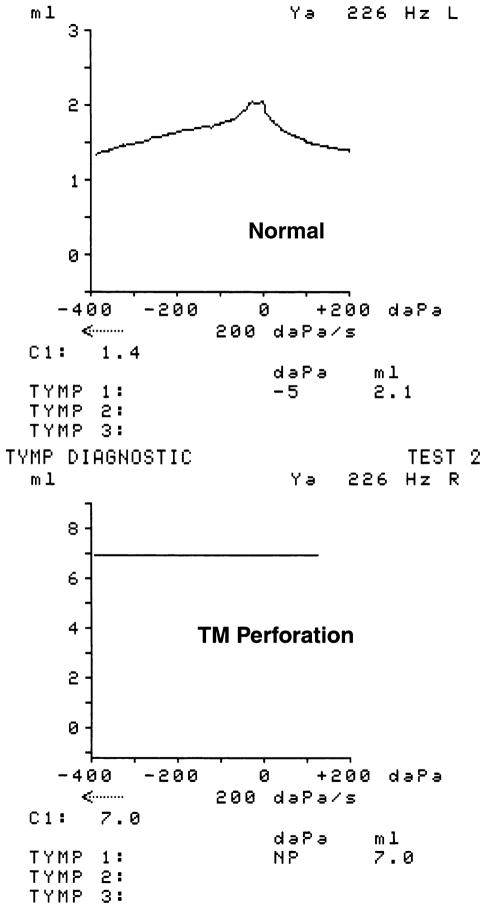
Each subject underwent standard audiometric testing including pure-tone threshold testing and tympanometry. Pure-tone thresholds were determined using supra-aural earphones. Insert earphones were not used because our previous work has shown that TM perforations can affect the ear canal sound pressure generated by insert earphones such that the measured hearing loss is substantially larger than the actual loss (7). Tympanometry is an established method of measuring the volume contained within a closed air space (8–11). The tympanogram read-out in an ear with a TM perforation is an estimate of the combined volume within the ear canal, middle-ear, and mastoid. We used estimates of the ear-canal volume measured at −400 mm daPa static pressure in the contralateral ear to provide an estimate of the volume of the air space medial to the TM in the ear with the perforation. For example (Fig. 1), in one of our subjects, the tympanogram read-out in the ear with a perforation was a flat tracing at an admittance equivalent to a 7-ml air space. The patient’s contralateral ear showed a normal Type A tympanogram, with an ear-canal volume of 1.4 ml estimated from the admittance measured with a negative ear canal pressure, −400 daPa. Therefore, our estimate of the middle-ear air space volume on the side with the TM perforation was 7–1.4 = 5.6 ml. For ears with bilateral perforations, we used the mean of the ear-canal volume measured in the ears with unilateral perforations (1.13 ml). Note that for the purposes of this article, the term “middle-ear volume” refers to the volume of air contained within the tympanic cavity (including the epitympanum, hypotympanum, and protympanum) and the mastoid collectively. One source of error in our estimates of volume is that commercial tympanometers are insensitive to volumes greater than 7 ml and report a volume of 7 ml for any volume of that magnitude or larger. This issue has implications for some of our analyses, and is discussed in more detail later.
FIG. 1.
Tympanograms illustrating the estimation of middle-ear volume in an ear with a TM perforation. (Above) Tympanometric tracing from the normal (contralateral) ear. The ear-canal volume is 1.4 ml, measured at −400 daPa of ear canal pressure. (Below) A flat tracing in the ear with the perforation, with a total volume of 7 ml. Therefore, middle-ear volume in the ear with the perforation is estimated to be total volume in ear with perforation (7 ml) –ear-canal volume in contralateral normal ear (1.4 ml) = 5.6 ml.
Analysis of Audiometric Data
The primary data that we analyzed were the ABGs measured at each frequency in each ear. This separation by frequency is important to determine whether or not there is a frequency dependence to the perforation-related CHL. The analysis by frequency also raises the question of whether the thresholds at different frequencies are independent estimates of the degree of disease or are dependent on some more basic variable such as stiffness. For example, a change in the stiffness of the ear would cause correlated changes in hearing function at all frequencies less than 1 to 2 kHz, with larger effects at lower frequencies. This lack of independence of the alterations at different frequencies argues against grouping the results at different frequencies when testing for the effect of variables other than frequency.
RESULTS
Figure 2 displays the 62 perforations in terms of the middle-ear volume, perforation area, and perforation location. Of the 62 ears, 17 perforations were anterior, 19 were posterior, and 26 affected both halves of the TM. The area of the perforations ranged from 0.1 to almost 60 mm2. There was no significant difference in the area or the middle-ear volume of the anterior versus the posterior perforation groups. In the whole population, there was a preponderance of volume estimates between 5 and 6.5 ml; over 40% of the perforations were associated with volumes in this small range. This clustering was attributable to a technical limitation in that the tympanometer used in the study was insensitive to combined ear canal and middle-ear volumes greater than 7 ml.
FIG. 2.
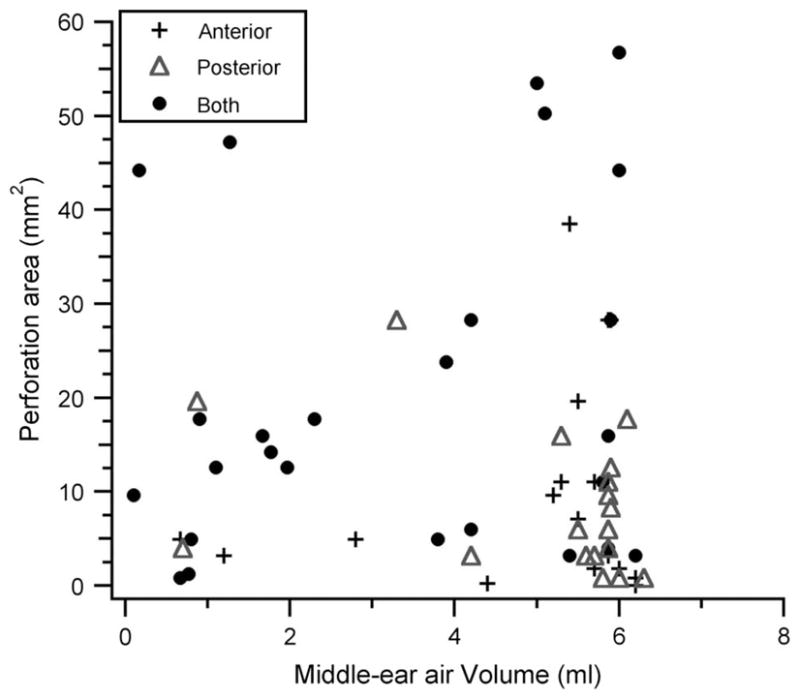
Scatterplot showing middle-ear volumes and areas of each perforation in the study population of 62 ears. Each ear is also grouped by location of the perforation: anterior, posterior, or both.
Effect of Middle-Ear Volume and Frequency
Ears were divided into two subgroups around the mean middle-ear volume of 4.3 ml: small middle-ear volume, less than or equal to 4.3 ml (n = 23), and large middle-ear volume, greater than 4.3 ml (n = 39). The mean ABGs (with standard errors) for both groups at each audiometric frequency are depicted in Figure 3. The mean ABGs in the small-volume group were larger by 10 to 20 dB compared with the large-volume group. These differences were statistically significant (p < 0.05, Student’s t test) at 250, 500, 1,000, and 4,000 Hz. Hearing losses in each group were largest at the lowest frequencies and generally decreased as frequency increased.
FIG. 3.
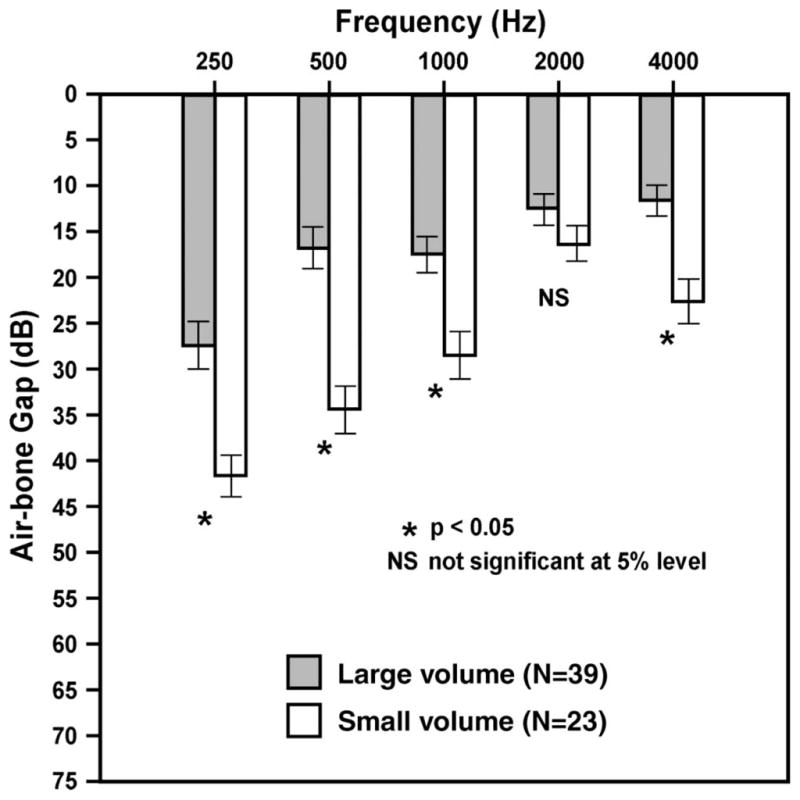
Mean ABGs for the large-volume group (n = 39) and the small-volume group (n = 23) at each audiometric frequency. Error bars indicate ±1 standard error of the mean. Ears with small volumes had significantly larger ABGs at all frequencies except 2,000 Hz.
Effect of Area of Perforation
Ears were divided into three subgroups on the basis of the area of the perforation: small perforations: 0 to 8 mm2, n = 30 (20 ears in the large-volume group and 10 ears in the small-volume group); medium-sized perforations, 9 to 30 mm2, n = 25 (14 ears in the large-volume group and 11 ears in the small-volume group); and large perforations, >30 mm2, n = 7 (5 ears in the large volume group and 2 ears in the small volume group). Figure 4 depicts the mean ABGs for each size category and audiometric frequency for the large-volume group. The differences in ABGs between small and large perforations were significant at all frequencies (p < 0.05, Student’s t test). The differences between small and medium perforations and between medium and large perforations were significant (p < 0.05) at 1,000, 2,000, and 4,000 Hz. At each sound frequency, ABGs were larger with increasing perforation size. As noted previously, ABGs were largest at the lower frequencies. A similar pattern was seen in the small-volume group (data not shown).
FIG. 4.
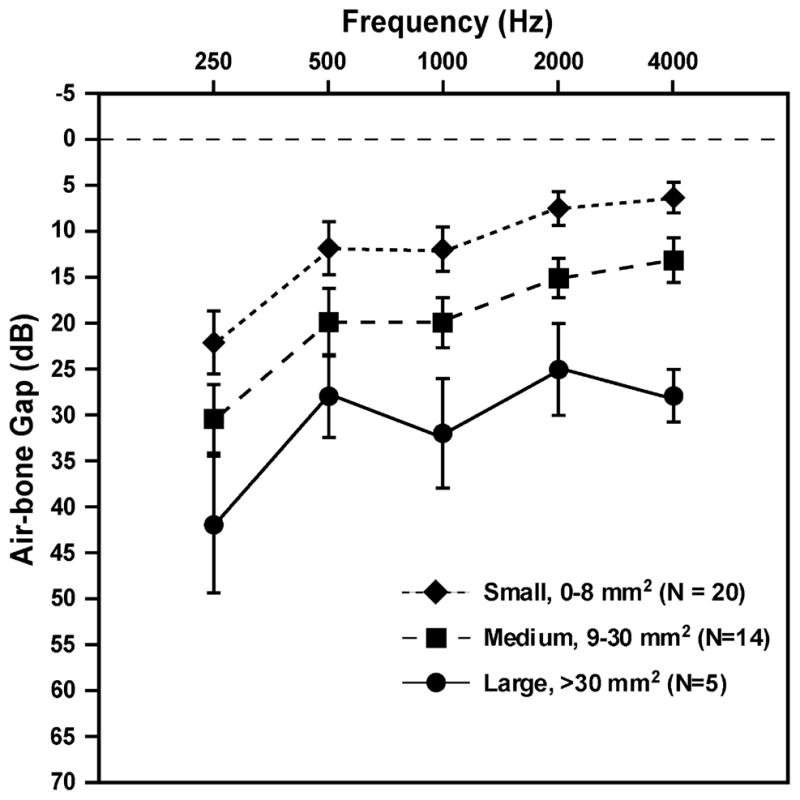
Effects of area of perforation in the large volume group. Areas of perforations are in square millimeters. Error bars indicate ± 1 standard error of the mean.
Effect of Location of Perforation
Perforations of similar size and middle-ear volume but at different locations were identified within the study population (Table 1). Of the 36 perforations that were solely anterior or posterior, 29 (14 anterior and 15 posterior) had large middle-ear volumes greater than 4.3 ml. The anterior and posterior perforations in large-volume ears showed no significant differences in perforation area (p > 0.05) or middle-ear volume (p > 0.05). Thus, this subgroup of 14 anterior perforations and 15 posterior perforations were of similar size and had similar middle-ear volumes. The mean ABGs at each frequency in these 29 ears are depicted in Figure 5. Although there was a trend for the anterior perforations to show a slightly smaller mean ABG (1–8 dB in lower frequencies), no statistically significant differences in ABGs were found at any frequency between anterior and posterior TM perforations (p = 0.09 at 250 Hz, p = 0.40 at 500 Hz, p = 0.07 at 1,000 Hz, p = 0.70 at 2,000 Hz, and p = 0.83 at 4,000 Hz). A power analysis designed to detect a 10-dB difference in ABGs performed using our sample size of 14 anterior and 15 posterior perforations showed that the present study had a power of 80%. A similar analysis for detection of a 5 dB difference had a power of only 34%. The number of ears in the small-volume group was too small to permit a similar comparison of anterior versus posterior perforations.
TABLE 1.
Ears with perforations are grouped by location and volume of middle ear
| Anterior perforations (N = 17) | Posterior perforations (N = 19) | |
|---|---|---|
| Small middle-ear volume (≤4.3 ml) | N = 3 | N = 4 |
| Large middle-ear volume (>4.3 ml) | N = 14 | N = 15 |
FIG. 5.
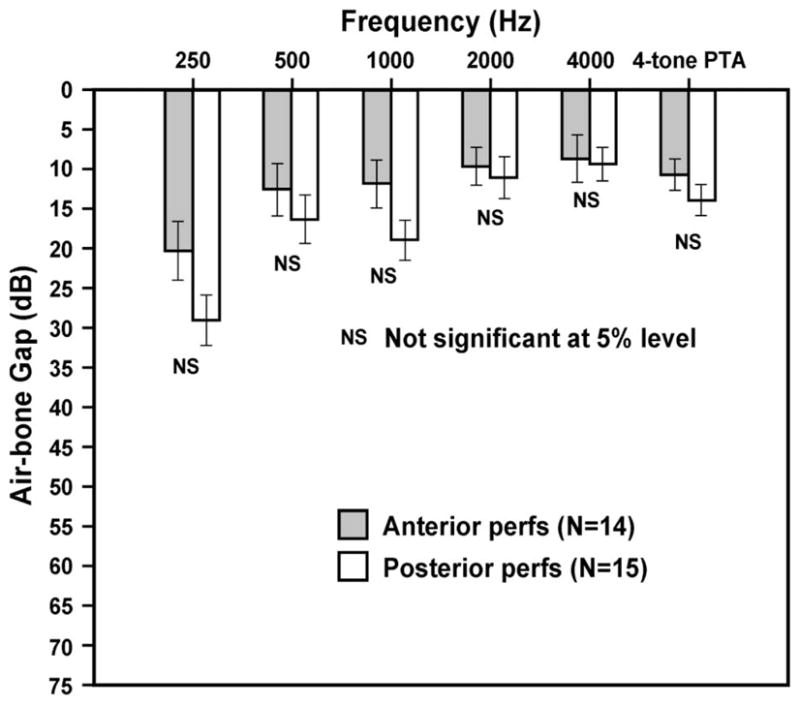
ABGs (in decibels) at each audiometric frequency for anterior versus posterior TM perforations. All ears had a large middle-ear volume, >4.3 ml. The last column indicates a four-tone (500, 1,000, 2,000, and 4,000 Hz) pure-tone average. Perforation sizes were similar in both groups. Error bars indicate ±1 standard error of the mean. NS, not statistically significant at the 5% level (p > 0.05).
Comparison Between Clinical Data and Theoretical Model
Our previously published theoretical model (4) can be used to approximate the hearing loss expected from a TM perforation under certain conditions, as shown in Equation 1.
| (1) |
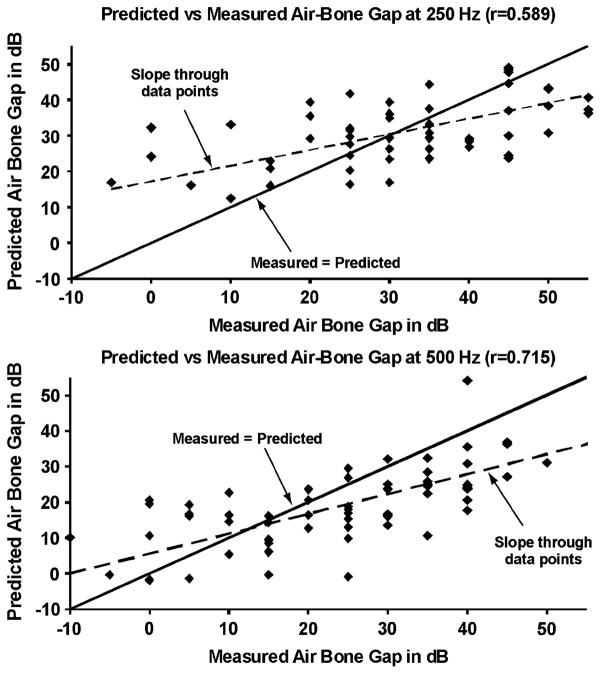
where perforation diameter (d) is in millimeters, frequency (f) is in hertz, middle-ear air-space volume (V) is in milliliters, hearing loss is in decibels, and the constant κ equals 2.867 × 106 cm3mm−1s−2. This “simple” model was predicted to be valid for perforation diameters greater than 1 mm and for frequencies below 1,000 Hz (4). Using this model, predicted ABGs were calculated for each perforation in the present study on the basis of the perforation size and middle-ear volume. These predicted ABGs were compared with ABGs measured audiometrically in these ears (Fig. 6). The correlation coefficients between measured and predicted ABGs were 0.589 and 0.715 at 250 and 500 Hz, respectively. These correlations were highly statistically significant (p < 0.01) at both frequencies, indicating that the measured losses varied regularly with the model’s predictions (based on sound frequency, size of the perforation, and middle-ear volume). However, the data shown in Figure 6 also indicate that there was not a perfect fit between the measured and predicted gaps. The reasons for these deviations are discussed in the next section.
FIG. 6.
Predicted versus measured ABGs at 250 and 500 Hz (n = 62 ears). The solid lines indicate a slope of 1 (measured = predicted). The dotted lines represent a best-fit linear regression line through the data points. The correlation coefficient (r) was highly significant (p < 0.01) for both frequencies.
DISCUSSION
In a normal ear, the sound pressure difference across the TM provides the primary drive to motion of the TM and ossicles (3). Our previous experimental and theoretical work demonstrated that the primary mechanism of hearing loss by a TM perforation is a reduction in middle-ear sound transmission caused by a loss in sound pressure difference across the TM (3–5). We also showed that there was no role played by “phase cancellation at the round window” as a mechanism contributing to hearing loss caused by a perforation. We predicted that a perforation will cause a conductive hearing loss that 1) is largest at low frequencies; 2) increases as the size of the perforation increases; 3) does not depend on location of the perforation; and 4) will vary inversely with the middle-ear volume. The results of the present study using clinical data support the predictions of our previous experimental and theoretical work, which we consider in more detail.
Effect of Sound Frequency and Size of Perforation
Our clinical data (Figures 3 through 5) showed that perforation-induced hearing losses were generally greatest at the lowest frequencies, and decreased as frequency increased. The size of the perforation was also an important determinant of the hearing loss. Larger perforations resulted in greater hearing loss, an effect that was present at all audiometric frequencies. These clinical findings agree with our previous experimental and theoretical predictions (3–5) and with published clinical work (12,13).
Effect of Middle-Ear Volume
The idea that the volume of the middle-ear and mastoid air spaces is a determinant of hearing loss in ears with TM perforations is a novel concept (3–5). Small middle ear volumes are predicted to result in larger ABGs. The reason why middle-ear volume should affect hearing loss caused by a TM perforation is a consequence of the mechanism of hearing loss caused by a perforation. For a given sound pressure in the ear canal and a given perforation, the resulting sound pressure within the middle-ear space will vary inversely with the middle-ear volume. Thus, the trans-TM sound pressure difference will be smaller (and the CHL correspondingly greater) with smaller middle-ear volumes. Middle-ear volumes in normal ears show a wide range, from 2 to 20 ml (9). Therefore, identical perforations in two different ears are predicted to have CHL that can differ by up to 35 dB if the middle-ear volumes differ substantially (3–5).
The clinical data in Figure 3 clearly demonstrate that ABGs were larger in ears with small volumes, which is qualitatively consistent with our prediction. The mean gaps in ears with small volumes were 10 to 20 dB larger than in ears with large volumes. To test the quantitative predictive power of our model, we compared the measured losses to those predicted by Equation 1. It is to be noted that Equation 1 is a simplified model, where the assumptions used in producing the simple model make it valid only at frequencies below 1,000 Hz. We found a statistically significant correlation (p < 0.01) between the measured and the predicted losses at 250 and 500 Hz.
Examination of the data in Figure 6 also indicates that at 250 and 500 Hz, the largest discrepancies between measured and predicted losses occurred at the extremes: the model prediction had a tendency to overestimate the smaller hearing losses and to underestimate the larger losses. These discrepancies can be partially explained by errors in accurate estimation of middle ear volumes at the extremes in our patients. The tympanometer used in the study was insensitive to middle-ear volumes greater than 7 ml, a limitation that also applies to other commercially available tympanometers. As a result of this limitation, an ear with a middle-ear volume greater than 7 ml would have had a tympanometric measurement that underestimated the actual volume which, in turn, would lead to a model prediction that overestimated the hearing loss in that ear. Conversely, when the measured tympanometric volume in an ear was small, errors in the accurate estimation of the ear-canal volume could have large effects, resulting in a model prediction that underestimated the hearing losses.
Effect of Location of Perforation
Our previous experimental and theoretical work (3–5) contradicted a widely held clinical view that posterior perforations result in larger hearing losses than anterior perforations. The explanation for this view has been that perforations over the round window result in a sound pressure acting at the round window that diminishes the cochlear response by a “phase-cancellation effect” (6). This explanation of a phase-cancellation effect is not valid on theoretical or experimental grounds. Because the wavelengths of sound at audiometric frequencies (≤4 kHz) are larger than the middle-ear dimensions, the phase-cancellation effect should theoretically be similar for anterior and posterior perforations. In our previous experimental study (5), oval and round window sound pressures were measured with perforations at different locations, and we found no effect of location of the perforation on the pressure difference between the oval and round windows. It is also important to note that the main mechanism of hearing loss at audiometric frequencies from a perforation is a reduction in driving pressure across the TM. Such a mechanism is expected to be independent of location of the perforation.
The present study showed that there were small (1–8 dB) but statistically insignificant differences in the ABGs at any frequency between anterior and posterior perforations (Fig. 5). Our power analysis suggests that it is possible that this small effect of location is real and that our study lacks sufficient power to distinguish between no effect and a small effect. In contrast, this small effect may have also been artifactual, as a result of the previously discussed limitation in accurate estimation of volumes above 7 ml by tympanometry. All 29 ears in Figure 5 had a large middle-ear volume (>4.3 ml). If the true volumes were larger in the anterior perforation group than in the posterior group (e.g., 14 ml versus 10 ml), our study would not have been able to detect such a difference in volume, but the differing volumes would have influenced the measured ABGs. If there is a small but real effect of location, one would have to postulate a different mechanism of hearing loss caused by a perforation such as a change in coupling between the TM and the manubrium (3). Future investigations may serve to clarify whether any small effect of location of a perforation is real or not.
Clinical Significance
An understanding of the features that contribute to hearing losses in ears with perforations can help clinicians to determine whether the observed loss is the result of the perforation alone or whether additional middle-ear disease can be expected. Our results demonstrate that in addition to size of a perforation, one must consider the middle-ear volume in estimating the perforation-induced hearing loss. Larger middle-ear volumes are associated with smaller ABGs. Indeed, identical perforations are predicted to have ABGs that differ by up to 35 dB if the middle-ear volumes differ substantially.
The idea that middle-ear volume affects hearing loss caused by a perforation has important clinical implications: 1) it provides an explanation for the variability in hearing loss that is observed clinically in patients with otherwise similar perforations; 2) it can account for fluctuations in the hearing loss with the same perforation in a given patient during times of infection when the middle-ear volume might be expected to vary because of mucosal edema or accumulation of fluid within the middle ear spaces; and 3) it can explain the clinical observation that TM perforations in patients with canal wall down mastoidectomy cavities have typically greater ABGs than similar sized perforations in normal ears, because ears with canal wall down mastoidectomy cavities have smaller middle-ear volumes.
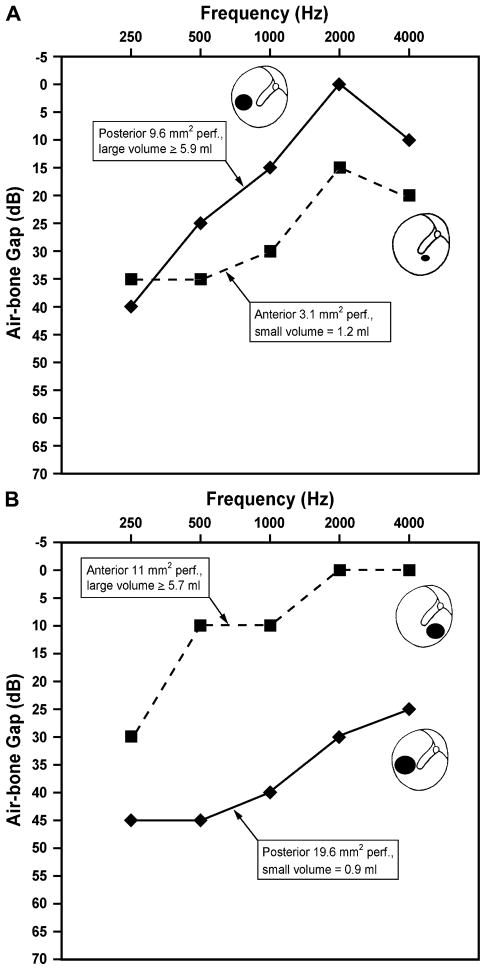
We speculate that the common clinical belief of the importance of location may have resulted from attempts to explain variations in hearing loss with similar sized perforations that were, in fact, caused by interear differences in middle ear volumes. Consider, for example the following cases from our present study. Figure 7A shows the ABGs of two perforations with substantially different middle-ear volumes. The ear with the posterior perforation and a large middle-ear volume has better hearing than the ear with the anterior perforation but a much smaller middle-ear volume. Figure 7B shows the ABGs of similar-sized perforations in different locations (anterior versus posterior), but with differing middle-ear volumes. In both Figure 7A and Figure 7B, the differences in hearing losses can be understood quite readily on the basis of differences in middle-ear volume rather than location.
FIG. 7.
Illustrative clinical cases from the present study comparing the ABGs in perforations with substantially different middle-ear volumes. The differences in hearing losses in these cases can be readily understood on the basis of differences in middle-ear volume rather than location. Ears with smaller volumes demonstrate larger ABGs. (A) An anterior and a posterior TM perforation are shown, with differing middle-ear volumes. The solid line representing a 9.6-mm2 posterior perforation with a greater than or equal to 5.9 ml middle-ear volume has smaller ABGs of 0 to 40 dB. The dashed line is a 3.1-mm2 anterior perforation with a 1.2-ml middle-ear volume and has larger ABGs of 15 to 35 dB. The differences in hearing losses between these two ears can be best explained on the basis of their differing volumes. (B) An anterior and a posterior TM perforation are shown, with differing middle-ear volumes. The solid line representing a 19.6-mm2 posterior perforation and a 0.9-ml middle-ear volume has large ABGs of 25 to 45 dB. The dashed line is an 11-mm2 anterior perforation with a greater than or equal to 5.7 ml volume and demonstrates smaller ABGs of 0 to 30 dB.
Ideally, one would like to use Equation 1 to predict the ABG accurately in a given perforation, using the parameters of size of the perforation and middle-ear volume. An observed gap greater than predicted would imply the presence of additional ossicular disease, with obvious consequences for preoperative counseling and surgical planning before closure of the perforation. As discussed earlier, limitations in measurements of middle-ear volume using currently available tympanometers preclude the use of Equation 1 to accurately predict the hearing loss in a given perforation. However, clinicians can make qualitative judgments about whether a given perforation is responsible for the observed hearing loss or not, on the basis of the perforation size and some knowledge of the middle-ear volume using either tympanometry or computed tomographic scanning. For example, consider a patient with a relatively large 40- to 50-dB ABG with a moderate sized perforation that is approximately 50% of the area of the TM. If this patient has a very small middle-ear volume, based on a tympanometric measurement or computed tomographic scan showing a very sclerotic mastoid, then it is reasonable to conclude that the entire hearing loss is likely caused by the perforation alone. In contrast, a large middle-ear volume for this ear would suggest the presence of additional ossicular disease. Future improvements in the accuracy of measurement of middle-ear volumes by tympanometry or imaging may enable us to better predict the hearing loss for a given perforation.
CONCLUSION
This prospective clinical study of ears with TM perforations showed that 1) the hearing loss is frequency dependent, with the greatest loss occurring at the lowest sound frequencies; 2) the hearing loss increases with increasing size of a perforation; 3) the hearing loss varies inversely with middle ear volume (ABGs are larger in ears with smaller middle-ear volumes); 4) the hearing loss does not vary substantially with location of the perforation. Effects of location, if any, are small.
Acknowledgments
The authors would like to thank the physicians whose patients were recruited for this study (Drs. Joseph Nadol, Michael McKenna, Robert Jyung, Roland Eavey, Michael Cunningham, Christopher Hartnick, Leila Mankarious, and George Kazda) and the staff of the Audiology Department for conducting the audiometric testing.
Supported by NIDCD Grant R01DC04798.
Footnotes
Recipient of the American Neurotology Society Trainee Award for 2005.
References
- 1.Terkildsen K. Pathologies and their effect on middle ear function. In: Feldman AS, Wilber LA, editors. Acoustic Impedance and Admittance: The Measurement of Middle Ear Function. Baltimore, MD: Williams & Wilkins; 1976. pp. 78–102. [Google Scholar]
- 2.Glasscock ME, Shambaugh GE. Surgery of the Ear. 4. Philadelphia: Saunders; 1990. [Google Scholar]
- 3.Voss SE, Rosowski JJ, Merchant SN, Peake WT. Middle-ear function with tympanic-membrane perforations: I—measurements and mechanisms. J Acoust Soc Am. 2001;110:1432–44. doi: 10.1121/1.1394195. [DOI] [PubMed] [Google Scholar]
- 4.Voss SE, Rosowski JJ, Merchant SN, Peake WT. Middle-ear function with tympanic-membrane perforations: II—a simple model. J Acoust Soc Am. 2001;110:1445–52. doi: 10.1121/1.1394196. [DOI] [PubMed] [Google Scholar]
- 5.Voss SE, Rosowski JJ, Merchant SN, Peake WT. How do tympanic-membrane perforations affect human middle-ear sound transmission? Acta Otolaryngol. 2001;121:169–73. doi: 10.1080/000164801300043343. [DOI] [PubMed] [Google Scholar]
- 6.Schuknecht HF. Pathology of the Ear. 2. Philadelphia: Lea & Febiger; 1993. [Google Scholar]
- 7.Voss SE, Rosowski JJ, Merchant SN, Thornton AR, Shera CA, Peake WT. Middle-ear pathology can affect the ear-canal sound pressure generated by audiologic earphones. Ear Hear. 2000;21:265–74. doi: 10.1097/00003446-200008000-00001. [DOI] [PubMed] [Google Scholar]
- 8.Lindeman P, Holmquist J. Measurement of middle ear volume using the impedance audiometer. Am J Otol. 1981;2:301–3. [PubMed] [Google Scholar]
- 9.Molvaer OI, Vallersnes FM, Kringlebotn M. The size of the middle ear and the mastoid air cell. Acta Otolaryngol. 1978;85:24–32. doi: 10.3109/00016487809121419. [DOI] [PubMed] [Google Scholar]
- 10.Rock EH. The physical volume test in impedance audiometry. Ear Nose Throat J. 1991;70:245–50. [PubMed] [Google Scholar]
- 11.Shanks JE, Lilly DJ. An evaluation of tympanometric estimates of ear canal volume. J Speech Hear Res. 1981;24:557–66. doi: 10.1044/jshr.2404.557. [DOI] [PubMed] [Google Scholar]
- 12.Merchant SN, Rosowski JJ. Auditory Physiology. In: Glasscock ME, Gulya AJ, editors. Surgery of the Ear. 5. Hamilton, Ontario: B.C. Decker, Inc; 2003. pp. 59–82. [Google Scholar]
- 13.Ahmad SW, Ramani GV. Hearing loss in perforations of the tympanic membrane. J Laryngol Otol. 1979;93:1091–8. doi: 10.1017/s0022215100088162. [DOI] [PubMed] [Google Scholar]


