

Abstract
The number of applications using neural prosthetic interfaces is expanding. Computer models are a valuable tool to evaluate stimulation techniques and electrode designs. Although our understanding of neural anatomy has improved, its impact on the effects of neural stimulation is not well understood. This study evaluated the effects of fascicle perineurial thickness, diameter, and position on axonal excitation thresholds and population recruitment using finite element models and NEURON simulations. The perineurial thickness of human fascicles was found to be 3.0% ± 1.0% of the fascicle diameter. Increased perineurial thickness and fascicle diameter increased activation thresholds. The presence of a large neighboring fascicle caused a significant change in activation of a smaller target fascicle by as much as 80% ± 11% of the total axon population. Smaller fascicles were recruited at lower amplitudes than neighboring larger fascicles. These effects were further illustrated in a realistic model of a human femoral nerve surrounded by a nerve cuff electrode. The data suggest that fascicular selectivity is strongly dependent upon the anatomy of the nerve being stimulated. Therefore, accurate representations of nerve anatomy are required to develop more accurate computer models to evaluate and optimize nerve electrode designs for neural prosthesis applications.
Keywords: Computer models, functional electrical stimulation, nerve cuff electrode, nerve fascicle, neuroanatomy
I. Introduction
ELECTRICAL stimulation of the nervous system can restore some function in individuals impaired by stroke, spinal cord injury, neural diseases, or trauma [1]. Implantable nerve cuff electrodes can be used to selectively stimulate individual fascicles or fascicular groups, producing selective muscle activation [2]–[4]. Clinically, nerve cuff electrodes have been used to reduce seizures using vagus nerve stimulation [5], restore limited motor function in lower [6] and upper [7] extremities, and restore respiration in patients with spinal cord injury [8]. Despite these successes, there is room for improvement. Computer models can facilitate the evaluation and optimization of nerve cuff electrode designs. They have been used to predict fascicular selectivity of stimulation [2], [9]–[17] and recording [18]–[22] using various electrode configurations.
Previous models examining neural excitation used simplified representations of neural anatomy [2], [9], [11], [12], [14], [19]. Model simplifications included ignoring or fixing the perineurial thickness, (thp) using constant fascicle diameter (Df), and uniformly distributing fascicles within the nerve. The effects of model simplifications on simulation predictions of neural excitation have not been investigated. Neuroanatomical data shows that nerves contain multiple fascicles of varying diameters [23]–[26] and that human nerves have a greater number of fascicles than animal nerves [27]. Additionally, histological studies suggest that a relationship exists between fascicular size and perineurial thickness [23], [28], [29]. The design of clinical peripheral nerve electrodes should account for these factors. Although simulations using realistic nerve anatomy require more computational power and processing time than simplified models, it is feasible to solve them using powerful computers [17].
No standard exists for the thp of a fascicle. As a result, prior modeling studies have ignored perineurial tissue to decrease the model complexity [30] or used a fixed thp regardless of the Df [9], [12]. One study fixed the thp at 30 μm for fascicles of 200–800 μm diameters [12]. Others suggest that thp is roughly 5% of the Df [9], [11], [14], although the evidence for this quantity was not found within the cited sources. Even when this relationship was noted, the perineurial thickness in one study was still fixed to 50 μm for fascicles of 320–870 μm diameters (producing relative percentages of 5.7%–15.6%), due to limitations of the modeling software [9]. It is unclear how these inconsistencies and variations in representation of the perineurial thickness influence model results.
To further simplify the model, several studies fixed the fascicular size [2], [12], [19], ignoring the physiologic variations in fascicle diameter found within nerves. In these studies, the Df was fixed to 800 μm [2], [12] or 617 μm [19]. Additionally, the fascicles were uniformly spaced within the nerve; another frequent simplification inconsistent with neuroanatomy. These simplifications were made to reduce the number of parameters within the models and to facilitate interpretation of the results.
This study determined the effects of perineurial thickness (thp), fascicle diameter (Df), and fascicular position on model predictions of nerve stimulation. Computer simulations were used to investigate the hypotheses that 1) increased perineurial thickness increases axonal activation thresholds, 2) increased fascicle diameter increases activation thresholds, and 3) in multifascicular models, perineurial thickness, fascicle diameter, and fascicular position affect axonal recruitment. Understanding how neural anatomy affects fiber recruitment is important for determining the clinical efficacy of neural prostheses and optimizing their design.
II. Methods
A. Overview
An overview of the general methods used in this study is provided first, followed by detailed descriptions of each model created. Results were obtained using a three-step process of 1) creating and solving 3-D finite element method (FEM) models, 2) using results from these FEM models to interpolate voltages along axons, and 3) applying the interpolated voltages to a double-cable axon model to investigate axonal activation thresholds and population recruitment.
Three-dimensional FEM models were designed in Maxwell 3D v 11.1.1 (Ansoft Corporation, Pittsburgh, PA). Generally, FEM models were comprised of neural tissue, a stimulating electrode, and saline. Fascicles were modeled as 60-mm-long dodecahedrons, which simulates the effects of an electric field on a semi-infinite axon [17]. Perineurium surrounded each fascicle. Tissue conductivities were based on published data (Table I) [12]. In each simulation, a single electrode with one active contact was modeled. The electrode was insulated on all but one side with nonconductive silicone to mimic a peripheral nerve cuff electrode. The stimulating surface of the electrode was 0.5 mm × 0.5 mm, through which a 1 mA cathodic current was applied. Saline surrounded the neural tissue and electrode and had a dimension of 150 mm × 150 mm, × 200 mm a size shown to have little or no affect on the potential along the axon [17]. The edges of the saline volume were defined as sinks to represent a distant ground. Using the built-in solver, the 3-D potential distribution established by the electrode was calculated.
TABLE I.
Conductivities Used for Modeling [12]
| Material | Conductivity (Ω−1·m−1 |
|---|---|
| Perineurium | 0.0021 |
| Endoneurium | |
| longitudinal | 0.57 |
| transverse | 0.083 |
| Epineurium | 0.083 |
| Saline | 2.0 |
The potential distributions were imported into MATLAB 7.0 (The MathWorks, Inc., Natick, MA) and used to interpolate voltages along each assigned axon inside the fascicle using a 3-D cubic spline [17]. Simulated axon diameters ranged from 4–16 μm, which is within physiological range for mammalian nerves [31], [32]. The positional offset of the Node of Ranvier closest to the z = 0 plane on which the electrode was centered was randomized, falling between no offset and the maximum offset possible: half of the internode length [17].
The interpolated voltages were applied to the McIntyre, Richardson, and Grill (MRG) [33], [34] double-cable axon model in NEURON.1 This model was chosen because it accurately represents the mammalian axon response to stimulation. NEURON simulations used a binary search to determine the axonal threshold required to generate a propagating action potential for a single pulse of 0.025–0.5 ms duration. The percent activation of a fascicle was determined using simulations of five distinct axon populations. Each population was made up of 20 axons of varying diameter, based on a physiologic diameter distribution from [31], [32], randomly positioned throughout the fascicle. The number of axons in which a propagating action potential occurred during stimulation was divided by the total number of axons in the population. The mean and standard deviation for the activation of the five populations was computed. The activation of an axon or a population of axons was assumed to have no affect on the response of any other axon or population of axons. Statistical significance of the NEURON simulation data was evaluated using Minitab v15 (Minitab Inc., State College, PA) with α set to 0.05.
The subsequent sections provide a more detailed description of the specific modifications made to the general methods to examine the stated hypotheses.
B. Effects of Perineurial Thickness on Activation Thresholds
Before the computational modeling began, we performed a literature search for measurements of the physiologic perineurial thickness. Measurements reported by Sunderland and Bradley [23] for 704 fascicles from 20 human peripheral nerves were analyzed to quantify the relationship between thp and Df. In the discussion of [23], the authors suggest that a linear relationship between thp and Df exists. To quantify this relationship, we divided each fascicle’s thp by its Df. The thp as a percent of the corresponding Df for individual nerve types and for the entire data set was reported as average ± one standard deviation. The physiologic measurements of the thp and Df were compared to previously used values in modeling studies.
Once the relationship between thp and Df was determined, a FEM model was created to investigate effects of thp on axonal of thresholds. This model consisted of one fascicle with a Df 500 μm and an electrode centered above it [Fig. 1(a)]. One axon was positioned at the center of the fascicle. The electrode-axon distance, d1, was 500 μm. The thp was varied from 0%–15% of Df, to determine its effect on axonal threshold.
Fig. 1.

FEMs used to examine effects of fascicle perineurial thickness, diameter, and position on model predictions of axonal thresholds and recruitment. The fascicle, perineurium, and electrode were encased in a saline volume in all models shown.
C. Effects of Fascicle Diameter on Activation Thresholds
FEM models were made to examine the effects of on axonal activation thresholds [Fig. 1(b)]. Fascicular diameters of 100, 500, and 1000 μm were studied, based on the reported physiologic range for mammalian peripheral nerves [23], [25], [27]. For each model, thp of 0, 3, 15, and 30 μm was tested. To account for geometric effects, electrode-perineurium distance, d2, was held constant at 250 μm. One axon was positioned inside the fascicle with a constant electrode-axon distance, d1, of 300 μm. This axon was not necessarily at the center of the fascicle. The effects of varying both the Df and thp were assessed based on axonal threshold.
D. Effects of Fascicles on Neighboring Fascicles
1) Two Fascicles Side-by-Side
Two-fascicle FEM models were designed to determine how neural anatomy affects more complex, multifascicular nerve models [Fig. 1(c)]. The control fascicle (A) had a fixed Df of 500 μm and a fixed thp 15 μm (a relative thickness of 3%, see Results). Diameter (100, 300, 500, 700, or 1000 μm) and perineurial thickness (3, 9, 15, 21, or 30 μm) were varied, at all permutations, in a second fascicle (B). The centers of the two fascicles were a fixed distance of 900 μm apart, while the distance between the perineurium edges, d3, varied with B Df and thp. The electrode was centered between varied with B and the two fascicles, 800 μm above the fascicle axis of symmetry. A model containing only fascicle A served as the control. By moving fascicle B relative to fascicle A, the effect of distance between perineurium edges, d3, was also investigated (d3 ranged from 25–2000 μm).
In MATLAB, five distinct populations of axons were randomly distributed throughout fascicle A. These axons were individually simulated in NEURON and stimulated with a pulse ranging from 0.025–0.5 ms in width and 1–1.5 mA in amplitude to achieve recruitment. The percent of axons activated in fascicle A when fascicle B was added to the model was compared against the results obtained from the control-only model, where fascicle B was not included. To allow for direct comparison between control and neighboring fascicle models, the randomized spatial distribution and diameters of the axons in fascicle A were held constant in each simulation. No active interactions between the two fascicles or between multiple axons were simulated.
2) Surrounding Neighbor Effects
The impact of a fascicle oriented around the control fascicle was examined. For this set of simulations, a neighboring fascicle was moved around the target fascicle [Fig. 1(d)]. Fascicle A had a 500 μm diameter and was centered 1.43 mm below the electrode. Neighboring fascicle B had a variable diameter of 100, 500, or 1000 μm and was moved around fascicle A in 5° increments, 0° ≤ α ≤ 180°. The thp was modeled at 3% of the Df for each fascicle. The distance between the edges of the perineurium of A and B, d3, was 50 μm. Following the same techniques detailed previously, the percentage of fascicle A axons that propagated an action potential was found in simulations containing only the control fascicle and compared to that obtained from simulations that included a neighboring fascicle.
E. Realistic Geometry Based on Cadaveric Nerve
A realistic nerve model was used to illustrate the clinical relevance of our findings. An FEM model of a cadaveric human femoral nerve, based on a histological nerve cross section [24], was chosen as an example of a realistic nerve model. A similar model is currently being used to improve the design of nerve cuff electrodes intended for femoral nerve stimulation [17]. A pair of neighboring fascicles was chosen to demonstrate the thp, Df, and neighboring fascicle effects in a realistic nerve model (Fig. 2). These two fascicles were chosen because of their differences in diameters and functions, which makes selective activation of these fascicles more desired for functional electrical stimulation. Fascicles 1 and 2 had diameters of 200 and 650 μm, respectively. Their centers were 550 μm apart.
Fig. 2.
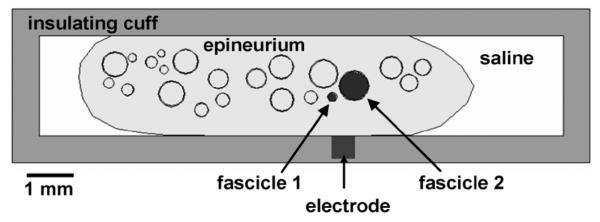
Model of a femoral nerve cross section inside a nerve cuff electrode adapted from [17], [24]. Fascicles 1 and 2 were chosen to investigate the effects of perineurium thickness, fascicle size, and neighboring fascicle effects on fascicular activation. Perineurial thickness was varied between 0% and 3% of fascicle diameter, 30 μm, and 50 μm. Fascicles were surrounded by epineurium which was encased in saline and stimulating electrode was placed in an insulating cuff.
Four FEM models were generated: 1), 2) a model of each individual fascicle in the pair, 3) a model of both fascicles in the pair, and 4) a model with all fascicles in the nerve cross section. Unlike our previous models, these models also included epineurium around the fascicles. Four perineurial thicknesses were tested, 0% and 3% of the each fascicle diameter, 30 μm (equal to 15% of fascicle 1 diameter and 4.6% of fascicle 2 diameter), and 50 μm (equal to 25% of fascicle 1 diameter and 7.7% of fascicle 2 diameter). These perineurial thicknesses were chosen based on thickness used in previous models [9], [12], [30] and our analysis of physiologic perineurial thickness (see Section III). The electrode contact was placed on the inner surface of the cuff and centered between the two fascicles in the chosen pair.
The percent activations of each of the two fascicles alone, with a neighboring fascicle, and with all fascicles in the cross section were compared over a range of recruitment levels (pulse widths of 0.01–0.1 ms). The effects of the Df and thp were also assessed based on the computed percent activations.
F. Perineurial Conductivity Sensitivity Analysis
Throughout this study, we used amphibian perineurial conductivity of 0.0021 S/m, which is within the range of 0.0006 to 0.01 S/m used in previous models [9]–[12], [16], [17], [19]. Using the model shown in Fig. 1(c), a perineurial conductivity sensitivity analysis was conducted. Perineurial thickness of 3% of the fascicle diameter was used (see Section III) and its conductivity was varied from 0.0002 to 2 S/m. As perineurial conductivity was varied, fascicle A center axon threshold and the effects of a neighboring fascicle on the percent activation of fascicle A were observed to determine the sensitivity of the models to perineurial conductivity.
III. Results
A. Effects of Perineurial Thickness on Activation Thresholds
Physiologic measurements of thp and Df from [23] were plotted (Fig. 3) and their relationship for different nerves was calculated (Table II). The perineurial thickness expressed as a percentage of the fascicle diameter was 3.0% ± 1.0% (range 1.3%–8.9%). A linear fit of the data with the intercept fixed at zero was 2.6% (R2 = 0.67). The values used in previous computer modeling studies [9], [12], [15], [19], [22], [30] were also compared to the physiologic perineurium thickness measurements in Fig. 3.
Fig. 3.
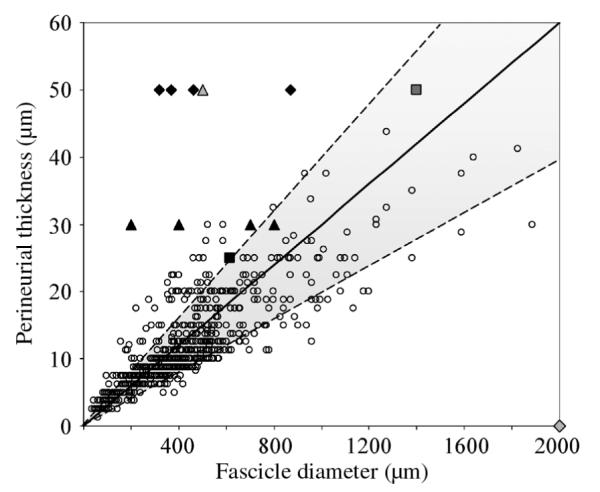
Physiologic thickness of human perineurium versus the fascicle diameter for individual fascicles. The shaded area represents the relationship between human perineurial thickness and fascicle diameter of 3.0%± 1.0%, based on the raw data reported by Sunderland and Bradley [23]. The values used in previous computer modeling studies are presented for comparison:  Deurloo et al. [9],
  Choi et al. [12],
  Hennings et al. [15],
  Perez-Orive and Durand [19],
  Rahal et al. [22], and
  Szlavik and de Bruin [30].
TABLE II.
Relationship Between thp and Df Categorized by Nerve Type
| Total | Sciatic | Medial Popliteal | Lateral Popliteal | Ulnar | Radial | Median | |
|---|---|---|---|---|---|---|---|
| thp as % of Df (μ ± σ) | 3.0 ± 1.0 | 3.3 ± 0.7 | 2.6 ± 0.4 | 2.8 ± 0.6 | 2.6 ± 0.8 | 3.0 ± 0.9 | 3.3 ± 1.3 |
| # specimens | 20 | 1 | 1 | 1 | 4 | 2 | 11 |
| # fasciles | 704 | 32 | 51 | 39 | 107 | 189 | 286 |
The threshold necessary to activate an axon at the center of the fascicle increased with an increase in the modeled thp (Fig. 4). For each axon diameter, results were normalized to the activation thresholds when no perineurium was present. Adding a 3% thp to the model increased the threshold by 14%–51%, depending on axon diameter and pulse width. Increasing thp had a larger effect on small diameter axons than large ones. These trends were consistent across tested pulse widths.
Fig. 4.
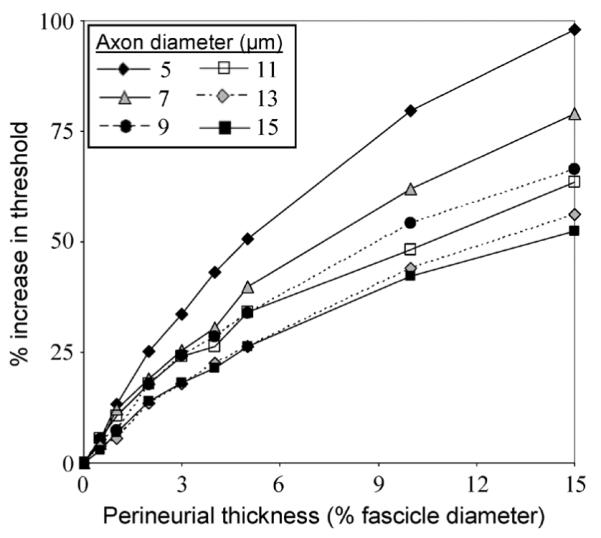
Axonal threshold increased with increasing perineurial thickness and decreasing axon diameter. The axon was positioned at the center of a 500-μm-diameter fascicle. This data was obtained at 0.075 ms pulse width; however, trends were consistent for pulse widths ranging from 0.025–0.5 ms.
B. Effects of Fascicle Diameter on Activation Thresholds
Activation thresholds increased with Df when thp physiologic (3%) (Fig. 5). With thp, equal to 3% of Df increasing from 100 to 500 μm increased axonal threshold by 28%–60% and increasing from 500 to 1000 μm increased axonal threshold by 26%–41%, depending on axon diameter and pulse width. Axonal thresholds increased with increasing thp, for each modeled Df and these effects of thp were more pronounced for larger Df. Using a nonphysiologic fixed thp could reverse this trend; without a perineurium, axonal threshold decreased with increasing Df. This was consistent over the tested pulse widths and axon diameters.
Fig. 5.
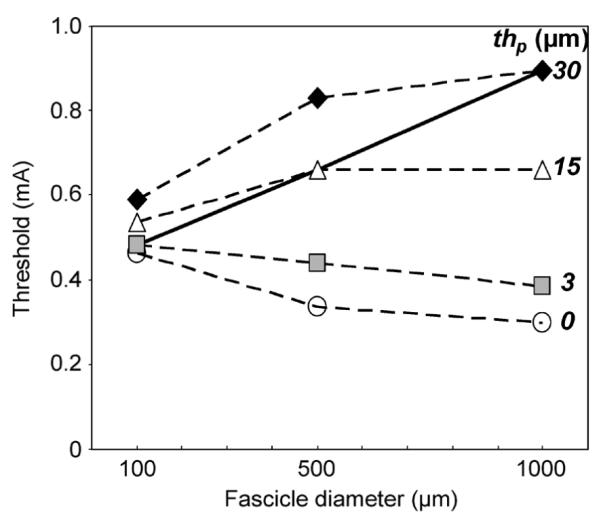
Cathodic activation thresholds increased with fascicle diameter when perineurial thickness was physiologic (3%, solid line). Thresholds increased with increasing perineurial thickness for each tested diameter. Not including perineurium resulted in under-prediction of thresholds. Trends shown in this plot of thresholds for a 10-μm-diameter axon stimulated for 0.025 ms were consistent over all simulated pulse widths (0.025–0.5 ms) and axon diameters (4–15μm).
C. Effects of Fascicles on Neighboring Fascicles
1) Two Fascicles Side-by-Side
The percent activation of fascicle A for each permutation of Df and thp of fascicle B was compared to that obtained without fascicle B. Fascicle A activation increased as Df and thp of fascicle B increased (Fig. 6). Statistically significant increases in activation of A were observed when Df of B was greater than or equal to Df, of A (p < Student’s t-test, as compared to 0% increase in fascicle A activation). The magnitude of the increase in activation depended on the recruitment level of A. With the addition of fascicle B of 1000 μm diameter and 30 μm thp, the percent activation in fascicle A increased from 15% ± 7% to 47% ± 6%; a starting activation level of 80% ± 13% increased to 90% ± 8%. The effect of thp of fascicle B on activation of fascicle A was not statistically significant. For all pulse widths and amplitudes tested, the activation in fascicle A increased due to the addition of fascicle B, unless the stimulus was large enough to activate 100% of fascicle A.
Fig. 6.
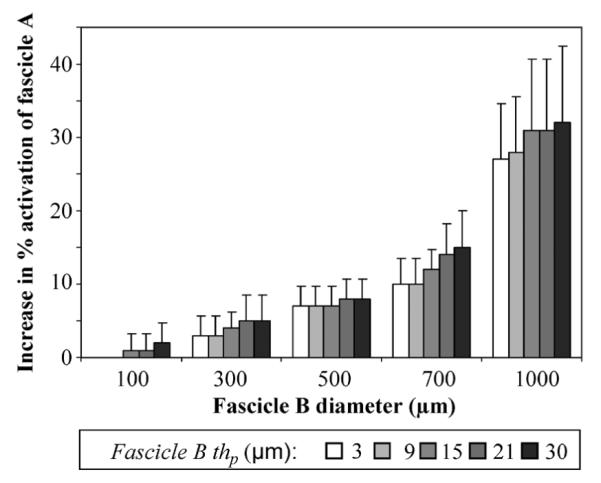
Fascicle A activation increased as fascicle B diameter and perineurial thickness increased. Increase in activation was computed by subtracting the activation of fascicle A alone (500 μm diameter, 15 μm perineurium thickness) from activation of fascicle A with fascicle B. Fascicle B diameter was varied between 100–1000 μm and its perineurial thickness (thp) was varied between 3–30 μm. The percent activation of fascicle A when no neighbor was present was 15% ± 7% and increased to as high as 47% ± 6% when a neighboring fascicle was added to the model (0.1 ms, –1 mA stimulation). The increase in activation of fascicle A due to the addition of a neighboring fascicle was significant for fascicle B diameters > 300 μm, at all perineurium thicknesses (p < 0.005).
As fascicle B was moved closer to fascicle A, its affect on fascicle A increased (Fig. 7). For all tested distances between the two fascicles ≤ 700 μm, the addition of a 500 or 1000 μm diameter fascicle B resulted in a statistically significant increase in activation of fascicle A (p < 0.004). A 100-μm-diameter neighboring fascicle negligibly affected the control fascicle’s activation.
Fig. 7.
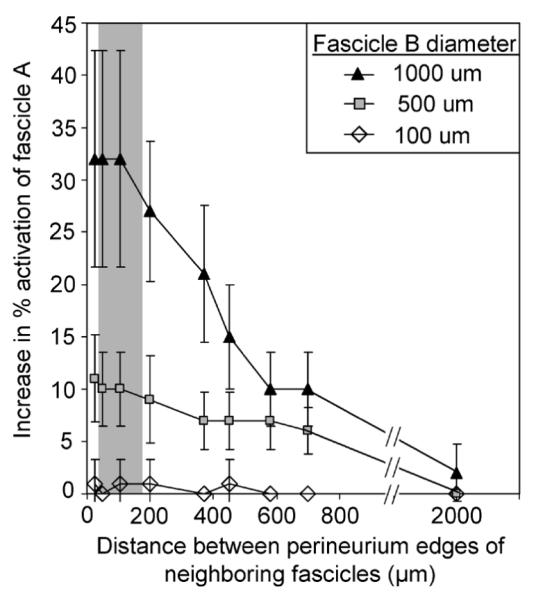
Decreased distance between the fascicle perineurium edges resulted in increased effect of the neighboring fascicle on activation of the control fascicle. Control fascicle A had a constant diameter of 500 μm, while neighboring fascicle B diameter was varied between 100–1000 μm. The perineurium thickness was modeled as 3% of the fascicle diameter. The addition of a 500 or 1000 μm diameter fascicle B resulted in a significant increase in activation of fascicle A for all distances≤ 700 μm (p < 0.004, Student’s t-test, as compared to 0% increase in fascicle A activation). The shaded region represents the physiologic range of distances (28–174 μm) between neighboring fascicles in the human femoral nerve cross section.
2) Surrounding Neighbor Effects
When the neighboring fascicle was moved around the control fascicle, the location and the Df of the neighbor affected the percent activation of the control fascicle. Fig. 8 shows the change in percent activation of the control fascicle caused by the addition of the neighboring fascicle. As the relative size of the neighboring fascicle increased, the magnitude of its effect on the activation of the control fascicle increased. For fascicle B diameters of 500 and 1000 μm, the percentage of axons activated in fascicle A significantly decreased if the neighboring fascicle was positioned at α < 50° (p < 0.03, p < 0.02, respectively). This change is representative of over-prediction of activation by the control-only model by as much as 80% ± 11% of the total axons in fascicle A. Conversely, the percentage of axons activated in the control fascicle significantly increased if the neighboring fascicle was located at α > 65° for 500 μm fascicle B or α > 50° for 1000 μm for 500 μm fascicle B (p < 0.03, p < 0.009, respectively). In these positions, the change is representative of under-prediction of activation of fascicle A by the control-only model of as much as 31% ± 10% of the total axon population. The under- and over-prediction regions imply that the addition of the neighboring fascicle increased or decreased, respectively, the percent activation of the control fascicle.
Fig. 8.
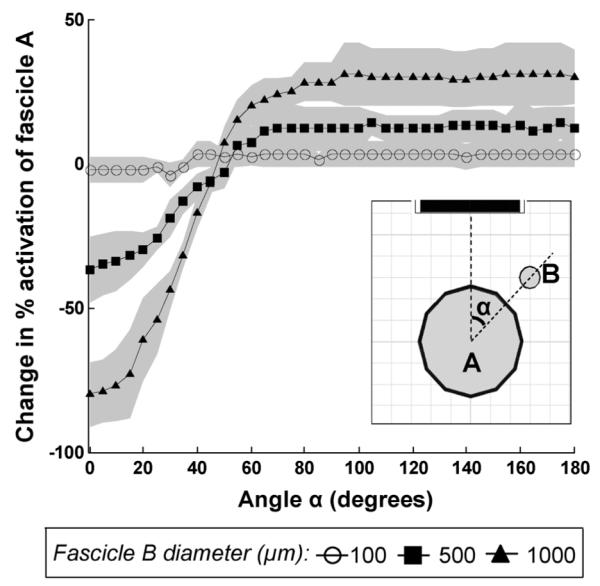
When the neighboring fascicle was moved around the control fascicle, the location and the diameter of the neighbor changed the percent activation of the control fascicle. The amount of change was computed by subtracting the percent activation of fascicle A alone from fascicle A with a neighboring fascicle present (standard deviation of the change in activaiton shown with the shaded region around each curve). The neighbor effects were significant at all locations except at α = 50° for a 1000-μm neighbor and at 50° < α < 65° for a 500-μ m neighbor. The effects of a 100-μm-diameter neighbor were negligible.
D. Realistic Geometry Based on Cadaveric Nerve
Results using realistic neuroanatomy models, shown in Fig. 2, were consistent with results from the previous sections. Simulations showed that the target Df, the presence of neighboring fascicles, the interaction between the thp and the interaction between thp and presence of neighboring fascicles were statistically significant (p <0.001, ANOVA). In all models, the small fascicle 1 had significantly higher activation levels than the larger fascicle 2 [p < 0.0001, Tukey’s t-test; Fig. 9(b)]. The addition of all neighboring fascicles in the nerve cross section significantly increased the activation of fascicle 1 as compared to fascicle 1 alone, for all thp not equal to 0 [Fig. 9(a)]. The activation of the large fascicle 2 was not significantly affected by the addition of neighboring fascicles, regardless of thp. The presence of perineurium resulted in significant changes in activation of fascicle 1 when all fascicles were modeled [p < 0.05, Tukey’s t-test; Fig. 9(a)]. The magnitudes of the effects of perineurial thickness, fascicle diameter, and the presence of neighboring fascicles varied depending on the level of recruitment of the target fascicle [Fig. 9(a) versus (b)].
Fig. 9.

Fascicle diameter and the addition of neighboring fascicles significantly changed the activation of fascicles 1 and 2 in the realistic nerve model shown in Fig. 2. The percent activation of fascicles 1 and 2 alone, with neighbor, and with all fascicles in the cross section were compared at two recruitment levels (a) 20 μs and (b) 30 μs pulse widths and 0.1 mA stimulation amplitude. The smaller fascicle 1 (ABC) was recruited first and was significantly more activated than the larger fascicle 2 (DEF), at all perineurium thicknesses (b). With perineurium included, the addition of neighboring fascicles significantly changed the activation of the small fascicle 1 but not the large fascicle 2. The addition of perineurium to the model containing all fascicles resulted in significant changes in activation of fascicle 1 (a).
E. Perineurial Conductivity Sensitivity Analysis
A separate set of models were run to determine the effects of perineurial conductivity (data not shown). Decreasing perineurial conductivity resulted in increased center axon thresholds in fascicle A. However, changing the perineurial conductivity did not change the overall trends of the effects of the neighboring fascicle B on the control fascicle A that were shown in Figs. 6 and 7.
IV. Discussion
A. Effects of Perineurial Thickness on Activation Thresholds
Histological measurements have shown that perineurial thickness varies with fascicle diameter [23], [28]. Our analysis quantified this relationship and showed that in human peripheral nerves is 3.0% ± 1.0% of the Df As shown in Fig. 3, many studies overlooked this relationship and used constant perineurial thicknesses [9], [12], [22]. Modeling thp as dependent on Df is more physiologically accurate than using a constant thp. The data in this study shows that varying affects the axonal stimulation thresholds in unifascicular computer models (Fig. 4). The presence of the perineurium decreases the gradient of the potential field inside the fascicle [35] and decreases the second difference in extracellular voltage along the axon, thereby increasing stimulation thresholds. These data suggest that ignoring the perineurium, as was done in [30], may result in an underestimation of the activation thresholds by as much as 14%–51%, depending on the axon diameter. Alternatively, using a thp that is too large, such as 15% of the Df instead of 3%, may overestimate the activation thresholds by as much as 35%–78%, depending on the axon diameter (Fig. 4). Consequently, modeling nonphysiologic perineurium may lead to over- or under-prediction of fiber recruitment during neural stimulation and inaccurate conclusions when trying to optimize a neural prosthesis.
The effect of perineurium on activation thresholds depends on its relative resistance, which is a function of the thickness and resistivity of the perineurial tissue layer. Therefore, the voltage distributions inside the modeled fascicles and, consequently, the predicted activation thresholds can vary depending on the thp and the chosen electrical properties of the neural tissue [19], [30]. To our knowledge, perineurial conductivity has not been measured in mammalian nerves. In this study, we varied the thp and used an amphibian perineurial conductivity of 0.0021 S/m, which is within the range of 0.0006–0.01 S/m used in previous models [9]–[12], [16], [17], [19]. Other studies have used another approach of fixing the thp and adjusting its conductivity based on Df [11], [36], which may yield an equivalent resistance of the perineurium. Our results are contingent on the assumption that perineurial conductivity in frogs is similar to that in mammals. Due to its large resistivity relative to that of other neural tissues [35], perineurium causes bending of the electric field lines around fascicles [12]. Therefore, overestimating thp increases resistance to current flow into the fascicle, decreases the gradient of the potential inside the fascicle and the second difference in voltage along the axon, and ultimately overestimates activation thresholds.
The results of this study suggest that modeling nonphysiologic perineurial thickness has the potential to alter predictions on stimulation selectivity. Several previous studies did not account for the relationship between thp and (Fig. 3) [9], [12]. One study used a 30 μm thp for fascicles of 200–800 μm diameters, producing relative percentages of 3.75%–15% [12]. Another study fixed the thp at 50 μm, for fascicle diameters of 320–870 μm, producing relative percentages of 5.7%–15.6% [9]. Based on our results, if the perineurium of the smaller fascicles had been modeled as the physiologic 3% of Df, more axons in these fascicles would have been activated at lower thresholds. Consequently, modeling physiologic thp may alter the conclusions drawn from these models. Therefore, computer models designed to investigate neural stimulation selectivity should include physiologic to achieve more precise results.
B. Effects of Fascicle Diameter on Activation Thresholds
Some studies fixed Df to simplify model complexity [2], [12], [19]. However, mammalian nerves consist of fascicles of varying diameters [23]–[27]. This simplification ignores the effect of Df on activation thresholds. Since thp is related to Df (Fig. 3), fixing Df also fixes thp We showed that Df significantly affects axonal threshold. Using physiologic thp small fascicles had lower activation thresholds than large fascicles (Fig. 5). These results match those seen experimentally where the small common peroneal nerve fascicle consistently had a lower activation threshold than the larger tibial nerve fascicle [11]. Increasing Df increases resistance to current flow into the fascicle due to the increasing thp and through the fascicle due to the increasing amount of transverse endoneurium resistance, which may explain our findings that larger fascicles have higher thresholds.
Using a fixed thp resulted in different activation thresholds than when the perineurium was modeled as 3% of the Df (Fig. 5). When no perineurium was modeled (thp = 0 μm) axons in larger fascicles had lower thresholds than those in smaller fascicles. This trend reversal further demonstrates the importance of modeling physiologic thp and Df We believe that the model geometry is the underlying cause for the trend reversal in activation thresholds. The distance between the electrode and the axon and the amount of endoneurium between the electrode and axon were held constant. Therefore, larger fascicle diameters resulted in an increased amount of endoneurium below the location of the axon. Due to the anisotropy of the endoneurium, as the fascicle diameter increases, there will be an increased resistance to current flow through the fascicle as compared to along the fascicle. Current paths will be altered as thp and endoneurial size/volume change.
As shown in this and previous studies, large fascicles are more difficult to stimulate than small fascicles [11], [12]. Therefore, models looking at fascicle selectivity during neural stimulation should include the physiologic sizes of the fascicles for more accurate results. Otherwise, if all fascicles were modeled with equal diameter, selectivity predictions may not match experimental outcomes. These results further illustrate the importance of modeling physiologic around fascicles because fixing the thp may alter axonal thresholds and consequently selectivity measures of fascicles of different sizes.
C. Effects of Fascicles on Neighboring Fascicles
The effect of one fascicle on its neighboring fascicle has not been previously documented. As demonstrated in Figs. 6–8, fascicular activation of the target fascicle was altered by the location, thp, and Df of neighboring fascicles. This trend was true even when the neighboring fascicle was located behind the target fascicle, relative to the electrode. The change in activation level of the target fascicle was more pronounced when the neighboring fascicle size and thp exceeded that of the target. As shown in Fig. 7, increased distance between fascicles reduced the magnitude of this effect, but the effect was still significant for physiologic distances of 95 ± 47 μm (range of 28–174 μm) between a fascicle and its closest neighbor in a femoral nerve cross section. Therefore, within this range of physiologic distances, neighboring fascicles are expected to influence the fascicular stimulation selectivity of nerve cuff electrodes.
One possible mechanism for this neighboring fascicle effect could be due to current being shunted away from the large fascicle towards its smaller, less resistive neighbor, which alters the voltage distributions. As expected, there is an increase in impedance of the fascicles caused by increased Df and thp. Because current follows the path of least resistance, more current may enter a smaller fascicle due to the relatively high resistance of the larger neighboring fascicle, resulting in a larger percentage of activated axons within the smaller fascicle. The effect may be more prominent when fascicles have a large disparity in size due to a larger mismatch in their resistances.
Gradients in the extracellular field potentials determine the axon activation levels; therefore, additional insight may be gained from examining the field distributions directly. Our functional approach of showing the neighboring fascicle effects on the percent activation of the target fascicle was chosen because, in general, previous modeling studies [12], [17] used activation levels, rather than raw field distributions or activating functions, to make conclusions about stimulation selectivity. Activation levels are also used to predict muscle forces and joint moments in biomechanical models that may follow neural stimulation modeling. Future studies should explore the potential field gradients to determine if current shunting is the mechanism behind the observed neighboring fascicle effects.
Studies that use uniformly distributed fascicles of equal diameter [2], [12], [19] minimize the effects neighboring fascicles have on each other. Fixing the fascicle diameter may lead to inaccuracies in model predictions because the effects of target and neighboring fascicle diameters on activation thresholds are ignored. It is possible that using these types of simplifications would yield predictions that do not match experimental results.
In an effort to simplify computationally intensive models, some investigators may also choose to exclude fascicles from the modeling space. Most likely, the fascicles that would be eliminated from the modeling space would be those that did not fall between the stimulating contact and the fascicle of interest. If a small amount of error can be tolerated, then these simulations indicate that it may be acceptable to remove fascicles from the simulation space if they are much smaller in diameter than the fascicle of interest. However, if the removed fascicles are the same size or larger than the fascicle of interest, even if they do not fall between the stimulating contact and the fascicle of interest, the effect on the percentage of axons that propagate an action potential in a target fascicle can be nontrivial. Subdividing a nerve model or excluding certain fascicles may yield inaccurate predictions of fascicle activation levels if the neighboring fascicle effects are not taken into account. Modeling the physiologic nerve anatomy would be the most accurate way to account for the effects of each fascicle on its neighbors.
D. Realistic Geometry Based on Cadaveric Nerve
Neural anatomy directly impacts clinical peripheral nerve stimulation, especially where the desired outcome is selective activation of a specific fascicle or a group of fascicles. Our results showed that axonal thresholds are affected by the Df, thp, and position of not only the target fascicle but also of its neighboring fascicles. Demonstration of these effects in a multifascicular model of a human nerve specimen (Fig. 2) being used to design and optimize clinical electrodes to restore standing and walking [17] shows the relevance of these findings.
Simulations of the realistic nerve model (Fig. 2) showed that increasing the thp resulted in decreased recruitment of the target fascicles, as predicted by the idealized model in Fig. 4. The fascicle diameter effects, shown in Fig. 5, were also seen in the realistic model, where the large fascicle required higher stimulus amplitudes for activation than the small fascicle (Fig. 9). However, due to the geometry of the nerve cross section, more axons in the large fascicle were located further from the electrode, which could also explain the lower levels of activation of the large fascicle as compared to the small fascicle. Additionally, the percent activation of the small fascicle (fascicle 1) increased due to the addition of just one large neighboring fascicle (fascicle 2) and further increased due to the addition of the remaining fascicles in the nerve cross section, reaffirming the trends seen in idealized models (Figs. 6–8).
In clinical practice, selective stimulation of fascicles with different functions may be desired. Based on the Df, thp, and neighboring fascicle effects, selective stimulation of a large fascicle that has a small neighbor becomes more challenging, while selective activation of a small fascicle with large neighbor becomes easier. In the specific fascicle pair used in this study, the percent activation of the small fascicle increased by as much as 17% ± 6% due to the presence of neighboring fascicles with physiologic thp. This change could have significant clinical impact depending on the functions of each fascicle and on the application of the neuroprosthesis.
E. Sensitivity Analyses
The conductivity of mammalian perineurium is currently unknown. A sensitivity analysis on the effects of perineurial conductivity showed that predicted axonal activation thresholds varied with perineurial conductivity but the overall trends in the effects of neighboring fascicles did not. This suggests that the effects of neighboring fascicles observed in this study are robust.
The presence of epineurium did not affect the trends in the results observed in this study. The realistic nerve model in Fig. 2 included epineurial tissue around the fascicles. Although the magnitudes of the effects of Df and thp changed with the presence of the epineurium, the trends observed in the saline models carried over to this realistic model containing epineurium.
Based on further sensitivity analyses, the electrode-axon distance did not appear to affect the trends shown in this study. Axonal activation thresholds increase with an increase in electrode-axon distance [37]. The electrode-axon distance was varied in these models by moving the fascicle and the axon relative to the electrode. As expected, the effects of thp and of Df on axon thresholds reported in our study decreased with an increase in electrode-axon distance, however overall trends remained unchanged (data not shown). This suggests that if the model contains an electrode sufficiently far away from the nerve, the thp and Df of the fascicle of interest may not have as significant of an impact on the model results as compared to when the electrode is within close proximity of the fascicle. However, in neural prostheses that use nerve cuff electrodes, the electrode-axon distance is limited by the dimensions of the cuff. Due to the proximity of the cuff to the nerve, the axon-electrode distance would not be sufficiently large to completely eliminate the effects of the thp and Df on the model prediction of excitation. Therefore, thp and Df should be included at their physiological sizes for computer models of nerve cuff electrodes.
V. Conclusion
Neural anatomy significantly affects model predictions of activation thresholds and recruitment levels during nerve stimulation. Increased perineurial thickness and fascicle diameter result in predictions of increased stimulation thresholds of peripheral nerve axons. The fascicular diameter, perineurial thickness, and relative position of one fascicle affect the recruitment levels of its neighboring fascicle in models of neural stimulation. These effects result in smaller fascicles being recruited first and therefore being easier to selectively activate. Since perineurial thickness is dependent on fascicle diameter and fascicle size varies in humans, physiologic values and accurate representations of the nerve of interest should be used to develop computer models to evaluate and design electrodes for neural prosthesis applications. Improved accuracy of modeling results has the potential to improve neural prostheses designs and ultimately the predictions of clinical efficacy of neural prostheses.
Acknowledgment
The authors would like to thank Dr. N. Bhadra, Dr. A. Jensen, and Dr. D. Durand for their critical feedback.
This work was supported in part by the National Institutes of Health under Grant EB001889 and Grant DK077089 and in part by the Department of Veterans Affairs RR&D B3675R.
Biography
 Yanina Grinberg received the B.S. and M.S. degrees in biomedical engineering, with a focus in bioelectricity and neural engineering, from Case Western Reserve University, Cleveland, OH, in 2008.
Ms. Grinberg received the Biomedical Engineering Society (BMES) Undergraduate Student Design and Research Award for work investigating the effects of neural anatomy on computer models of neural excitation, in 2007. She is a member of the Biomedical Engineering Society, Alpha Eta Mu Beta, and Tau Beta Pi.
 Matthew A. Schiefer (S’02) received the B.E. degree in biomedical engineering from Vanderbilt University, Nashville, TN, in 2001 and the M.S. degree in biomedical engineering for work involving computer modeling of the effects of electrical stimulation on the human retina, in 2003, from Case Western Reserve University, Cleveland, OH, where he is currently working toward the Ph.D. degree in the Biomedical Engineering Department.
His research interests include neural modeling, finite element modeling, and restoration of function through electrical stimulation.
Mr. Schiefer was awarded an innovation incentive fellowship by Case Western Reserve University in conjunction with the Ohio Third Frontier project, in 2006 and 2007.
 Dustin J. Tyler (S’92–M’99) received the B.S. degree in electrical engineering from Michigan Technological University, Houghton, in 1992 and the Ph.D. degree in biomedical engineering from Case Western Reserve University, Cleveland, OH, in 1999.
From 1998 to 2002, he worked in research and development in the industrial sector designing functional electrical stimulation products for spinal cord injured and stroke patients. He joined the faculty of the Biomedical Engineering Department, Case Western Reserve University, as a tenure-track Assistant Professor in August 2004. He is also currently a Research Scientist at the Cleveland Functional Electrical Stimulation Center of Excellence and Associate Director of the Advanced Platform Technology Center of Excellence, both at the Cleveland Department of Veteran’s Affairs Medical Center.
 Kenneth J. Gustafson (M’07) received the B.S.E., M.S., and Ph.D. degrees in bioengineering from Arizona State University, Tempe, in 1991, 1995, and 1997, respectively. He completed a research fellowship in 1999 in the Department of Cardiac Surgery, California Pacific Medical Center, San Francisco.
He is currently an Assistant Professor in the Departments of Biomedical Engineering and Urology, Case Western Reserve University, Cleveland, OH, a Principal Investigator in the Cleveland FES Center, and a Research Scientist at the Cleveland Louis Stokes Veterans Affairs Medical Center. His research interests are in neural engineering and include the development and clinical application of neural prostheses to restore pelvic functions, neurophysiology and neural control of pelvic functions, and skeletal muscle power harnessing.
Dr. Gustafson is a member of the Biomedical Engineering Society and Alpha Eta Mu Beta. In 2002, he received an Excellence in Neural Engineering Award from the IEEE Engineering in Medicine and Biology Society and the Biomedical Engineering Society.
Footnotes
Hines, Moore, and Carnevale; http://www.neuron.yale.edu
References
- [1].Peckham PH, Knutson JS. Functional electrical stimulation for neuromuscular applications. Annu. Rev. Biomed. Eng. 2005;vol. 7:327–360. doi: 10.1146/annurev.bioeng.6.040803.140103. [DOI] [PubMed] [Google Scholar]
- [2].Leventhal DK, Durand DM. Subfascicle stimulation selectivity with the flat interface nerve electrode. Ann. Biomed. Eng. 2003;vol. 31:643–652. doi: 10.1114/1.1569266. [DOI] [PubMed] [Google Scholar]
- [3].Tyler DJ, Durand DM. Functionally selective peripheral nerve stimulation with a flat interface nerve electrode. IEEE Trans. Neural Syst. Rehabil. Eng. 2002 Dec.vol. 10(no. 4):294–303. doi: 10.1109/TNSRE.2002.806840. [DOI] [PubMed] [Google Scholar]
- [4].Tarler MD, Mortimer JT. Selective and independent activation of four motor fascicles using a four contact nerve-cuff electrode. IEEE Trans. Neural Syst. Rehabil. Eng. 2004 Jun.vol. 12(no. 2):251–257. doi: 10.1109/tnsre.2004.828415. [DOI] [PubMed] [Google Scholar]
- [5].Binnie CD. Vagus nerve stimulation for epilepsy: A review. Seizure. 2000;vol. 9:161–169. doi: 10.1053/seiz.1999.0354. [DOI] [PubMed] [Google Scholar]
- [6].Hansen M, Haugland M, Sinkjaer T, Donaldson N. Real time foot drop correction using machine learning and natural sensors. Neuromodulation. 2002;vol. 5:41–53. doi: 10.1046/j.1525-1403.2002._2008.x. [DOI] [PubMed] [Google Scholar]
- [7].Polasek KH, Hoyen HA, Keith MW, Tyler DJ. Human nerve stimulation thresholds and selectivity using a multi-contact nerve cuff electrode. IEEE Trans. Neural Syst. Rehabil. Eng. 2007 Mar.vol. 15(no. 1):76–82. doi: 10.1109/TNSRE.2007.891383. [DOI] [PubMed] [Google Scholar]
- [8].Creasey G, Elefteriades J, DiMarco A, Talonen P, Bijak M, Girsch W, Kantor C. Electrical stimulation to restore respiration. J. Rehabil. Res. Develop. 1996;vol. 33:123–132. [PubMed] [Google Scholar]
- [9].Deurloo KE, Holsheimer J, Bergveld P. Fascicular selectivity in transverse stimulation with a nerve cuff electrode: A theoretical approach. Neuromodulation. 2003;vol. 6:258–269. doi: 10.1046/j.1525-1403.2003.03034.x. [DOI] [PubMed] [Google Scholar]
- [10].Veltink PH, van Veen BK, Struijk JJ, Holsheimer J, Boom HB. A modeling study of nerve fascicle stimulation. IEEE Trans. Biomed. Eng. 1989 Jul.vol. 36(no. 7):683–692. doi: 10.1109/10.32100. [DOI] [PubMed] [Google Scholar]
- [11].Koole P, Holsheimer J, Struijk JJ, Verloop AJ. Recruitment characteristics of nerve fascicles stimulated by a multigroove electrode. IEEE Trans. Rehabil. Eng. 1997 Mar.vol. 5(no. 1):40–50. doi: 10.1109/86.559348. [DOI] [PubMed] [Google Scholar]
- [12].Choi AQ, Cavanaugh JK, Durand DM. Selectivity of multiple-contact nerve cuff electrodes: A simulation analysis. IEEE Trans. Biomed. Eng. 2001 Feb.vol. 48(no. 2):165–172. doi: 10.1109/10.909637. [DOI] [PubMed] [Google Scholar]
- [13].Meier JH, Rutten WL, Zoutman AE, Boom HB, Bergveld P. Simulation of multipolar fiber selective neural stimulation using in-trafascicular electrodes. IEEE Trans. Biomed. Eng. 1992 Feb.vol. 39(no. 2):122–134. doi: 10.1109/10.121643. [DOI] [PubMed] [Google Scholar]
- [14].Lertmanorat Z, Durand DM. Extracellular voltage profile for reversing the recruitment order of peripheral nerve stimulation: A simulation study. J. Neural Eng. 2004;vol. 1:202–211. doi: 10.1088/1741-2560/1/4/003. [DOI] [PubMed] [Google Scholar]
- [15].Hennings K, Arendt-Nielsen L, Christensen SS, Andersen OK. Selective activation of small-diameter motor fibres using exponentially rising waveforms: A theoretical study. Med. Biol. Eng. Comput. 2005;vol. 43:493–500. doi: 10.1007/BF02344731. [DOI] [PubMed] [Google Scholar]
- [16].Deurloo KE, Holsheimer J, Bergveld P. The effect of sub-threshold prepulses on the recruitment order in a nerve trunk analyzed in a simple and a realistic volume conductor model. Biol. Cybern. 2001;vol. 85:281–291. doi: 10.1007/s004220100253. [DOI] [PubMed] [Google Scholar]
- [17].Schiefer MA, Triolo RJ, Tyler DJ. A model of selective activation of the femoral nerve with a flat interface nerve electrode for a lower extremity neuroprosthesis. IEEE Trans. Neural Syst. Rehabil. Eng. 2008 Apr.vol. 16(no. 2):195–204. doi: 10.1109/TNSRE.2008.918425. [DOI] [PMC free article] [PubMed] [Google Scholar]
- [18].Meier JH, Rutten WL, Boom HB. Extracellular potentials from active myelinated fibers inside insulated and noninsulated peripheral nerve. IEEE Trans. Biomed. Eng. 1998 Sep.vol. 45(no. 9):1146–1153. doi: 10.1109/10.709558. [DOI] [PubMed] [Google Scholar]
- [19].Perez-Orive J, Durand DM. Modeling study of peripheral nerve recording selectivity. IEEE Trans. Rehabil. Eng. 2000 Sep.vol. 8(no. 3):320–329. doi: 10.1109/86.867874. [DOI] [PubMed] [Google Scholar]
- [20].Tesfayesus W, Yoo P, Moffitt M, Durand DM. Blind source separation of nerve cuff recordings. Proc. IEEE Eng. Med. Biol. Soc. Conf. 2004 Sep.vol. 1:95–98. doi: 10.1109/IEMBS.2004.1403099. [DOI] [PubMed] [Google Scholar]
- [21].Yoo PB, Durand DM. Selective recording of the canine hypoglossal nerve using a multicontact flat interface nerve electrode. IEEE Trans. Biomed. Eng. 2005 Aug.vol. 52(no. 8):1461–1469. doi: 10.1109/TBME.2005.851482. [DOI] [PubMed] [Google Scholar]
- [22].Rahal M, Taylor J, Donaldson N. The effect of nerve cuff geometry on interference reduction: A study by computer modeling. IEEE Trans. Biomed. Eng. 2000 Jan.vol. 47(no. 1):136–138. doi: 10.1109/10.817629. [DOI] [PubMed] [Google Scholar]
- [23].Sunderland S, Bradley KC. The perineurium of peripheral nerves. Anat. Rec. 1952;vol. 113:125–141. doi: 10.1002/ar.1091130202. [DOI] [PubMed] [Google Scholar]
- [24].Gustafson KJ, et al. Fascicular anatomy of the human femoral nerve: Implications for standing neural prostheses utilizing nerve cuff electrodes. Proc. 34th Annu. NIH Neural Prosthesis Workshop; 2003; [DOI] [PMC free article] [PubMed] [Google Scholar]
- [25].Stewart JD. Peripheral nerve fascicles: Anatomy and clinical relevance. Muscle Nerve. 2003;vol. 28:525–541. doi: 10.1002/mus.10454. [DOI] [PubMed] [Google Scholar]
- [26].Gustafson KJ, Zelkovic PF, Feng AH, Draper CE, Bodner DR, Grill WM. Fascicular anatomy and surgical access of the human pudendal nerve. World J. Urol. 2005;vol. 23:411–418. doi: 10.1007/s00345-005-0032-4. [DOI] [PubMed] [Google Scholar]
- [27].Gustafson KJ, Artis E. A comparative analysis of fundamental nerve fascicular anatomy: Physiological limits and implications for nerve cuff electrode design. presented at the NIH NINDS Neural Interfaces Workshop; Bethesda, MD. 2005. [Google Scholar]
- [28].Burkel WE. The histological fine structure of perineurium. Anat. Rec. 1967;vol. 158:177–189. doi: 10.1002/ar.1091580207. [DOI] [PubMed] [Google Scholar]
- [29].Lowry A, Wilcox D, Masson EA, Williams PE. Immunohis-tochemical methods for semiquantitative analysis of collagen content in human peripheral nerve. J. Anat. 1997;vol. 191(pt. 3):367–374. doi: 10.1046/j.1469-7580.1997.19130367.x. [DOI] [PMC free article] [PubMed] [Google Scholar]
- [30].Szlavik RB, de Bruin H. The effect of anisotropy on the potential distribution in biological tissue and its impact on nerve excitation simulations. IEEE Trans. Biomed. Eng. 2000 Sep.vol. 47(no. 9):1202–1210. doi: 10.1109/10.867947. [DOI] [PubMed] [Google Scholar]
- [31].Garven HS, Gairns FW, Smith G. The nerve fibre populations of the nerves of the leg in chronic occlusive arterial disease in man. Scott. Med. J. 1962;vol. 7:250–265. doi: 10.1177/003693306200700602. [DOI] [PubMed] [Google Scholar]
- [32].Behse F. Morphometric studies on the human sural nerve. Acta Neurol. Scand. Suppl. 1990;vol. 132:1–38. [PubMed] [Google Scholar]
- [33].McIntyre CC, Richardson AG, Grill WM. Modeling the excitability of mammalian nerve fibers: Influence of afterpotentials on the recovery cycle. J. Neurophysiol. 2002;vol. 87:995–1006. doi: 10.1152/jn.00353.2001. [DOI] [PubMed] [Google Scholar]
- [34].Richardson AG, McIntyre CC, Grill WM. Modelling the effects of electric fields on nerve fibres: Influence of the myelin sheath. Med. Biol. Eng. Comput. 2000;vol. 38:438–446. doi: 10.1007/BF02345014. [DOI] [PubMed] [Google Scholar]
- [35].Vuckovic A, Struijk JJ, Rijkhoff NJ. Influence of variable nerve fibre geometry on the excitation and blocking threshold. A simulation study. Med. Biol. Eng. Comput. 2005;vol. 43:365–374. doi: 10.1007/BF02345814. [DOI] [PubMed] [Google Scholar]
- [36].Goodall EV, Kosterman LM, Holsheimer J, Struijk JJ. Modeling study of activation and propagation delays during stimulation of peripheral nerve fibers with a tripolar cuff electrode. IEEE Trans. Rehabil. Eng. 1995 Sep.vol. 3:272–282. [Google Scholar]
- [37].Grill WM., Jr. Modeling the effects of electric fields on nerve fibers: Influence of tissue electrical properties. IEEE Trans. Biomed. Eng. 1999 Aug.vol. 46(no. 8):918–928. doi: 10.1109/10.775401. [DOI] [PubMed] [Google Scholar]