

Summary
Objective
To assess vitamin D status and the influences of race, sun exposure and dietary vitamin D intake on vitamin D levels, and to evaluate two vitamin D repletion regimens in extremely obese patients awaiting bariatric surgery.
Methods
A cross-sectional analysis of dietary vitamin D, sun exposure, PTH [intact (iPTH) and PTH(1-84)] and 25-hydroxyvitamin D (25OHD; differentiated 25OHD2 and 25OHD3) in 56 obese [body mass index (BMI) > 35 kg/m2] men and women (age 20–64 years). In a pilot clinical trial, 27 subjects with 25OHD levels < 62 nmol/l were randomized to receive ergocalciferol or cholecalciferol for 8 weeks.
Results
Serum 25OHD was low (mean 45 ± 22 nmol/l) and was inversely associated with BMI (r = − 0.36, P < 0.01). Each BMI increase of 1 kg/m2 was associated with a 1.3 nmol/l decrease in 25OHD (P < 0.01). BMI, sun exposure, African American race and PTH predicted 40% of the variance in 25OHD (P < 0.0001). Serum 25OHD significantly increased at 4 and 8 weeks in both treatment groups (P < 0.001), whereas PTH(1-84) declined significantly in subjects treated with cholecalciferol (P < 0.007) and tended to decrease following ergocalciferol (P < 0.09).
Conclusions
In severely obese individuals, those who are African American, have higher BMI and limited sunlight exposure are at greatest risk for vitamin D insufficiency. These demographic factors can help to identify at-risk patients who require vitamin D repletion prior to bariatric surgery. Commonly prescribed doses of ergocalciferol and cholecalciferol are effective in raising 25OHD. Further investigation is needed to evaluate whether these regimens have differential effects on PTH, and to determine the optimal regimen for vitamin D repletion in the extremely obese patient.
Introduction
Vitamin D deficiency in the obese has been well documented1–7 but poorly characterized. Studies documenting an inverse relationship between vitamin D concentrations and obesity have typically included populations with wide ranges of adiposity, and few have focused specifically on the extremely obese.6–8 This group is important because of its burgeoning numbers9,10 and high mortality rates.11–13 Additionally, several studies have described marked vitamin D deficiency in extremely obese patients following bariatric surgery14–16 and vitamin D deficiency that antedates such intervention may exacerbate this condition.
In addition to the well-known skeletal effects of vitamin D deficiency, such as secondary hyperparathyroidism, bone loss and fracture, recent data support an indirect effect on bone through increased muscle weakness and falls.17,18 Moreover, evidence of non-skeletal associations of vitamin D deficiency, such as insulin resistance, diabetes mellitus, hypertension and malignancy,19,20 makes recognition and treatment of this problem even more important in the obese population already at risk for these diseases.
The inverse association between 25-hydroxyvitamin D (25OHD) concentrations and adiposity1–5,8,21–24 is accompanied by elevations in PTH. Although most studies suggest that this elevation is secondary to vitamin D deficiency, an independent association between PTH and obesity has also been reported.23,24 Several putative factors have been proposed to account for low vitamin D concentrations in severe obesity, including inadequate dietary intake of foods and supplements containing vitamin D,5,25 limited sunlight exposure,4 and decreased bioavailability of vitamin D secondary to sequestration of the fat-soluble vitamin in excess adipose tissue.3 Following bariatric surgery, vitamin D insufficiency is common14–16 and 25OHD levels often do not improve, despite significant increases in vitamin D intake. Preoperative vitamin D insufficiency may place patients at greater risk for this problem.
The optimal method for treating vitamin D insufficiency in obese patients is not known. These patients may require higher doses than normal-weight patients because of differences in absorption, volume of distribution and metabolism. The two commonly used vitamin D preparations are ergocalciferol (D2) and cholecalciferol (D3). Recent studies comparing the two regimens in normal-weight subjects have had conflicting results. Cholecalciferol has been shown to have greater potency in some,26–28 but not all,29 studies. The efficacy of these two forms of vitamin D has never been examined in an extremely obese group.
This study was designed to (1) evaluate the vitamin D status of severely obese patients before the confounding influence of bariatric surgery, and to assess the influence of factors with demonstrated importance to vitamin D status in normal-weight individuals; and (2) evaluate the efficacy of two preoperative vitamin D repletion regimens in a pilot study of patients awaiting bariatric surgery.
Methods
Subjects
Subjects were recruited at the time of presentation requesting weight-loss surgery from the Weight-Loss Surgery Program at Weill Cornell New York Presbyterian Hospital. Eligible subjects were men and women between the ages of 18 and 65 years who had BMI measurements > 40 kg/m2 or had obesity-related comorbidities and a body mass index (BMI) ≥ 35 kg/m2. Subjects were excluded if they had hypercalcaemia, renal insufficiency (creatinine > 133 μmol/l), hepatic disease, malabsorption, history of metabolic bone disease, human immunodeficiency virus, medical conditions requiring daily calcium supplementation or antacid use, or were using medication known to alter bone metabolism (specifically glucocorticoids and bisphosphonates). Subjects taking medications known to interact with vitamin D or with known hypersensitivity to ergocalciferol or cholecalciferol were also excluded. The Weill Cornell Medical College Institutional Review Board approved this study, and all participants provided written informed consent.
Study design
A cross-sectional analysis was conducted of obese subjects who presented as potential bariatric surgery candidates. Subjects were enrolled over a consecutive 14-month period. Approximately 25% of eligible subjects agreed to participate (most common reason for refusal: extra trips to the hospital). All visits were conducted in the General Clinical Research Center of Weill Cornell Medical College. At the initial study visit, a medical history, demographic information and anthropometric data (height, weight and BMI) were obtained. Dietary calcium and vitamin D were assessed using a modified version of the Block food-frequency questionnaire, which included questions on food sources containing calcium and vitamin D, such as dairy products and fish, as well as specific questions about multivitamins, calcium, vitamin D and other supplements. Sunlight exposure was assessed using a tool adapted from Hodkinson et al.30 and Lips et al.31 designed to elicit information about the amount of sunlight exposure that a subject received in a typical week. Information collected included the amount of time spent in the sunlight in a typical week (< 20 min, between 20 min and 1 h, > 1 h daily), the type of clothing worn (short sleeves, shorts, hats), sunscreen use, recent travel and season. Baseline scores range from 0 for a homebound person who is never in the sun to 24 for a person who is in the sun for more than 1 h at least three times a week during the summer months. Additional points were given for travel to lower latitudes in the previous month, based upon location and duration of visit. Serum was collected for measurement of calcium, albumin and creatinine, 25OHD, 1,25-dihydroxyvitamin D3 [1,25(OH)2D3] and PTH.
Subjects who were found to have 25OHD levels < 62 nmol/l and who were interested in further study participation were enrolled in an open-label prospective randomized trial comparing ergocalciferol 50 000 IU (Drisdol®; Sanofi-Aventis, Bridgewater, NJ) or cholecalciferol 8000 IU (Weil® Vitamin D3, 1000 IU tablets; Weil Nutritionals, Phoenix, AZ) weekly, for 8 weeks. These doses were selected because they are used in our clinical practice to replete vitamin D deficiency/insufficiency. Subjects returned for 4- and 8-week follow-up visits, when the above assays were repeated, questionnaires administered, and medication compliance assessed by pill counts. Subjects were queried for adverse events at each follow-up visit. Criteria for discontinuation of study drug were serum calcium concentration > 2.75 mmol/l or 25OHD levels > 175 nmol/l. Subjects who participated in the longitudinal study were asked not to take any additional supplements during the study period.
Assays
Serum calcium, albumin and creatinine were measured using automated techniques. PTH levels were assessed using both an intact PTH assay (iPTH) and an assay for PTH(1-84) that detects only the entire PTH peptide and does not cross-react with circulating PTH fragments. Serum for PTH(1-84) was measured by Scantibodies Laboratory (Santee, CA, USA) using a manual 125I two-site immuno-radiometric assay (IRMA) [normal range 5–39 ng/l; interassay coefficient of variation (CV) 5.0%]. Intact PTH was measured using the Immulite® ‘intact PTH’ assay (Siemens Medical Solutions Diagnostics; normal range 9–44 ng/l; interassay CV 8.6%). 1,25(OH)2D3 was measured by radioimmunoassay (Immunodiagnostics Systems; normal range 48–150 pmol/l; interassay CV 14.5%). Serum for 25OHD was analysed at the Mayo Clinic Core Laboratory (Rochester, MN, USA) by liquid chromatography–tandem mass spectroscopy, a technique described previously.32 This method was chosen to allow us to measure possible differences in 25OHD2 and 25OHD3. In addition, this assay allowed us to avoid the variability in serum 25OHD results that has been reported with several commonly used clinical assays.33 Sera for PTH(1-84), 25OHD and 1,25(OH)2D3 were aliquoted, stored at −20 °C and analysed in batches.
Statistical analysis
Analyses were conducted with STATA version 9.0 (Stata Corp., College Station, TX) and SAS version 9.1 (SAS Institute Inc., Cary, NC). Two-sided P-values < 0.05 were considered to indicate statistical significance. Data are presented as mean ± SD except where otherwise noted. Spearman correlation analyses were performed to test associations between variables of interest, as the majority had non-normal distributions. Significant correlations were evaluated using partial correlation analyses to assess for effect modification and confounding by additional variables. Variables that were found to be significantly associated with 25OHD in univariate analysis (P < 0.05) were entered into a step-wise regression model. For the prospective study, randomization was unstratified and unblocked. Primary comparisons were made between baseline and week 8 in treated subjects. A t-test was carried out to determine whether there was a difference in the change in levels of the parameters of interest (PTH and 25OHD). Within-subjects changes were also analysed using a paired t-test to determine whether each supplement resulted in a change in serum levels. For pair-wise comparisons, P-values < 0.01 were considered significant.
Results
Cross-sectional study
We enrolled 56 patients (mean age 39 years; range 28–64 years) awaiting bariatric surgery. The group included 42 women (75%) and 14 men (25%). This gender distribution is not significantly different from the general population receiving bariatric procedures at our institution.34 Twenty-four (43%) were Caucasian, 21 (38%) were Hispanic, 10 (18%) were African American, and one (2%) was Asian. Characteristics of the study population are summarized in Table 1. Mean BMI (46 ± 7 kg/m2) was in the extremely obese (class 3) range (35–65 kg/m2). The subjects had normal calcium concentrations and renal function according to inclusion criteria.
Table 1.
Patient characteristics (n = 56) and correlation with 25OHD
| Variable* | Mean ± SD | Correlation with 25OHD† | |
|---|---|---|---|
| r | P | ||
| Age (years) | 39 ± 12 | 0.07 | 0.59 |
| Sex (Female : Male) | 42 : 14 (3 : 1) | −0.15 | 0.29 |
| Ethnicity (% African American) | 18% | −0.35 | < 0.01 |
| BMI (kg/m2) | 47.5 ± 6.8 | −0.36 | < 0.01 |
| Vitamin D intake (IU/day) | 234 ± 188 | 0.21 | 0.12 |
| Calcium intake (mg/day) | 742 ± 433 | 0.17 | 0.21 |
| Sun Score | 14.8 ± 8.5 | 0.33 | 0.02 |
| Serum calcium‡ (2.1–2.6 mmol/l) | 2.3 ± 0.1 | −0.13 | 0.36 |
| Serum creatinine (44–133 μmol/l) | 70.7 ± 17.7 | −0.03 | 0.82 |
| iPTH (9–44 ng/l) | 72.0 ± 33.6 | −0.46 | < 0.001 |
| PTH(1–84) (5–39 ng/l) | 25.7 ± 10.6 | −0.48 | < 0.001 |
| Total 25OHD (62–200 nmol/l) | 44.9 ± 22.0 | – | – |
| 25OHD3 (nmol/l) | 43.2 ± 21.0 | 0.95 | < 0.001 |
| 25OHD2 (nmol/l) | < 10.0 | 0.09 | 0.53 |
Normal ranges presented in parentheses for serum measurements. No normative data are available for 25OHD2 and 25OHD3. Lower limit of diction for both assays is nmol/l.
r (Spearman correlation coefficient) and P-values presented for the association between each variable and total 25OHD concentration in univariate analysis. Variables with significant correlations are in boldface.
Calcium values are corrected for serum albumin.
Vitamin D status
Mean concentrations of 25OHD (45 ± 22 nmol/l) were below the assay normal range (62–200 nmol/l; Fig. 1) and consisted almost exclusively of 25OHD3 (43 ± 21 nmol/l, 25OHD2 < 10 nmol/l). Frank vitamin D deficiency (25OHD ≤ 25 nmol/l) was found in 20% of subjects whereas the vast majority had concentrations lower than those considered to represent vitamin D sufficiency (85% below 75 nmol/l and 65% below 50 nmol/l). Serum 25OHD was negatively associated with BMI (r = −0.36, P < 0.01; Fig. 2), a relationship that persisted after controlling for PTH (r = −0.32, P = 0.02). As expected, a significant inverse relationship was observed between PTH and 25OHD (r = −0.42, P < 0.01); this relationship persisted with separate analysis of the association between PTH and 25OHD3 (r = −0.41, P < 0.01). This association was not seen with 25OHD2 (r = −0.15, P = 0.28), probably because the 25OHD2 concentrations were undetectable in 89% of subjects.
Fig. 1.
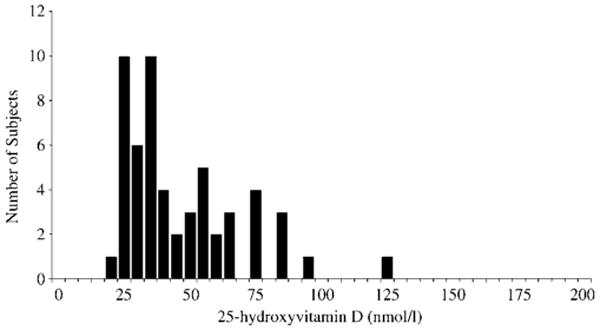
The distribution of 25-hydroxyvitamin D (25OHD) serum concentrations in 56 extremely obese men and women.
Fig. 2.
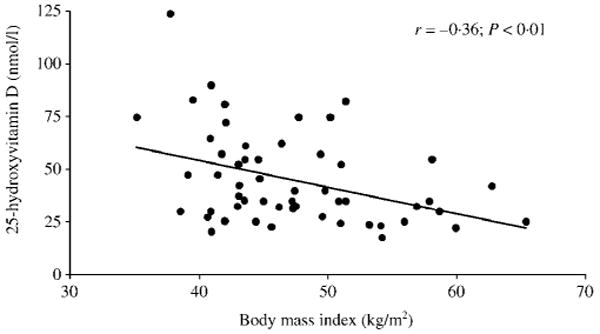
The association [Spearman correlation coefficient (r)] between 25-hydroxyvitamin D (25OHD) concentration and body mass index (BMI).
Low 25OHD concentrations were particularly prevalent among African American subjects. Concentrations below 75 nmol/l were found in all African American subjects compared to 78% of subjects from other ethnicities (Caucasian, Hispanic and Asian). Concentrations below 50 nmol/l were found in 90% of African American subjects compared to 51% of non-African Americans. African American race was independently associated with decreased 25OHD levels (r = −0.35, P < 0.01). Partial correlation analysis revealed that this difference was not mediated by BMI. This cohort was analysed in a manner similar to that used in the Third National Health and Nutrition Examination Survey (NHANES III) database comparing African American and Caucasian subjects using a 25OHD cut-off of 37.5 nmol/l to describe a vitamin D-deficient population.35 While the obese individuals were much more likely to have low concentrations of 25OHD regardless of racial background, African Americans were nearly twice as likely to have deficient concentrations (80%) than Caucasian obese individuals (43%).
Concentrations of 25OHD were associated with sunlight exposure; this relationship was demonstrated most strongly by the association between Sun Score and 25OHD3 (r = 0.41, P = 0.002; Fig. 3) but also with total 25OHD (r = 0.33, P = 0.02). There was evidence of seasonal variation in 25OHD concentrations, with significantly higher mean concentrations measured in summer months (June, July, August) compared with other seasons (summer: 57 ± 16 nmol/l vs. nonsummer: 41 ± 23 nmol/l; P = 0.02).
Fig. 3.
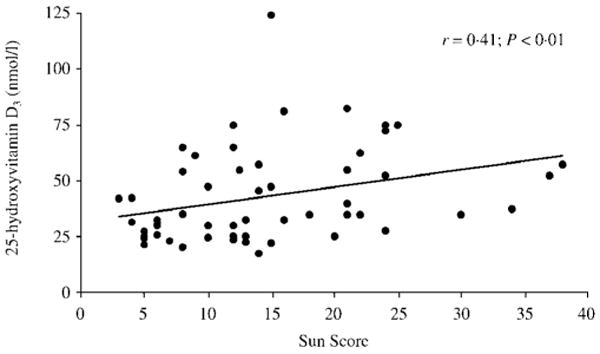
The association [Spearman correlation coefficient (r)] between 25-hydroxyvitamin D3 (25OHD3) concentration and sunlight exposure (Sun Score).
In these patients, dietary intake of vitamin D from food sources and supplements tended to be low (mean 234 IU), although it was highly variable, ranging from 16 to 867 IU daily. There was no association between BMI and dietary intake of calcium (r = −0.07, P = 0.6) or vitamin D (r = −0.03, P = 0.9). Greater dietary intake of vitamin D tended to be associated with higher 25OHD (r = 0.21, P = 0.12). Similarly, subjects who were already taking vitamin D supplements at the time of presentation (n = 11; 20%) tended to have higher 25OHD concentrations than those who did not (55 ± 31 nmol/l in supplement users vs. 42 ± 18 nmol/l in nonusers; P = 0.07). Of the subjects reporting daily use of supplements (mean dose: 400 ± 94 IU/day), seven were using supplements containing D3 and four containing D2. Concentrations of 25OHD2 were measurable in all subjects who reported using supplements containing D2. By contrast, use of D3-containing supplements was not associated with 25OHD3 concentrations. Age, corrected calcium and renal function did not significantly influence serum 25OHD (data not shown). When the above analyses were restricted to the largest subgroups (Women, Caucasians, Hispanics), the findings did not significantly differ (Table 2).
Table 2.
Correlation between 25OHD and patient characteristics among women, Caucasian and Hispanic subjects
| Variable | Overall group (n = 56) |
Women (n = 42) |
Caucasians (n = 24) |
Hispanics (n = 21) |
||||
|---|---|---|---|---|---|---|---|---|
| r | P | r | P | r | P | r | P | |
| BMI (kg/m2) | −0.36 | < 0.01 | −0.35 | 0.03 | −0.41 | 0.06 | −0.35 | 0.12 |
| Vitamin D intake (IU/d) | 0.21 | 0.12 | 0.21 | 0.18 | 0.40 | 0.07 | −0.07 | 0.76 |
| Sun Score | 0.33 | 0.02 | 0.32 | 0.04 | 0.35 | 0.10 | 0.54 | 0.01 |
| iPTH (ng/l) | −0.46 | < 0.001 | −0.48 | 0.002 | −0.49 | 0.02 | −0.61 | 0.003 |
| PTH(1-84) (ng/l) | −0.48 | < 0.001 | −0.46 | 0.002 | −0.44 | 0.03 | −0.65 | 0.001 |
All putative risk factors for vitamin D insufficiency found to be significant predictor variables of 25OHD from the univariate analysis (Table 1; BMI, African American race, Sun Score, and PTH) were entered into a stepwise regression model, and were found to predict 40% of the overall variance in 25OHD (overall model: P < 0.0001). In this model, PTH was most closely associated with 25OHD. However, because low concentrations of 25OHD are known to lead to elevations of PTH, a second model was created excluding PTH. This multivariate model (including BMI, African American race, and Sun Score, but not PTH) predicted 26% of the overall variance in 25OHD (overall model: P < 0.002). BMI was the strongest predictor of 25OHD; each increase in BMI of 1 kg/m2 was associated with a decrease of 1.3 nmol/l in 25OHD (P < 0.01).
Hyperparathyroidism
Elevated iPTH concentrations were found in the majority of subjects (75%) and, as mentioned above, were associated with the degree of vitamin D deficiency. Although hyperparathyroidism tended to be associated with BMI (r = 0.25, P = 0.07), this relationship did not persist after controlling for 25OHD (r = 0.05, P = 0.71). The same associations were observed with the more specific PTH(1-84) assay as with iPTH, although the mean values were within the normal range and only 11% of subjects had elevated values using this assay.
Longitudinal pilot study of ergocalciferol and cholecalciferol treatment
Twenty-seven of the 39 eligible subjects with 25OHD levels below 62 nmol/l agreed to participate in the longitudinal component of the study. Those who participated did not differ from those who did not by gender, ethnicity, age, BMI, 25OHD or PTH levels. Baseline levels of vitamin D and PTH were not different in those randomized to ergocalciferol 50 000 IU or cholecalciferol 8000 IU weekly (Table 3). Levels of 25OHD significantly increased from baseline in both treatment groups (P < 0.001). Although the increase in 25OHD level was greater in the ergocalciferol group compared to the cholecalciferol group (131% vs. 57%), PTH(1-84) significantly declined in the cholecalciferol-treated group (from 31.9 ± 2 to 24.0 ± 3 ng/l; P < 0.007) while only trending downwards in response to ergocalciferol (from 28.1 ± 3 to 22.3 ± 2 pg/ml; P < 0.09). The percentage change in PTH(1-84) did not differ between treatment groups (−21% with D3 and −12% with D2; P = 0.55). Intact PTH concentrations did not change significantly over the study duration. In ergocalciferol-treated subjects, serum 25OHD3 levels declined as 25OHD2 levels rose significantly over the 8-week treatment period (P < 0.001 for both comparisons). Levels of 25OHD3, which decreased in all subjects in the ergocalciferol-treatment group, decreased on average by 56%. By contrast, in subjects treated with cholecalciferol, 25OHD3 rose significantly (P < 0.0001) and 25OHD2 remained unchanged (Fig. 4). Subjects' dietary intake of calcium and vitamin D, amount of sun exposure and serum calcium and 1,25(OH)2D3 levels did not change significantly over the course of the study, nor did they differ between groups.
Table 3.
Longitudinal changes in PTH and 25OHD with vitamin D supplementation (mean ± SEM). There were no differences among groups randomized to the two treatment arms at baseline
| Assay | Cholecalciferol (D3) | Ergocalciferol (D2) | ||||
|---|---|---|---|---|---|---|
| Week 0 | Week 4 | Week 8 | Week 0 | Week 4 | Week 8 | |
| iPTH (ng/l) | 91 ± 10 | 90 ± 9 | 76 ± 6 | 77 ± 10 | 89 ± 7 | 72 ± 6 |
| PTH [1-84] (ng/l) | 31.9 ± 2 | 25.8 ± 2 | 24.0 ± 3** | 28.1 ± 3 | 26.9 ± 2 | 22.3 ± 2 |
| 25OHD total (nmol/l) | 37.8 ± 5 | 54.4 ± 3* | 59.0 ± 5* | 33.9 ± 3 | 68.7 ± 5* | 78.2 ± 5* |
| 25OHD2 (nmol/l) | < 10.0 | < 10.0 | < 10.0 | < 10.0 | 47.4 ± 5* | 64.2 ± 5* |
| 25OHD3 (nmol/l) | 36.7 ± 5 | 54.4 ± 3* | 59.0 ± 5* | 13.6 ± 3 | 8.5 ± 3* | 5.6 ± 0.5* |
| 1,25(OH)2D3 (pmol/l) | 121 ± 17 | 100 ± 7 | 123 ± 23 | 120 ± 24 | 187 ± 10 | 187 ± 23 |
For comparisons to values at week 0:
P < 0.001;
P < 0.01.
Fig. 4.
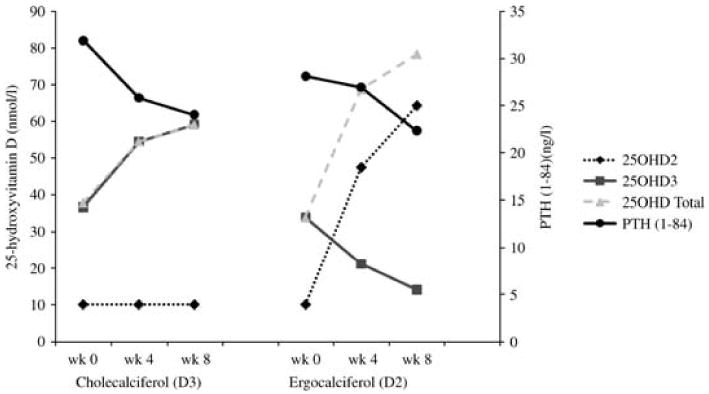
Changes in 25OHD2, 25OHD3, total 25OHD and PTH with cholecalciferol (D3) and ergocalciferol (D2) treatment.
Compliance rates were similar between the groups; 12/12 subjects in the ergocalciferol group and 12/13 in the cholecalciferol group had > 80% compliance. No subject complained of any adverse symptoms. No subject had evidence of hypercalcaemia or any other laboratory abnormality during the study. Two subjects in the ergocalciferol group dropped out of the study after their 4-week follow-up visit because their surgery was scheduled prior to protocol completion.
Discussion
This study confirms and extends previously available information on the widespread vitamin D insufficiency among the extremely obese, and provides new data on demographic and lifestyle factors that help to determine the extent of this deficiency, as well as potential treatment options. Supplementation with both ergocalciferol and cholecalciferol significantly improved 25OHD levels in extremely obese subjects awaiting bariatric surgery. Our use of specific measurement techniques for 25OHD and PTH allowed us to capture subtle changes in the hormones that occurred with vitamin D supplementation.
Vitamin D insufficiency was pervasive prior to bariatric surgical intervention in our cohort. BMI itself proved to be one of the most important determinants of 25OHD concentrations; subjects with higher BMIs were more vitamin D deficient. Furthermore, we found that 25OHD concentrations in this population were influenced by African American racial background and sun exposure. We did not find that dietary vitamin D intake significantly affected 25OHD concentration, although the almost uniformly low intakes in our moderately sized sample may have limited our ability to detect an effect.
The relationship between vitamin D status, sun exposure and dietary intake has been examined in several studies combining subjects with different body weights.4,5,21,23,25,35–37 To our knowledge, the specific effects of these factors have not been assessed in a population that is uniformly extremely obese. In a population-based study of nonobese subjects, BMI, total body fat percentage and sum of skinfolds were significantly associated with low 25OHD and high PTH.23 In that study, in which subjects were elderly and the majority were lean, the associations between 25OHD and PTH with BMI were independent of one another. In marked contrast, we found the association between PTH and BMI to be mediated by 25OHD, suggesting that the hyperparathyroidism seen in extremely obese subjects is largely secondary to vitamin D insufficiency. However, this finding does not exclude a potential role for hyperparathyroidism in the interaction of vitamin D deficiency and obesity, in which the excess PTH could promote further weight gain by enhancing lipogenesis.23,38
Racial background influenced 25OHD concentrations in these extremely obese subjects, with African American subjects more likely to have low vitamin D concentrations. This finding again extends those of studies in populations of varying adiposity.21,39 A comparison of the prevalence of low levels of 25OHD across racial groups between our extremely obese cohort and a normal-weight cohort from the NHANES population-based study35 is striking both for the increased prevalence of vitamin D deficiency in the obese regardless of race and for the extremely high proportion of extremely obese African American individuals with low vitamin D levels (25OHD < 37.5 nmol/l: in extremely obese African American 80% vs. Caucasian 43%; in NHANES normal-weight women African American 42% vs. Caucasian 4%).
We found that decreased sun exposure, long hypothesized to contribute to the vitamin D deficiency of the obese, did indeed have a significant influence on 25OHD concentrations. Evidence for this came from several sources. First, we found a significant association between Sun Score and 25OHD concentrations. In a population of elderly adults that included subjects of varying weights, sun exposure habits did not vary according to adiposity and did not significantly influence 25OHD concentrations.37 A recent study of Swedish women between the ages of 61 and 86 years found no relationship between everyday sun exposure habits and 25OHD concentrations in the winter, although recent travel to a location with greater ultraviolet (UV) exposure was associated with increased 25OHD.40 Our finding that disparate amounts of sun exposure are associated with differing concentrations of 25OHD may be explained by the homogeneity of our population in terms of age and adiposity. Although there are data suggesting that, with equivalent UVB exposure, the synthesis of 25OHD is decreased in obese compared with normal-weight subjects,3 this report demonstrates that sun exposure can be a crucial source of vitamin D in this population. The data demonstrating higher 25OHD concentrations of subjects enrolled in the summer provides further, albeit inferential, support for the association of sun exposure and vitamin D levels in the extremely obese. Interpretation of the data is limited because the study is cross-sectional, and must be confirmed in a longitudinal study. Finally, the finding that the total 25OHD concentration in these subjects almost exclusively comprised 25OHD3 provides further evidence that vitamin D from sun exposure is a major contributor to total 25OHD in this population. 25OHD2 concentrations were undetectable in the vast majority of subjects, most probably because of low intake.
Our small pilot longitudinal study assessed the efficacy of the two regimens used to treat patients with vitamin D insufficiency prior to bariatric surgery in our institution. Reports that cholecalciferol is more potent than ergocalciferol26,27 guided our decision to use a lower dose of cholecalciferol. Although the different doses preclude any direct comparison of ergocalciferol and cholecalciferol, the data raise some interesting issues. The decline in PTH was similar with both treatment regimens despite an ergocalciferol dose 6.6 times higher than that of cholecalciferol, raising the possibility that the suppressive effects of cholecalciferol on PTH may be greater than that of ergocalciferol in this population. It is also possible that 25OHD levels alone may not accurately reflect vitamin D sufficiency in obese subjects. A study comparing equivalent doses (300 000 IU) of cholecalciferol and ergocalciferol found that only cholecalciferol significantly reduced iPTH.28 These findings, together with ours, suggest that in patients being treated for vitamin D deficiency, PTH may be a more physiologically relevant measure of calcium homeostasis.
Serum 25OHD3 concentrations have been shown to be suppressed after administration of ergocalciferol in some,26,41 but not all,29 recent studies. This observation has been reported in studies using high doses of ergocalciferol (50 000 IU), as in our study. If verified in larger populations, this finding could provide additional support for the preferential use of cholecalciferol for vitamin D repletion. It is also possible that 25OHD2 concentrations decreased in the cholecalciferol-treated group but that this change was obscured because baseline levels of 25OHD2 were already below the lower limit of detection of the assay.
Heaney et al. demonstrated that 25OHD increase by approximately 1 ng/ml (2.5 nmol/l) for every 100 IU of daily cholecalciferol intake in normal-weight subjects, at steady state.42 Whether obese subjects respond to oral vitamin D in a fashion similar to normal-weight subjects is unclear. Peak serum vitamin D2 correlated inversely with BMI after administration of 50 000 IU of vitamin D2.3 After 8 weeks of cholecalciferol, Barger-Lux et al. found that the increase in 25OHD was decreased in those subjects with higher body weights, and that BMI significantly contributed to the variance in 25OHD response to supplementation.43 By contrast, another recent study found that body fat percentage did not affect the rise in 25OHD levels after supplementation in a group with a range of adiposities.44 Our subjects who were treated with cholecalciferol 8000 IU weekly, or approximately 1150 IU daily, had a mean rise in 25OHD of 21.2 nmol/l over the 8-week study, slightly below but in the same range as the 28.75 nmol/l change predicted by Heaney et al.42
Limitations of this study include the moderate sample size, lack of a nonobese control group, the wide variations in vitamin D intake and potential inaccuracies in the methods used to assess dietary intakes of calcium and vitamin D and sunlight exposure. Self-reported intake may be inaccurate and tends to underestimate consumption. Quantification of sun exposure with a UV detector would have been more accurate than our questionnaire method. Despite these limitations, this report highlights the widespread prevalence of vitamin D insufficiency and deficiency among the extremely obese prior to bariatric surgery, and provides evidence that these conditions can be treated effectively. Many of the same factors are important in determining vitamin D status in obese and normal-weight individuals. Similar to the general population, obese patients living at latitude 40°N are at particular risk for vitamin D insufficiency during seasons when sun exposure is low. Encouragingly, when exposed to sufficient sunlight some were able to synthesize adequate amounts of 25OHD, and in those individuals dietary sources of vitamin D seemed to play a less important role.
In conclusion, within an extremely obese sample, those who are most overweight, African American, and who have limited sunlight exposure are most likely to be vitamin D insufficient. Although many of these risk factors are not easily modifiable, they can be used to identify the patients at greatest risk for vitamin D deficiency, who might benefit from repletion prior to bariatric surgery. While commonly prescribed preparations of ergocalciferol and cholecalciferol are effective in raising 25OHD, cholecalciferol may be more effective in lowering PTH in these patients. As the most commonly performed bariatric procedure is known to lead to vitamin D malabsorption, further investigation is urgently needed to determine the optimal regimen for vitamin D repletion prior to surgery in extremely obese individuals.
Acknowledgments
This work was supported by WMC GCRC M01 RR00047, and a Clinical Research Feasibility Funds (CreFF) Award, awarded to Dr Stein by the Weill Cornell GCRC. Dr Silverberg is supported in part by K24DK74457. Clinical Trials.gov identifier NCT00288873.
References
- 1.Bell NH, Epstein S, Greene A, et al. Evidence for alteration of the vitamin D–endocrine system in obese subjects. Journal of Clinical Investigation. 1985;76:370–373. doi: 10.1172/JCI111971. [DOI] [PMC free article] [PubMed] [Google Scholar]
- 2.Liel Y, Ulmer E, Shary J, et al. Low circulating vitamin D in obesity. Calcified Tissue International. 1988;43:199–201. doi: 10.1007/BF02555135. [DOI] [PubMed] [Google Scholar]
- 3.Wortsman J, Matsuoka LY, Chen TC, et al. Decreased bioavailability of vitamin D in obesity. American Journal of Clinical Nutrition. 2000;72:690–693. doi: 10.1093/ajcn/72.3.690. [DOI] [PubMed] [Google Scholar]
- 4.Compston JE, Vedi S, Ledger JE, et al. Vitamin D status and bone histomorphometry in gross obesity. American Journal of Clinical Nutrition. 1981;34:2359–2363. doi: 10.1093/ajcn/34.11.2359. [DOI] [PubMed] [Google Scholar]
- 5.Hypponen E, Power C. Hypovitaminosis D in British adults at age 45 y: nationwide cohort study of dietary and lifestyle predictors. American Journal of Clinical Nutrition. 2007;85:860–868. doi: 10.1093/ajcn/85.3.860. [DOI] [PubMed] [Google Scholar]
- 6.Flancbaum L, Belsley S, Drake V, et al. Preoperative nutritional status of patients undergoing Roux-en-Y gastric bypass for morbid obesity. Journal of Gastrointestinal Surgery. 2006;10:1033–1037. doi: 10.1016/j.gassur.2006.03.004. [DOI] [PubMed] [Google Scholar]
- 7.Carlin AM, Rao DS, Meslemani AM, et al. Prevalence of vitamin D depletion among morbidly obese patients seeking gastric bypass surgery. Surgery for Obesity and Related Diseases. 2006;2:98–103. doi: 10.1016/j.soard.2005.12.001. [DOI] [PubMed] [Google Scholar]
- 8.Hamoui N, Anthone G, Crookes PF. Calcium metabolism in the morbidly obese. Obesity Surgery. 2004;14:9–12. doi: 10.1381/096089204772787211. [DOI] [PubMed] [Google Scholar]
- 9.Flegal KM. Epidemiologic aspects of overweight and obesity in the United States. Physiology and Behavior. 2005;86:599–602. doi: 10.1016/j.physbeh.2005.08.050. [DOI] [PubMed] [Google Scholar]
- 10.Ogden CL, Carroll MD, Curtin LR, et al. Prevalence of overweight and obesity in the United States, 1999–2004. Journal of the American Medical Association. 2006;295:1549–1555. doi: 10.1001/jama.295.13.1549. [DOI] [PubMed] [Google Scholar]
- 11.Flegal KM, Graubard BI, Williamson DF, et al. Excess deaths associated with underweight, overweight, and obesity. Journal of the American Medical Association. 2005;293:1861–1867. doi: 10.1001/jama.293.15.1861. [DOI] [PubMed] [Google Scholar]
- 12.Adams KF, Schatzkin A, Harris TB, et al. Overweight, obesity, and mortality in a large prospective cohort of persons 50–71 years old. New England Journal of Medicine. 2006;355:763–778. doi: 10.1056/NEJMoa055643. [DOI] [PubMed] [Google Scholar]
- 13.McTigue K, Larson JC, Valoski A, et al. Mortality and cardiac and vascular outcomes in extremely obese women. Journal of the American Medical Association. 2006;296:79–86. doi: 10.1001/jama.296.1.79. [DOI] [PubMed] [Google Scholar]
- 14.Hamoui N, Kim K, Anthone G, et al. The significance of elevated levels of parathyroid hormone in patients with morbid obesity before and after bariatric surgery. Archives of Surgery. 2003;138:891–897. doi: 10.1001/archsurg.138.8.891. [DOI] [PubMed] [Google Scholar]
- 15.Slater GH, Ren CJ, Siegel N, et al. Serum fat-soluble vitamin deficiency and abnormal calcium metabolism after malabsorptive bariatric surgery. Journal of Gastrointestinal Surgery. 2004;8:48–55. doi: 10.1016/j.gassur.2003.09.020. [DOI] [PubMed] [Google Scholar]
- 16.Johnson JM, Maher JW, DeMaria EJ, et al. The long-term effects of gastric bypass on vitamin D metabolism. Annals of Surgery. 2006;243:701–704. doi: 10.1097/01.sla.0000216773.47825.c1. [DOI] [PMC free article] [PubMed] [Google Scholar]
- 17.Dhesi JK, Bearne LM, Moniz C, et al. Neuromuscular and psychomotor function in elderly subjects who fall and the relationship with vitamin D status. Journal of Bone and Mineral Research. 2002;17:891–897. doi: 10.1359/jbmr.2002.17.5.891. [DOI] [PubMed] [Google Scholar]
- 18.Bischoff-Ferrari HA, Dawson-Hughes B, Willett WC, et al. Effect of Vitamin D on falls: a meta-analysis. Journal of the American Medical Association. 2004;291:1999–2006. doi: 10.1001/jama.291.16.1999. [DOI] [PubMed] [Google Scholar]
- 19.Vieth R. Vitamin D supplementation, 25-hydroxyvitamin D concentrations, and safety. American Journal of Clinical Nutrition. 1999;69:842–856. doi: 10.1093/ajcn/69.5.842. [DOI] [PubMed] [Google Scholar]
- 20.Holick MF. Vitamin D deficiency. New England Journal of Medicine. 2007;357:266–281. doi: 10.1056/NEJMra070553. [DOI] [PubMed] [Google Scholar]
- 21.Arunabh S, Pollack S, Yeh J, et al. Body fat content and 25-hydroxyvitamin D levels in healthy women. Journal of Clinical Endocrinology and Metabolism. 2003;88:157–161. doi: 10.1210/jc.2002-020978. [DOI] [PubMed] [Google Scholar]
- 22.Martins D, Wolf M, Pan D, et al. Prevalence of cardiovascular risk factors and the serum levels of 25-hydroxyvitamin D in the United States: data from the Third National Health and Nutrition Examination Survey. Archives of Internal Medicine. 2007;167:1159–1165. doi: 10.1001/archinte.167.11.1159. [DOI] [PubMed] [Google Scholar]
- 23.Snijder MB, van Dam RM, Visser M, et al. Adiposity in relation to vitamin D status and parathyroid hormone levels: a population-based study in older men and women. Journal of Clinical Endocrinology and Metabolism. 2005;90:4119–4123. doi: 10.1210/jc.2005-0216. [DOI] [PubMed] [Google Scholar]
- 24.Bolland MJ, Grey AB, Ames RW, et al. Fat mass is an important predictor of parathyroid hormone levels in postmenopausal women. Bone. 2006;38:317–321. doi: 10.1016/j.bone.2005.08.018. [DOI] [PubMed] [Google Scholar]
- 25.Liu S, Song Y, Ford ES, et al. Dietary calcium, vitamin D, and the prevalence of metabolic syndrome in middle-aged and older U.S. women. Diabetes Care. 2005;28:2926–2932. doi: 10.2337/diacare.28.12.2926. [DOI] [PubMed] [Google Scholar]
- 26.Armas LA, Hollis BW, Heaney RP. Vitamin D2 is much less effective than vitamin D3 in humans. Journal of Clinical Endocrinology and Metabolism. 2004;89:5387–5391. doi: 10.1210/jc.2004-0360. [DOI] [PubMed] [Google Scholar]
- 27.Trang HM, Cole DE, Rubin LA, et al. Evidence that vitamin D3 increases serum 25-hydroxyvitamin D more efficiently than does vitamin D2. American Journal of Clinical Nutrition. 1998;68:854–858. doi: 10.1093/ajcn/68.4.854. [DOI] [PubMed] [Google Scholar]
- 28.Romagnoli E, Mascia ML, Cipriani C, et al. Short- and long-term variations in serum calciotropic hormones after a single very large dose of ergocalciferol (vitamin D2) or cholecalciferol (vitamin D3) in the elderly. Journal of Clinical Endocrinology and Metabolism. 2008;93:3015–3020. doi: 10.1210/jc.2008-0350. [DOI] [PubMed] [Google Scholar]
- 29.Holick MF, Biancuzzo RM, Chen TC, et al. Vitamin D2 is as effective as vitamin D3 in maintaining circulating concentrations of 25-hydroxyvitamin D. Journal of Clinical Endocrinology and Metabolism. 2008;93:677–681. doi: 10.1210/jc.2007-2308. [DOI] [PMC free article] [PubMed] [Google Scholar]
- 30.Hodkinson HM, Round P, Stanton BR, et al. Sunlight, vitamin D, and osteomalacia in the elderly. Lancet. 1973;1:910–912. doi: 10.1016/s0140-6736(73)91362-7. [DOI] [PubMed] [Google Scholar]
- 31.Lips P, van Ginkel FC, Jongen MJ, et al. Determinants of vitamin D status in patients with hip fracture and in elderly control subjects. American Journal of Clinical Nutrition. 1987;46:1005–1010. doi: 10.1093/ajcn/46.6.1005. [DOI] [PubMed] [Google Scholar]
- 32.Singh RJ, Taylor RL, Reddy GS, et al. C-3 epimers can account for a significant proportion of total circulating 25-hydroxyvitamin D in infants, complicating accurate measurement and interpretation of vitamin D status. Journal of Clinical Endocrinology and Metabolism. 2006;91:3055–3061. doi: 10.1210/jc.2006-0710. [DOI] [PubMed] [Google Scholar]
- 33.Binkley N, Krueger D, Cowgill CS, et al. Assay variation confounds the diagnosis of hypovitaminosis D: a call for standardization. Journal of Clinical Endocrinology and Metabolism. 2004;89:3152–3157. doi: 10.1210/jc.2003-031979. [DOI] [PubMed] [Google Scholar]
- 34.Strain GW, Gagner M, Inabnet WB, et al. Comparison of effects of gastric bypass and biliopancreatic diversion with duodenal switch on weight loss and body composition 1–2 years after surgery. Surgery for Obesity and Related Diseases. 2007;3:31–36. doi: 10.1016/j.soard.2006.09.002. [DOI] [PubMed] [Google Scholar]
- 35.Nesby-O'Dell S, Scanlon KS, Cogswell ME, et al. Hypovitaminosis D prevalence and determinants among African American and white women of reproductive age: third National Health and Nutrition Examination Survey, 1988–1994. American Journal of Clinical Nutrition. 2002;76:187–192. doi: 10.1093/ajcn/76.1.187. [DOI] [PubMed] [Google Scholar]
- 36.Bolland MJ, Grey AB, Ames RW, et al. The effects of seasonal variation of 25-hydroxyvitamin D and fat mass on a diagnosis of vitamin D sufficiency. American Journal of Clinical Nutrition. 2007;86:959–964. doi: 10.1093/ajcn/86.4.959. [DOI] [PubMed] [Google Scholar]
- 37.Harris SS, Dawson-Hughes B. Reduced sun exposure does not explain the inverse association of 25-hydroxyvitamin D with percent body fat in older adults. Journal of Clinical Endocrinology and Metabolism. 2007;92:3155–3157. doi: 10.1210/jc.2007-0722. [DOI] [PubMed] [Google Scholar]
- 38.Zemel MB. Role of calcium and dairy products in energy partitioning and weight management. American Journal of Clinical Nutrition. 2004;79:907S–912S. doi: 10.1093/ajcn/79.5.907S. [DOI] [PubMed] [Google Scholar]
- 39.Yanoff LB, Parikh SJ, Spitalnik A, et al. The prevalence of hypovitaminosis D and secondary hyperparathyroidism in obese Black Americans. Clinical Endocrinology. 2006;64:523–529. doi: 10.1111/j.1365-2265.2006.02502.x. [DOI] [PMC free article] [PubMed] [Google Scholar]
- 40.Burgaz A, Akesson A, Oster A, et al. Associations of diet, supplement use, and ultraviolet B radiation exposure with vitamin D status in Swedish women during winter. American Journal of Clinical Nutrition. 2007;86:1399–1404. doi: 10.1093/ajcn/86.5.1399. [DOI] [PubMed] [Google Scholar]
- 41.Li B, Byrijalsen I, Christiansen C, et al. Vitamin D2 supplementation suppresses endogenous levels of 25-hydroxyvitamin D3: clinical application of a new, direct immunoassay for the specific detection of 25-hydroxyvitamin D3. Journal of Bone and Mineral Research. 2007;22:S183. [Google Scholar]
- 42.Heaney RP, Davies KM, Chen TC, et al. Human serum 25-hydroxycholecalciferol response to extended oral dosing with cholecalciferol. American Journal of Clinical Nutrition. 2003;77:204–210. doi: 10.1093/ajcn/77.1.204. [DOI] [PubMed] [Google Scholar]
- 43.Barger-Lux MJ, Heaney RP, Dowell S, et al. Vitamin D and its major metabolites: serum levels after graded oral dosing in healthy men. Osteoporosis International. 1998;8:222–230. doi: 10.1007/s001980050058. [DOI] [PubMed] [Google Scholar]
- 44.Canto-Costa MH, Kunii I, Hauache OM. Body fat and cholecalciferol supplementation in elderly homebound individuals. Brazilian Journal of Medical and Biological Research. 2006;39:91–98. doi: 10.1590/s0100-879x2006000100011. [DOI] [PubMed] [Google Scholar]