

Abstract
Elevated hepatic fatty acid elongase-5 (Elovl5) activity lowers blood glucose in fasted chow-fed C57BL/6J mice. As high-fat diets induce hyperglycemia and suppress hepatic Elovl5 activity, we tested the hypothesis that elevated hepatic Elovl5 expression attenuates hyperglycemia in high-fat-diet-induced obese mice. Increasing hepatic Elovl5 activity by a recombinant adenoviral approach restored blood glucose and insulin, HOMA-IR, and glucose tolerance to normal values in obese mice. Elevated Elovl5 activity increased hepatic content of Elovl5 products (20:3,n-6, 22:4,n-6) and suppressed levels of enzymes (Pck1, G6Pc) and transcription factors (FoxO1 and PGC1α, but not CRTC2) involved in gluconeogenesis. Effects of Elovl5 on FoxO1 nuclear abundance correlated with increased phosphorylation of FoxO1, Akt, and the catalytic unit of PP2A, as well as a decline in cellular abundance of TRB3. Such changes are mechanistically linked to the regulation of FoxO1 nuclear abundance and gluconeogenesis. These results show that Elovl5 activity impacts the hepatic abundance and phosphorylation status of multiple proteins involved in gluconeogenesis. Our findings establish a link between fatty acid elongation and hepatic glucose metabolism and suggest a role for regulators of Elovl5 activity in the treatment of diet-induced hyperglycemia.
Keywords: Elovl5, FoxO1, PGC1α, gluconeogenesis, fatty liver, diabetes
Microsomal fatty acid elongation plays an important role in saturated monounsaturated fatty acid (MUFA) and polyunsaturated fatty acid (PUFA) synthesis. Microsomal fatty acid elongation utilizes specific substrates (malonyl CoA, NADPH, and fatty acyl CoAs) and enzymes (3-keto acyl CoA synthase, 3-keto acyl CoA reductase, 3-hydroxy acyl CoA dehydratase, and trans 2,3-enoyl CoA reductase) to catalyze the 2-carbon elongation of fatty acids (1–4). Specificity for fatty acyl CoA substrates and the rate of fatty acid elongation is determined by the first step in the pathway; i.e., the activity of the condensing enzyme, 3-keto acyl CoA synthase, and not the reductases or dehydratase (1, 5, 6). As such, 3-keto acyl CoA synthase (also known as Elovl, elongation of long chain fatty acid) plays the key regulatory role in determining type and amount of elongated fatty acids found in cells.
Seven Elovl subtypes (Elovl 1–7) have been identified in the human, mouse, and rat genomes. While Elovl1, Elovl3, and Elovl6 elongate SFA and MUFA, Elovl2, Elovl4, and Elovl5 elongate PUFA (2, 3, 7–9). Elovl5 also elongates some MUFA, like palmitoleic acid [16:1,n-7] (7), as well as PUFA, e.g., linoleic acid (18:2,n-6), γ-linolenoyl-CoA (18:3,n-6), and arachidonic acid, 20:4,n-6 (7, 8, 10). Elovl 2 and Elovl5 elongate 20-carbon PUFA to form 22 carbon PUFA, while Elovl2 exclusively elongates 22-carbon PUFA to form 24-carbon fatty acids (7). The formation of 24-carbon PUFA is required for docosahexaenoic acid (22:6,n-3) synthesis (11). Thus, Elovl2 and Elovl5 play an important role in n-3 and n-6 PUFA synthesis. Human and rodent liver express five Elovl subtypes, Elovl5>Elovl1 = Elovl2 = Elovl6>Elovl3 (7, 8). Several of these elongases are regulated by stage of development, tissue-specific factors, hormones, dietary factors, and pharmacologic compounds (2, 3, 7–9, 12). Consequently, changes in the activity of fatty acid elongases (Elovl) affect cellular fatty acid composition (2, 3). Changes in cellular fatty acid content impact cell function through transcriptional and posttranscriptional regulatory mechanisms (13–15).
Recent studies suggest fatty acid elongases play a role in chronic metabolic diseases. Global ablation of fatty acid elongase-6 (Elovl6) protects mice from diet-induced diabetes (16). Ablation of Elovl5 increases hepatic lipid content, at least in part by inducing sterol regulatory element binding protein-1 (SREBP-1), a key transcription factor controlling de novo lipogenesis (17). Our studies established that induction of hepatic Elovl5 activity altered both plasma and blood lipid composition, and it also affected glucose metabolism (10). Elevated hepatic Elovl5 activity induced a modest, but significant, decline in blood glucose levels and significantly suppressed cytosolic phosphoenolpyruvate carboxykinase (Pck1) mRNA. (Pck1 is a key enzyme involved in gluconeogenesis.) While effects of fatty acid elongases on lipid metabolism can be predicted by the known action of these enzymes on cellular fatty acid composition (14), elongase effects on carbohydrate metabolism were not expected.
High-fat diets induce obesity, hyperglycemia, insulin resistance, and fatty liver in C57BL/6J mice. High-fat diets also suppress hepatic Elovl5 activity (7). This study tested the hypothesis that restoration of Elovl5 activity in livers of obese mice is sufficient to correct high-fat-diet-induced hyperglycemia. Our second goal was to determine how elevated Elovl5 activity controls the expression of Pck1 and other proteins involved in gluconeogenesis. Transcriptional control of Pck1 is very complex and involves multiple transcription factors [forkhead box O1 (FoxO1), hepatic nuclear protein 4α (HNF4α), CCAAT/enhancer binding protein α (c/EBPα), peroxisome proliferator activated receptor α (PPARα)] and other regulatory proteins [peroxisome proliferator activated receptor γ co-activator 1α (PGC1α), tribbles-related protein B3 (TRB3), sirtuin 1 (SIRT1)] (18–20). PPARα controls the expression of multiple proteins involved in gluconeogenesis, including Pck1 (21), TRB3 (22), and fibroblast growth factor 21 (FGF21) (23). TRB3 inhibits Akt activity, while FGF21 regulates PGC1α (23). PGC1α interacts with FoxO1, and both factors bind to promoters of target genes, like Pck1 (24, 25). Phosphorylation of FoxO1 by Akt prevents phospho-FoxO1 (pFoxO1) from entering nuclei (26, 27). These mechanisms account for much of the insulin-mediated suppression of gluconeogenesis. The outcome of our studies will establish that hepatic Elovl5 activity regulates the expression of multiple enzymes and transcription factors involved in gluconeogenesis. This regulation is achieved by effects on PPARα-regulated gene expression and control of the phosphorylation status of key proteins controlling gluconeogenesis.
MATERIALS AND METHODS
Animals
All procedures for the use and care of animals for laboratory research were approved by the Institution Animal Care and Use Committee (IACUC) at Oregon State University. Male C57BL/6J mice (stock #000664, Jackson Laboratories, Bar Harbor, ME), 2 months of age, were fed either a chow maintenance diet (Purina 5001), low-fat diet (10% calories as fat, D12450B), or high-fat diet (60% calories as fat, D12492, Research Diets, Inc.) ad lib. Mice were fed the low- and high-fat diets for 12 weeks. The fatty acid composition of the low- and high-fat diets is shown in supplementary Fig. I.
Fasting and refeeding
Mice were fasted overnight (beginning 6 PM). The next morning (8 AM), food was returned to 1/2 of the mice. Fasted and refed animals were euthanized (isoflurane and exsanguination) at 8 AM (fasted) and noon (refed) for blood and tissue collection.
Glucose tolerance test
Mice maintained on a low- or high-fat diet were used for a glucose tolerance test. Five days prior to the end of the study, mice were injected with recombinant adenovirus (see below). Three days later, mice were subjected to a glucose tolerance test. Mice were fasted overnight (beginning 6 PM). The next morning (∼10 AM) mice were injected with glucose (2 g/kg ip). Blood was withdrawn from the tail vein before and after glucose treatment. Blood glucose was measured using a hand-held glucose meter (Contour, Bayer).
Recombinant adenovirus
The construction, purification, and titering of the recombinant adenoviruses (Ad-Luc, luciferase and Ad-Elovl5, Elovl5) were described previously (7, 10). Mice were injected with adenovirus (2 × 10¹⁰ viral particles/mouse in PBS) by a retro-orbital route while under mild isoflurane anesthesia. Mice were maintained on food and water ad lib for the duration of the study. Body weight, food, and water intake were monitored daily. All animals displayed no adverse effects from the adenovirus injection and gained weight equally for the 5-day period after injection.
RNA extraction and quantitative real time-polymerase chain reaction
Total RNA was extracted from mouse liver, and transcript levels were measured by qRT-PCR (10). Gene-specific primers are listed in Table 1. Primers were designed using Primer Express software (Applied Biosystems, Foster City, CA). First-strand cDNA was synthesized using the SuperScript III kit (Invitrogen, Carlsbad, CA). Synthesized cDNA was mixed with SYBR green/ DyANmo (FL400) (New England Biolabs). PCR quantification used a MJ Research Peltier ThermoCycler-200 (DNA Engine). All reactions were performed in triplicate. The relative amounts of mRNAs were calculated by using the comparative CT method (User Bulletin #2, Applied Biosystems). Cyclophilin was used as a control, and all results were normalized to the abundance of cyclophilin mRNA.
TABLE 1.
Primer pairs for qRT-PCR
| Accession Number | Forward | Reverse | |
|---|---|---|---|
| Acyl CoA thioesterase 1 (ACOT1) | NM_012006 | CGCAGCCACCCCGAGGTAAA | TCTCAGGATGGTCACAGGGGGT |
| Cyclophilin | NM_008907 | CTTCTTGCTGGTCTTGCCATTCCT | GGATGGCAAGCATGTGGTCTTTG |
| Cytochrome P450-4A10 | NM_010011 | TGTTTGACCCTTCCAGGTTT | CAATCACCTTCAGCTCACTCA |
| Δ5-desaturase (FADS1) | NM_146094 | TGTGTGGGTGACACAGATGA | GTTGAAGGCTGATTGGTGAA |
| Δ6-desaturase (FADS2) | NM_019699 | CCACCGACATTTCCAACAC | GGGCAGGTATTTCAGCTTCTT |
| Fatty acid elongase-2 (Elovl2) | NM_019423 | ACGCTGGTCATCCTGTTCTT | GCCACAATTAAGTGGGCTTT |
| Fibroblast growth factor-21 (FGF21) | NM_020013 | TACACAGATGACGACCAAGAC | AAAGTGAGGCGATCCATAGAG |
| Forkhead Box O1 (FoxO1) | NM_019739 | CAATGGCTATGGTAGGATGG | TTTAAATGTAGCCTGCTCAC |
| Glucose 6 phosphatase, catalytic (G6Pc) | NM_008061 | GCCTTCTATGTCCTCTTTCC | CAAACAGAATCCACTTGAAGAC |
| HMG-CoA synthase-2 (HS2) | NM_008256 | CCTTGAACGAGTGGATGAGA | CAGATGCTGTTTGGGTAGCA |
| Phosphoenolpyruvate carboxykinase (Pck1) | NM_011044 | ACATTGCCTGGATGAAGTTTG | GGCATTTGGATTTGTCTTCAC |
| Pyruvate carboxylase (PCX) | NM_008797 | CGTGGTCTTCAAGTTCTGTG | CTAAGCCCATGTAGTACTCCAG |
| PPARγ coactivator 1α (PGC1α) | NM_008904 | CTATGAAGCCTATGAGCACGA | ATAGCTGTCTCCATCATCCC |
| Tribbles-related protein B3 (TRB3) | NM_175093 | GGCTCCAGGACAAGATGCGAGC | AGGGGCCACAGCAGGTGACA |
Fatty acid elongation assay
Mouse liver microsomes were prepared and used for a fatty acid elongation assay (7, 8). The fatty acyl-CoA substrate used for this assay was 18:3,n-6-CoA, an Elovl5-specific substrate (10).
Lipid extraction and fatty acid analysis
Total lipids were extracted from liver in chloroform:methanol (2:1) plus 1 mM butylated hydroxytoluene (10). 7-nonadecenoic acid (19:1) was added as a recovery standard at the time of extraction. Protein (Bio-Rad, Hercules, CA) was measured in extracts after the initial homogenization step in 40% methanol. Total lipids were saponified, converted to fatty acid methyl esters (FAME) in 1% H2SO4 in methanol, and heated to 90°C for 1 h. FAME were extracted in hexane, dried, and resuspended in hexane plus 0.05% butylated hydroxytoluene, and quantified using an Aligent 7890 GC gas chromatograph equipped with a flame ionization detector (FID) (conditions: column, 100 × 0.25 mm ID, 0.2 μm HP-88; inlet temperature = 250°C; vol. injected 1 μl; split ratio varied from 1:5 to 1:50 depending on the concentration of FAME; carrier gas A = hydrogen; B = helium; head pressure 2 ml/min constant flow; oven: 120°C for 1 min, 10°C per min to 175°C, 10 min at 5°C per min to 210°C, 5 min at 5°C per min to 230°C, 5 min; detector temperature, 280°C; detector gases: 40 ml/min hydrogen; 450 ml/min air, helium to make up gas 30 ml/min]. Fatty acid methyl ester standards (GLC-642, GLC-643, and GLC-682) were obtained from Nu-Chek Prep.
Immunoblotting
Proteins were extracted from mouse liver as described previously (10) in the presence of protease (Roche Diagnostics, Indianapolis, IN) and phosphatase inhibitors (1 mM β-glycerolphosphate, 2.5 mM Na-pyrophosphate, 1 mM Na3VO4). Cytosolic (postnuclear) and nuclear protein fractions were separated electrophoretically by SDS-polyacrylamide gel electrophoresis (NuPAGE 4–12% polyacrylamide Bis-Tris, Invitrogen) and transferred to nitrocellulose (BA83) membranes.
Antibodies used for immunoblotting included total FoxO1 and phospho-FoxO1; total PDK1 and phospho-PDK1; total protein phosphatase 2A (PP2A) catalytic unit, and total C-terminal modulator protein (CTMP) (Cell Signaling, Danvers, MA). HNF-4α (H-171), Na,K-ATPase, total Akt1 (C20), phospho-AKT1/2/3 (Ser 473)-R, PPARα (H98), max-like factor X (MLX) (N-17) PGC1, TRB3, and Pck1 (P14, Sc74825) were obtained from Santa Cruz Biotechnology (Santa Cruz, CA). SREBP1 (2A4) and TATA-binding protein (TBP) were obtained from Abcam, Inc. (Cambridge, MA). Phospho-PP2A catalytic unit (Tyr-307) was obtained from Epitomics (Burlingame, CA). Carbohydrate regulatory element binding protein (NB400135, ChREBP) was obtained from Novus Biologicals (Littleton, CO). The Elovl5 antibody was described previously (10). The IRDye 680 and IRDye 800 secondary antibodies (anti-mouse, anti-rabbit, and anti-goat) were obtained from LiCor, Inc. (Lincoln, NE) or Rockland Immunologicals (Gilbertsville, PA). Antigen-antibody reactions were detected and quantified using LiCor Odyssey scanner and software. Phospho-IRS2 was measured in liver extracts using an ELISA kit (Cell Signaling, Danvers, MA).
Measurement of plasma parameters
Plasma glucose, triglyceride, nonesterified fatty acids, and cholesterol were measured using kits from Wako (Richmond, VA). Plasma β-hydroxybutyrate was measured using a kit from Stanbio (Boerne, TX). Plasma insulin and adiponectin were assayed by ELISA (Millipore, Watham, MA).
Measurement of hepatic protein, DNA, triglyceride, cholesterol, and glycogen content
Liver (25–50 mg) was homogenized in 40% methanol plus 0.1 mM HCl. A sample was collected for protein (Quick Start Bradford Assay, Bio-Rad) and DNA analysis (FluoReporter blue fluorometric dsDNA, Invitrogen). Total hepatic lipids were extracted with chloroform:methanol as described above. After centrifugation of the extract, the aqueous phase was used to measure glycogen. The aqueous phase was adjusted to 0.2 N NaOH, heated to 65°C for 1 h, cooled, and neutralized with 5 N HCl. Glycogen was precipitated with ethanol, resuspended in water, and hydrolyzed with amyloglucosidase (Sigma-Aldrich). Glucose released by amyloglucosidase was measured using the glucose assay kit (Wako) (10). The organic phase was dried under nitrogen in vacuo and assayed for cholesterol and triglyceride using the total cholesterol and L-type TG H triglyceride assay kits from Wako (10).
Statistical analysis
The statistical analysis performed in this work included Students t-test and ANOVA (two-way) plus post hoc Tukey honestly significant difference test (http://faculty.vassar.edu/lowry/VassarStats.html). A P value ≤ 0.05 was considered statistically different.
RESULTS
Elevated hepatic Elovl5 activity induces FoxO1 phosphorylation in chow-fed mice
Previous studies with chow-fed C57BL/6J mice established that a 6-fold elevation in hepatic Elovl5 activity increased fasting levels of glycogen and suppressed hepatic Pck1 mRNA and plasma glucose (10). The effect on hepatic glycogen was attributed to the increased phosphorylation of Akt and glycogen synthase-3β (Gsk3β). The mechanism for Elovl5 control of Pck1 and blood glucose was less clear. In this study, we determined whether Elovl5 controls FoxO1 nuclear abundance, a well-established regulator of hepatic Pck1 expression and gluconeogenesis (25).
Using liver extracts from the previous study (10), the nuclear and cytoplasmic abundance of FoxO1 and phosphorylated FoxO1 (pFoxO1) was measured (Fig. 1). Refeeding fasted mice suppressed hepatic nuclear FoxO1 by 60% (Fig. 1A, B). A separate group of mice receiving a saline injection gave similar results for FoxO1 following the fasting and refeeding study (data not shown). Ad-Luc infection alone did not impact the fasting-refeeding effect on FoxO1 nuclear abundance.
Fig. 1.

Elevated hepatic Elovl5 activity suppresses FoxO1 nuclear content. The tissues samples used for the FoxO1 analysis were the same as those used in our previous study (10). Briefly, male C57BL/6J mice maintained on a chow diet (Purina 5001) were injected with Ad-Luc (control recombinant adenovirus) or Ad-Elovl5. Four days post injection animals were fasted overnight (see “Materials and Methods”). At 8:00 AM the next day, 1/2 of the mice were euthanized for blood and tissue recovery ("Fasted”). The remaining mice were fed chow (Purina 5001) and euthanized 4 h later ("Refed”). A: Hepatic nuclear and cytosolic (post-nuclear) proteins were prepared and levels of FoxO1, pFoxO1, TBP, and Na,K-ATPase were measured by immunoblotting (see “Materials and Methods”); three animals/group. B: TBP and Na,K-ATPase are loading controls. Levels of nuclear FoxO1 were normalized to TBP; i.e., nFoxO1/TBP. C: The level of cytosolic phosphorylated FoxO1 was normalized to total cytosolic FoxO1. Results are expressed as nFoxO1/TBP or pFoxO1/FoxO1, mean ± SD, n = 3. *P ≤ 0.05 fasted versus refed animals; #P ≤ 0.05 Ad-Luc- versus Ad-Elovl5-infected animals, ANOVA.
Fasted mice infected with Ad-Elovl5 had a level of nuclear FoxO1 comparable to that of refed mice (Fig. 1A, B). Refeeding Ad-Elovl5-infected mice had no additional effect on FoxO1 nuclear abundance. The Elovl5-mediated decline in nuclear FoxO1 correlated with a 4-fold increase in the phosphorylation status of cytoplasmic FoxO1 (i.e., pFoxO1/cFoxO1) (Fig. 1A, C). FoxO1 is phosphorylated by Akt; elevated hepatic Elovl5 increases hepatic Akt phosphorylation 3-fold in fasted mice (10). By stimulating FoxO1 phosphorylation, increased hepatic Elovl5 suppresses FoxO1 nuclear abundance, presumably by inhibiting FoxO1 from entering nuclei (26, 27).
Effect of diet and adenovirus infection on hepatic Elovl5 activity
To gain further support for the notion that changes in hepatic Elovl5 activity impact glucose metabolism, we used a mouse model of high-fat diet-induced obesity, hyperglycemia, and insulin resistance. Previous studies established that feeding mice a high-fat (lard) diet suppressed hepatic Elovl5 activity (7). In our study, male C57BL/6J mice were fed a low-fat (10% calories as fat) or high-fat (60% calories as fat) diet for 12 weeks as described (7). Five days before the end of the feeding trial, mice were infected with Ad-Luc or Ad-Elovl5. High-fat diets significantly increased body weight by 33–37% (Table 2). Infection of mice with Ad-Elovl5 did not significantly affect body weight.
TABLE 2.
Body weight, food intake, and plasma and hepatic parameters
| Low Fat |
High Fat |
|||
|---|---|---|---|---|
| Ad-Luc | Ad-Elovl5 | Ad-Luc | Ad-Elovl5 | |
| Number of mice/group | 8 | 8 | 8 | 8 |
| Body weight (g) | ||||
| Before injection | 30.9 ± 3.7 | 27.5 ± 1.2 | 42.5 ± 5.0a | 39.2 ± 5.0a |
| After injection | 30.4 ± 3.6 | 27.4 ± 1.6 | 40.9 ± 4.6a | 36.3 ± 4.0a |
| Food intake | ||||
| Gram/day | 3.7 ± 0.8 | 3.3 ± 0.7 | 3.3 ± 1.6 | 2.5 ± 0.7 |
| Kcal/day | 14.1 ± 3.2 | 12.6 ± 2.6 | 17.2 ± 8.5 | 12.8 ± 3.9 |
| Plasma parameters | ||||
| Adiponectin (μg/ml) | 5.2 ± 1.3 | 5.9 ± 0.3 | 6.6 ± 1.0 | 6.2 ± 1.1 |
| NEFA (mEg/ml) | 0.3 ± 0.1 | 0.4 ± 0.1 | 0.3 ± 0.1 | 0.3 ± 0.1 |
| Cholesterol (mg/dl) | 114.6 ± 42.3 | 173.9 ± 4.9 | 181.3 ± 46.6 | 159.0 ± 0.2 |
| Triglycerides (mg/dl) | 119.6 ± 4.7 | 55.9 ± 12.1b | 91.5 ± 25.0 | 70.7 ± 18.0 |
| β-hydroxybutyrate (mM) | 1.54 ± 0.3 | 1.65 ± 0.4 | 0.6 ± 0.3a | 1.5 ± 0.2 |
| Liver parameters | ||||
| Weight (g) | 1.2 ± 0.1 | 1.5 ± 0.1b | 1.7 ± 0.3a | 1.9 ± 0.3a |
| Percent of body weight | 3.9 ± 0.4 | 5.5 ± 0.3b | 4.2 ± 0.7 | 5.2 ± 0.3b |
| Liver protein (mg protein/mg DNA) | 24.3 ± 6.5 | 18.3 ± 4.2 | 29.0 ± 3.6 | 24.8 ± 4.8 |
| Triglyceride (μg triglyceride/mg protein) | 49.2 ± 25.0 | 66.1 ± 22.6 | 156.9 ± 88.4a | 91.0 ± 17.8 |
| Cholesterol (μg cholesterol/mg protein) | 14.9 ± 2.1 | 13.3 ± 0.7 | 17.4 ± 7.1 | 17.0 ± 3.6 |
| Glycogen (μg glucose/mg protein) | 2.3 ± 2.1 | 4.9 ± 2.2b | 31.9 ± 9.6a | 10.8 ± 7.7b |
Mice were fed a low-fat diet (Research Diets D12450B, 10% calories as fat) or a high-fat diet (Research Diets, D12492, 60% calories as fat) for 12 weeks, ad lib. After 11 weeks on the diet, mice in each group were infected with recombinant adenovirus expressing either luciferase (Ad-Luc) or Elovl5 (Ad-Elovl5). Five days later, mice were fasted overnight and euthanized the next day. Body weights were determined prior to injection on ad lib-fed mice. Final body weight (after injection), plasma, and hepatic parameters were measured in mice fasted overnight (see “Materials and Methods”). Results are presented as mean ± SD. Elovl5, fatty acid elongase-5; Luc, luciferase.
P ≤ 0.05, low fat versus high fat.
P ≤ 0.05 Ad-Luc versus Ad-Elovl5, ANOVA, two-way.
The high-fat diet suppressed hepatic Elovl5 mRNA, protein, and enzyme activity in Ad-Luc-infected mice by ∼50% (Fig. 2A–C). This effect on Elovl5 is consistent with our previous study (7). Infection of high-fat-fed mice with Ad-Elovl5 increased Elovl5 mRNA, Elovl5 protein, and enzyme activity (Fig. 2AndashC). The level of Elovl5 enzyme activity in Ad-Elovl5-infected mice is ∼40% above the level of Elovl5 activity in livers of low-fat-fed mice (Fig. 2C) (7, 10).
Fig. 2.

Hepatic Elovl5 mRNA, protein, and enzyme activity in C57BL/6J mice fed low- and high-fat diets. Mice were fed a low-fat diet (Research Diets D12450B, 10% calories as fat) or a high-fat diet (Research Diets, D12492, 60% calories as fat) ad lib for 12 weeks. After 11 weeks on the diet, mice in each group were infected with recombinant adenovirus expressing either luciferase (Ad-Luc) or Elovl5 (Ad-Elovl5). Five days later, mice were fasted overnight and euthanized the next day. Table 2 provides details on body weight, plasma, and liver parameters. Hepatic Elovl5 mRNA, protein, and enzyme activity used livers from mice fasted overnight (see “Materials and Methods”). A: Elovl5 mRNA abundance. The abundance of Elovl5 and cyclophilin mRNA in livers of fasted mice infected with Ad-Luc and Ad-Elovl5 was quantified by qRT-PCR (see “Materials and Methods”). Results are expressed as Elovl5 mRNA abundance relative to cyclophilin, mean ± SD, n = 8, *P ≤ 0.05 low fat versus high fat; #P ≤ 0.05 Ad-Luc versus Ad-Elovl5, ANOVA. B: Elovl5 immunoblot. Hepatic Elovl5 and Na,K-ATPase (loading control) protein was measured by immunoblotting (see “Materials and Methods”) (10). Hepatic protein extracts are from two separate mice per group. C: Elovl5 activity. Fatty acid elongase activity was measured using microsomes isolated from livers of fasted mice. 18:3,n6-CoA was used as substrate; 18:3,n6-CoA is a specific substrate for Elovl5 (see “Materials and Methods”) (10). Results are expressed as elongase activity nmoles 14C-malonyl CoA incorporated in to fatty acids/mg protein, mean ± SD, 8 animals/group (7, 10, 54). *P ≤ 0.05 low fat versus high fat; #P ≤ 0.05 Ad-Luc versus Ad-Elovl5, ANOVA.
Elevated hepatic Elovl5 activity corrects hyperglycemia in obese mice
The effect of the high-fat diet and elevated Elovl5 activity on blood glucose and insulin levels in fasted mice was examined (Fig. 3). As expected, Ad-Luc infected obese mice fed the high-fat diet are hyperglycemic (Fig. 3A) and have elevated blood insulin levels (Fig. 3B). In contrast, high fat-fed obese mice infected with Ad-Elovl5 have normal blood levels of glucose and insulin. While the Homeostasis Model Assessment of Insulin Resistance (HOMA-IR) score of 9.4 ± 6.3 reflects insulin resistance (HOMA-IR > 3.0) (Fig. 3C), the lack of a significant effect on fasting plasma adiponectin and NEFA suggests these mice are not severely insulin resistant (Table 2).
Fig. 3.

Blood glucose, plasma insulin, HOMA-IR, and glucose tolerance test in mice fed low- and high-fat diets. Male C57BL/6J mice were maintained on low-fat (Research Diets D12450B, 10% calories as fat) or high-fat diets (Research Diets, D12492, 60% calories as fat) ad lib for 12 weeks. After 11 weeks on the diets, mice were infected with Ad-Luc or Ad-Elovl5. Five days later, mice were fasted overnight (6 PM to 8 AM; see “Materials and Methods”) and euthanized at 8:00 AM the next day for blood and tissue collection. Blood glucose (mM) (A) and plasma insulin (μU/ml) (B) were measured; these values were used to calculate HOMA-IR (C) [HOMA-IR = (G × I)/22.5]. Results are expressed as mean ± SD, n = 4–8; *P ≤ 0.05 Ad-Luc versus Ad-Elovl5, ANOVA. D: Glucose tolerance test. Mice on the high-fat diet for 11 weeks were injected with Ad-Luc ("High Fat Ad-Luc”) or Ad-Elovl5 ("High Fat Ad-Elovl5”) as described above. Mice on the low-fat diet for 11 weeks were not injected with adenovirus ("Low Fat”) and served as a reference for a normal glucose tolerance test. Three days after infection, all mice were fasted overnight (see “Materials and Methods”). The next day, blood glucose was measured at 8 AM; all fasted mice were injected with glucose (2 mg/kg) and blood glucose was measured 30, 60, and 120 min afterward (see “Materials and Methods”). Results are expressed as blood glucose (mM), mean ± SD, four animals/group; *P ≤ 0.05 Ad-Luc versus Ad-Elovl5, ANOVA. The area under the curve was calculated using Sigmaplot v.10 trapezoid rule. The values are 1581 ± 168, 2044 ± 91, 1404 ± 132 mM glucose × min; for low-fat, high-fat Ad-Luc, and high-fat Ad-Elovl5, respectively. The high-fat Ad-Luc group was significantly different from the low-fat and high-fat Ad-Elovl5 groups; P ≤ 0.05, ANOVA.
Since high-fat-fed mice are glucose intolerant (7), we examined glucose tolerance in fasted mice maintained on a high-fat diet and infected with either Ad-Luc or Ad-Elovl5 (Fig. 3D). Mice on the low-fat diet for 12 weeks that were not infected with Ad-Luc or Ad-Elovl5 served as a reference for a normal glucose tolerance test. Compared with low-fat-fed mice, mice fed the high-fat diet were glucose intolerant. High-fat-fed mice infected with Ad-Elovl5, however, displayed glucose tolerance comparable to that of low-fat-fed mice. Thus, elevated hepatic Elovl5 activity corrects high-fat diet-induced hyperglycemia and glucose intolerance.
The effect of diet and Elovl5 activity on plasma and liver composition
Fasting plasma triglycerides, NEFA, and cholesterol were not significantly affected by diet (Table 2). Fasting β-hydroxybutyrate was significantly decreased in high-fat-fed Ad-Luc-infected mice; an effect that may be in response to elevated fasting insulin or impaired fatty acid oxidation (Fig. 3B). Ad-Elovl5 infection suppressed fasting triglycerides in low-fat-fed mice (by 54%) but not high-fat-fed mice.
While high-fat diets increased liver weight, this effect was not different when expressed as a percentage of body weight or mg protein/mg DNA. Infection of mice with Ad-Elovl5, however, significantly increased the liver weight (% of body weight) by 44% and 33% in low- and high-fat-fed mice. This effect was not due to increased protein/mg DNA, but it may be due to changes in hepatic lipid and glycogen. Hepatic triglyceride, but not cholesterol, was significantly elevated in mice fed the high-fat diet (Table 2). Hepatic triglycerides in livers of obese mice with elevated Elovl5 activity were not significantly different from mice fed the low-fat diet. Changes in hepatic triglyceride induced by diet or Ad-Elovl5 did not correlate with changes in the nuclear content of transcription factors controlling de novo lipogenesis (e.g., SREBP1, ChREBP, or MLX) (supplementary Fig. III). Thus, factors controlling hepatic triglyceride content in this model likely involve triglyceride synthesis, VLDL assembly and secretion, and fatty acid oxidation.
Hepatic glycogen content in fasted mice was significantly affected by diet and virus infection. In mice maintained on chow diet (10) or the low-fat diet (Table 2), elevated Elovl5 activity increased hepatic glycogen content. As reported by others (28), the high-fat diet significantly increased the hepatic glycogen content in fasted mice. Changes in hepatic glycogen content correlated with increased phosphorylation of Gsk3β (supplementary Fig. II). These studies established that elevated Elovl5 activity lowers hepatic triglyceride and glycogen in high-fat-diet-induced obese mice.
Effect of diet and Elovl5 activity on hepatic and plasma fatty acid composition
We next examined the effect of diet and Elovl5 activity on hepatic and plasma fatty acid composition. MUFA and PUFA fatty acyl CoAs are substrates for Elovl5-mediated fatty acid elongation (Fig. 4A–D) (7, 8). The dietary fatty acid profiles of the two diets are shown in supplementary Fig. I. When expressed as fatty acid mole percentage, hepatic and plasma content of 16:0, 18:0, or 18:1,n-9 was not significantly affected by diet or elevated hepatic Elovl5 activity. The high-fat diet significantly lowered hepatic 16:1,n-7 and 18:1,n-7 content. Elevated Elovl5 activity significantly increased the relative abundance of 18:1,n-7 in liver of mice fed the low-fat diet (Ad-Luc, 3.9 ± 0.73 mol% and Ad-Elovl5, 5.5 ± 0.72 mol%, P < 0.01, ANOVA) but not in mice fed the high-fat diet. Stearoyl CoA desaturase-1 (SCD1) converts 16:0 to 16:1,n-7 (Fig. 4A); the high-fat lard diet and elevated Elovl5 activity suppressed hepatic SCD1 expression. Diet and Elovl5-induced changes in SCD1 expression correlate with changes in hepatic SREBP1 and ChREBP nuclear abundance (supplementary Fig. III). Both SREBP1 and ChREBP control SCD1 and Elovl6 gene expression (7). Elovl5 or Elovl6 catalyzes the elongation of 16:1,n-7 to vaccenic acid (18:1,n-7) (7, 9)(Fig. 4A). Both low- and high-fat diets contain 16:1,n-7 and 18:1,n-7 but at low levels (<5 mol%) (supplementary Fig. I). The high-fat diet suppresses hepatic and plasma abundance of these MUFA.
Fig. 4.

Effect of dietary fat and Elovl5 on hepatic and plasma fatty acid composition. Pathways for MUFA (A) and n-6 and n-3 PUFA (B) synthesis. Oleic (18:1,n-9), linoleic (18:2,n-6), arachidonic (20:4,n-6), and docosahexaenoic acid (22:6,n-3) (bolded) are the major fatty acids accumulating in liver. Fatty acid composition of mouse liver (C) and plasma (D) were measured on fasted mice. Lipids were extracted, saponified, converted to fatty acid methyl esters, and quantified by gas chromatography (see “Materials and Methods”). Results are expressed as fatty acid mole %, mean ± SD, four mice/group. Statistical differences for the cumulative amount of fatty acids (e.g., 16:1,n-7 plus 18:1,n-7 or 20:2,n-6, 20:3,n-6, 22:4,n-6, 22:6,n-6, 22:5,n-3) are reported in panels C and D; *P ≤ 0.05 low fat versus high fat; #P ≤ 0.05 Ad-Luc versus Ad-Elovl5, ANOVA.
Linoleic acid (18:2,n-6) increased in liver and plasma of mice fed a high-fat diet, while hepatic and plasma content of 20:4,n-6 and 22:6,n-3 were not increased. As such, a high-fat diet suppresses the ratio of 20:4,n-6 to 18:2,n-6 (liver: low fat, 0.54 ± 0.06; high fat, 0.28 ± 0.07; P < 0.05, ANOVA]. This ratio reflects the conversion of dietary 18:2,n-6 to the major end products of PUFA synthesis (i.e., 20:4.n-6). This outcome may be due to the high level of 18:2,n-6 in the high-fat diet or to changes in PUFA synthesis and degradation.
Elevated Elovl5 significantly (P ≤ 0.05) increased hepatic content of several low-abundance C20-22 PUFA in mice fed the low- and high-fat diets. Cumulatively, C20-22 PUFA increased more than 2-fold in livers of mice with elevated Elovl5 activity. A major fraction of this change is due to the 2- to 4-fold increase in dihomo-γ-linolenic (20:3,n-6) and adrenic (22:4,n-6) acids, respectively. These PUFA are well-established products of Elovl5 (10). Elovl5-induced changes in hepatic C20-22 PUFA, however, were not seen in plasma lipids. Instead, plasma 22:4,n-6 levels were lower in Ad-Elovl5-infected mice.
As the endoplasmic reticulum (ER) is the subcellular location for fatty acid elongation, we also examined the fatty acid composition of lipids associated with the ER (supplementary Fig. IV). The high-fat diet induced a similar reduction in microsomal 16:1,n-7 and 18:1,n-7 as seen in total fatty acids. Elevated Elovl5 activity, however, did not increase the C20-22 PUFA content in the ER. As such, Elovl5 products do not accumulate in the ER. In fact, there is very little change in PUFA composition of the ER induced by either the high-fat diet or elevated Elovl5 activity.
Effect of elevated Elovl5 activity on PPARalpha target genes
Elevated hepatic Elovl5 activity attenuates expression of several PPARα-regulated genes in livers of chow-fed mice (10) and in fasted mice maintained on the high-fat diet (Fig. 5). PPARα target genes affected by increased Elovl5 activity include cytochrome P450 4 A10 (CYP4A10); acyl CoA thioesterase-1 (ACOT1); HMG CoA synthase 2 (HS2); and Elovl2. However, other PPARα target genes—hydroxyacyl-coenzyme A dehydrogenase/3-ketoacyl-Coenzyme A thiolase/enoyl-coenzyme A hydratase (trifunctional protein), α-subunit (HADHA), Δ5-fatty acid desaturase (FADS1), and Δ6-fatty acid desaturase (FADS2)—were not significantly affected. This outcome suggests that elevated Elovl5 activity affects a subset of PPARα target genes.
Fig. 5.

Effect of Elovl5 on PPARα-regulated gene expression in mice fed a high-fat diet. RNA was extracted from livers of fasted mice maintained on the high-fat diet and infected with either Ad-Luc or Ad-Elovl5 (see “Materials and Methods”). Transcript abundance was assayed by qRT-PCR (10) using primers listed in Table 1. Results are normalized to the transcript abundance in Ad-Luc-infected mice maintained on the high-fat diet and fasted overnight. Results are presented as fold change induced by Ad-Elovl5, mean ± SD, four mice/group. White bars indicate Ad-Luc-infected mice. Black bars indicate Ad-Elovl5-infected mice. #P ≤ 0.05, Ad-Luc versus Ad-Elovl5, Student's t-test.
Effect of elevated Elovl5 activity on genes involved in gluconeogenesis
We next examined the effect of elevated Elovl5 activity on the expression of several proteins involved in gluconeogenesis—including enzymes Pck1, pyruvate carboxylase (Pcx), and glucose 6 phosphatase (G6Pc); a regulator of Akt activity TRB3; transcription factors FoxO1 and PGC1α; and growth factor FGF21(25, 29, 30)—in livers of fasted mice maintained on the high-fat diet (Fig. 6). Elevated Elovl5 activity significantly suppressed hepatic expression of Pck1, G6Pc, FoxO1, and PGC1α mRNA in livers of mice fed high-fat diets. Transcripts encoding TRB3, FGF21, LXRα, and apolipoprotein C2 (ApoC2), however, were not affected by elevated Elovl5 activity. Similar results were seen in mice fed low-fat diets (data not shown).
Fig. 6.

Effect of elevated Elovl5 activity on mRNA levels of proteins involved in gluconeogenesis. RNA was extracted from livers of fasted mice fed the high-fat diet and infected with either Ad-Luc or Ad-Elovl5, as described (see . Transcript abundance was assayed by qRT-PCR (10) using primers listed in Table 1. Results are normalized to the transcript abundance in Ad-Luc-infected mice maintained on the high-fat diet and fasted overnight. Results are presented as fold change induced by Ad-Elovl5, mean ± SD, four mice/group. White bars indicate Ad-Luc-infected mice. Black bars indicate Ad-Elovl5-infected mice. #P < 0.05, Ad-Luc versus Ad-Elovl5, Student's t-test.
Effect of elevated Elovl5 activity on the abundance of proteins involved in gluconeogenesis
To determine if changes in gene expression were linked to changes in protein, we measured the cytosolic and nuclear abundance of several proteins. Elevated Elovl5 activity attenuated Pck1 protein abundance by 60% (Fig. 7). The decline in Pck1 protein parallels the decline in Pck1 mRNA induced by Elovl5 (Fig. 6).
Fig. 7.
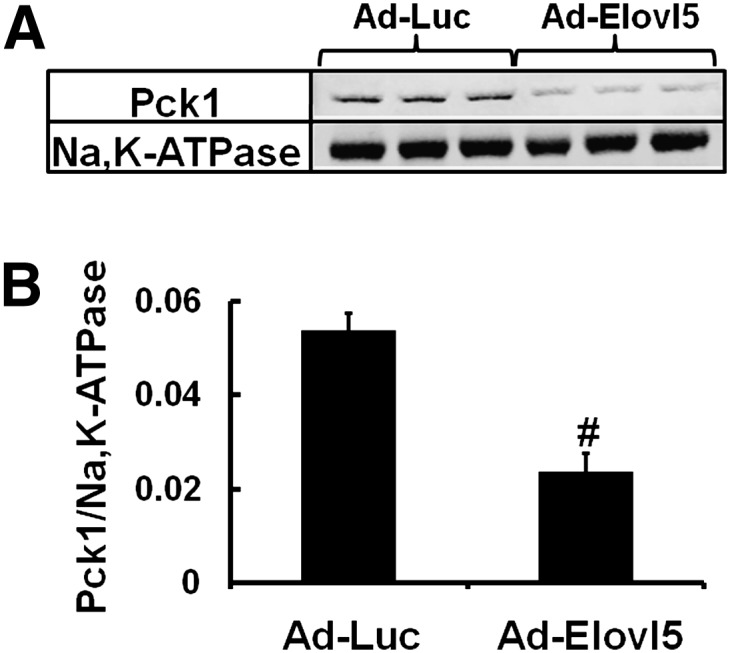
Elevated Elovl5 activity suppresses cytosolic Pck1 abundance. Mouse liver postnuclear (cytosolic) extracts were prepared (10) from fasted mice maintained on the high-fat diet and infected with either Ad-Luc or Ad-Elovl5. Protein abundance of Pck1 and Na,K-ATPase was measured by immunoblotting and quantified using a LiCor Odyssey (10). A: Representative immunoblots for cytosolic Pck1 and Na,K-ATPase; Na,K-ATPase is the loading control; three mice/group. B: Quantified results for cytosolic Pck1 were normalized to Na,K-ATPase; extracts were derived from fasted mice maintained on the high-fat diet and infected with either Ad-Luc or Ad-Elovl5. Results are expressed as mean ± SD, six mice/group. #P ≤ 0.05 Ad-Luc versus Ad-Elovl5, Student's t-test. The results are representative of two separate experiments.
The nuclear abundance of key transcription factors (FoxO1, PGC1α, CRTC2, PPARα, and HNF4α) controlling gluconeogenic gene expression (25, 29–31) was measured (Fig. 8AndashD). High-fat diets induced FoxO1 and PGC1α nuclear abundance by ∼2-fold (Fig. 8AndashC). Elevated hepatic Elovl5 activity suppressed FoxO1 (Fig. 8B) and PGC1α (Fig. 8C) nuclear abundance by over 50% in livers of high-fat-fed mice. The decline in nuclear FoxO1 correlated with elevated pFoxO1 (Fig. 8A, D). Hepatic nuclear content of CRTC2, PPARα, and HNF4α, however, was not affected by elevated hepatic Elovl5 activity. These studies establish that Elovl5 activity regulates the nuclear abundance of a subset of transcription factors controlling gluconeogenic gene expression.
Fig. 8.

Nuclear abundance and phosphorylation status of transcription factors controlling gluconeogenesis. Mouse liver nuclear and postnuclear (cytosolic) extracts were prepared (10) from fasted mice maintained on the low- or high-fat diet and infected with either Ad-Luc or Ad-Elovl5. Protein abundance was measured by immunoblotting, and images were quantified using a LiCor Odyssey (10). A: Representative immunoblots for nuclear FoxO1 (nFoxO1), phosphorylated FoxO1 [cytosolic] (pFoxO1), PGC1α, CRTC2, PPARα, HNF4α, and TBP; extracts from one mouse/group. B-D: Quantified immunoblots for FoxO1, PGC1α, and pFoxO1 (eight mice/group). FoxO1 and PGC1α were normalized to TBP; pFoxO1 was normalized to Na,K-ATPase. Extracts are from mice fed the low-fat (white bars) or high-fat (black bars) diet. All extracts were obtained from mice fasted overnight (see “Materials and Methods”). Results are expressed as mean ± SD, eight mice/group. *P < 0.05 low fat versus high fat; #P ≤ 0.05 Ad-Luc versus Ad-Elovl5, ANOVA.
Effect of diet and Elovl5 on hepatic signaling pathways
Insulin suppresses gluconeogenesis by activating the PI3kinase-Akt pathway. The active, phosphorylated form of Akt phosphorylates FoxO1 (24, 32); pFoxO1 fails to enter the nucleus and is degraded by the 26S proteasome (33). Elevated hepatic Elovl5 activity increased Akt phosphorylation in fasted chow-fed mice (10), low-fat-fed mice, and high-fat-fed mice (Fig. 9A, B) by ∼2-fold. The Elovl5-induced changes in Akt phosphorylation in the fasted state did not correlate with changes in IRS2 or PDK1/2 phosphorylation status (supplementary Fig. III). This outcome suggests that Elovl5 effects on Akt phosphorylation status are not due to activation of the insulin-insulin receptor IRS2-PDK1/2 axis.
Fig. 9.

Abundance and phosphorylation status of hepatic proteins involved in cell signaling. Mouse liver cytosolic extracts were prepared (10) from fasted ("F”) and refed ("R”) mice maintained on low- or high-fat diet and infected with either Ad-Luc or Ad-Elovl5. Protein abundance was measured by immunoblotting, and images were quantified using a LiCor Odyssey (10). A: Representative immunoblots for cytosolic phosphorylated Akt (pAkt) and total Akt (Akt), TRB3, CTMP, phosphorylated PP2A catalytic unit (pPP2A), total PP2A catalytic units (PP2A), and Na,K-ATPase (a loading control); extracts from one mouse/group. B-D: Quantified results for the phosphorylation status of Akt [i.e., pAkt normalized to total Akt (pAkt/Akt)], total TRB3 normalized to Na,K-ATPase (TRB3/Na,K-ATPase), CTMP normalized to Na,K-ATPase, and the phosphorylation status of PP2A catalytic unit [i.e., pPP2A normalized to total PP2A (pPP2A/PP2A)]. Quantified results are from mice maintained on the high-fat diet; mice were fasted (white bars) or refed (black bars) as described (see “Materials and Methods”). Results are expressed as mean ± SD, eight mice/group. *P < 0.05 low fat versus high fat; #P ≤ 0.05 Ad-Luc versus Ad-Elovl5, ANOVA.
Accordingly, we turned our attention to other mechanisms that might regulate Akt phosphorylation. TRB3 (34) and C-terminal modulator protein (CTMP) (35) bind to and inhibit Akt phosphorylation and Akt activity. Hepatic TRB3 protein content is induced by fasting and suppressed by refeeding (Fig. 9A, C). Elevated Elovl5 activity suppressed TRB3 protein content by 50% or more in livers of fasted mice maintained on both the low- and high-fat diets. CTMP was induced ∼2-fold by the high-fat diets (Fig. 9A). Elevated Elovl5 activity significantly (40%) suppressed hepatic CTMP levels in refed, but not fasted, high-fat-fed mice (Fig. 9D).
Protein phosphatase 2A is a multi-subunit enzyme that dephosphorylates Akt and FoxO1 (36, 37). Phosphorylation of tyrosine-307 in the PP2A catalytic subunit inhibits PP2A phosphatase activity (38). The amount PP2A catalytic unit and its phosphorylation status were not affected by diet or fasting (Fig. 9A, E). The phosphorylation status of the PP2A-catalytic unit, however, increased over 2-fold in livers with elevated Elovl5 activity. These findings suggest that increasing hepatic Elovl5 attenuates PP2A activity, thereby attenuating the dephosphorylation of key proteins (Akt (36) and FoxO1 (37)) controlling Pck1 expression and gluconeogenesis.
DISCUSSION
Fatty acid elongases play well-defined roles in saturate, mono- and polyunsaturated fatty acid synthesis (1–4). The notion that changes in fatty acid elongase activity impact carbohydrate metabolism and blood glucose levels is novel. This study establishes that changes in hepatic Elovl5 activity impact blood glucose levels in high-fat-diet-induced obese mice. High-fat-diet-induced obesity, hyperglycemia, glucose intolerance, and fatty liver correlates with low hepatic Elovl5 activity (7) (Figs. 2, 3, 10). Restoration of hepatic Elovl5 activity to levels seen in mice maintained on low-fat diets corrects the hyperglycemia, glucose intolerance, and fatty liver, but it does not abrogate obesity (Table 2). The correction in blood glucose was correlated with reduced hepatic content of Pck1 protein and Pck1 and G6Pase mRNA, decreased nuclear content of FoxO1 and PGC1α, decreased hepatic glycogen content, and increased phosphorylation of FoxO1, Akt, and Gsk3β (Figs. 6–8, Table 2, supplementary Fig. II). These studies establish a mechanistic link between Elovl5-mediated changes in hepatic fatty acid composition (Fig. 4) and the control of hepatic glucose metabolism and blood glucose levels (Fig. 10).
Fig. 10.

Tentative model for Elovl5 effects on hepatic function. See text for description.
Not all transcription factors controlling Pck1 expression are sensitive to changes in Elovl5 activity. Elovl5 had no significant effect on the nuclear content of CRTC2, PPARα, or HNF4α Figs. 8, 10). Elovl5 regulation of FoxO1 and PGC1α involves at least two mechanisms: (a) interference with PPARα-regulated gene expression (Figs. 5, 6) and (b) control of the phosphorylation status and abundance of specific proteins (FoxO1, Akt, PP2A, and TRB3) (Figs. 1, 8ndash10). Since Elovl5 had no effect on the phosphorylation status of IRS2 or PDK1/2 (supplementary Fig. III), we speculate that elevated Elovl5 activity does not enhance insulin signaling through the insulin receptor-IRS-PDK pathway. Instead, elevated Elovl5 activity increased Tyr-307 phosphorylation in the catalytic unit of PP2A (Fig. 9E). Phosphorylation of Tyr 307 has been linked to decreased phosphatase activity directed at Akt and FoxO1 (37). Elevated Akt phosphorylation enhances Akt activity, while elevated FoxO1 phosphorylation promotes its proteasomal degradation.
Other regulatory factors involved in gluconeogenesis include TRB3 and CTMP, two negative regulators of Akt activity (34). Elevated Elovl5 activity attenuates cellular content of TRB3 (Fig. 9C) but did not impact hepatic CTMP levels in fasted mice (Fig. 9D). Although TRB3 is regulated by PPARα and Elovl5 attenuates PPARα activity (10), TRB3 mRNA was among a subset of PPARα-regulated genes that was not affected by elevated Elovl5 activity (Fig. 6). Cell levels of TRB3 are regulated through other mechanisms, like proteasomal degradation (39). Future studies will focus on defining mechanisms for Elovl5 control of PPARα function and TRB3 cellular abundance.
An unresolved issue is full understanding of the molecular linkage between changes in hepatic Elovl5 activity and the control of hepatic TRB3 content, PPARα function, and PP2A phosphorylation (Fig. 10). Elevated Elovl5 activity induces a 2- to 4-fold increase in low-abundance C20-22 PUFA, including 20:3,n-6 and 22:4,n-6 (Fig. 4C). While these changes are detected in total hepatic lipid extracts, they are not seen in microsomal (ER) or plasma lipids. We suspect these fatty acids are likely assimilated into membrane phospholipids. Twenty-two carbon PUFA are poor activators of PPARα (40). While this observation can explain some of the Elovl5 effects on PPARα-regulated genes (Figs. 5, 6), it cannot explain the Elovl5 regulation of the phosphorylation status of key proteins (Akt, Gsk3β, PP2A) or hepatic TRB3 abundance. Enrichment of membranes with C20-22 PUFA may affect specific signaling pathways (41, 42). Studies with human retinal endothelial cells provide one possible scenario. Increased docosahexaenoic acid (DHA, 22:6,n-3) content in cell membranes was linked to decreased levels of cholesterol and Src kinases (Fyn and c-Yes) in lipid rafts, as well as decreased expression of adhesion molecules (ICAM and VCAM) through an NFκB-mediated mechanism (43–46). PP2A phosphorylation at Tyr-307 is regulated by Src-kinases and protein phosphotyrosine phosphatases (38). Additional studies are required to determine whether C20-22 PUFA induced by elevated Elovl5 activity affects membrane lipid composition and cell signaling.
In contrast to high-fat-diet-induced obesity and diabetes, streptozotocin-induced diabetes rapidly destroys β-cells and lowers plasma insulin. Hepatic Elovl5 mRNA and enzyme activity is not affected in this model of diabetes (7). As such, hyperglycemia in insulin-dependent diabetes is not linked to hepatic Elovl5 activity. Recent unpublished studies in our lab indicate that inhibition of acetyl CoA carboxylase (ACC) abrogates fatty acid elongation. Acetyl CoA carboxylase activity is suppressed in insulin-dependent diabetes (47, 48). Thus, the availability of malonyl CoA for fatty acid elongation may be as important as elongase expression in controlling elongase function. Elevating hepatic Elovl5 activity would likely not improve blood glucose control because malonyl CoA remains limiting in the insulin-dependent diabetic.
In addition to effects on blood glucose and proteins involved in gluconeogenesis, elevated hepatic Elovl5 regulates hepatic glycogen (Table 2). The effect of Elovl5 on hepatic glycogen is influenced by the diet. In chow and low-fat diets, Elovl5 induces a modest but significant increase in fasting glycogen content (10). The high-fat, low-carbohydrate diet also significantly increased hepatic glycogen content in fasted mice (28) (Table 2). Elevated hepatic Elovl5 activity lowers hepatic glycogen. The effect of Elovl5 on hepatic glycogen is comparable to that seen with elevated expression of malonyl CoA decarboxylase (MCD) (28). Elevated Elovl5 activity, however, does not induce MCD mRNA (not shown). Effects of diet and Elovl5 on fasting hepatic glycogen can be explained, at least in part, by changes in the phosphorylation status of Akt (Fig. 8) and Gsk3β (supplementary Fig. II).
It is unlikely that all of the effects of Elovl5 on the control of blood glucose in obese fasted mice can be explained by control of hepatic gluconeogenic gene expression. Recent studies have established that fasting blood glucose levels are not associated with increased Pck1 or G6Pc expression (49, 50). Moreover, studies in obese humans indicate that a significant fraction of blood glucose in fasting is derived from whole-body protein catabolism (51). While our studies establish that elevated Elovl5 activity improves blood glucose levels in high-fat-fed obese mice (Fig. 3), additional studies are required to define the role whole-body protein catabolism plays in Elovl5-mediated control of blood glucose.
Finally, mice fed high-fat diet develop fatty liver; i.e., the accumulation of triglyceride (Table 2) (7). Mice with ablated Elovl5 also develop fatty liver, at least in part from increased levels of SREBP-1 in nuclei and induction of lipogenic gene expression (17). While elevated Elovl5 activity lowers hepatic nuclear SREBP-1 in mice fed the low-fat diet, mice fed the high-fat diets have suppressed levels of hepatic SREBP-1 content (7)(supplementary Fig. III). As such, fatty liver in high-fat-fed mice is not due to SREBP1-mediated induction of de novo lipogenesis. Moreover, there is no significant difference in nuclear SREBP-1 content in obese mice infected with Ad-Luc or Ad-Elovl5. Yet, hepatic triglycerides in nonobese mice and obese mice with elevated hepatic Elovl5 activity are not significantly different (Table 2). The Elovl5 effect on hepatic triglyceride content is likely targeted elsewhere, such as fatty acid oxidation or triglyceride assembly or VLDL secretion. In this regard, our studies provide some clues to explain this mechanism. Low levels of plasma β-hydroxybutyrate in fasting Ad-Luc infected obese mice reflect problems with fatty acid oxidation (Table 2). Restoration of β-hydroxybutyrate to normal levels following induction of hepatic Elovl5 activity may indicate enhanced fatty acid oxidation. FoxO1 regulates hepatic triglyceride and VLDL metabolism by controlling the expression of microsomal transfer protein (MTTP) (52), a key protein involved in VLDL assembly, and ApoC3 expression, a key protein involved in VLDL clearance (52, 53). Preliminary studies show that elevated Elovl5 activity suppresses MTTP and ApoC3 mRNA abundance by over 50% (not shown). By controlling FoxO1 nuclear abundance, Elovl5 regulates both carbohydrate and triglyceride metabolism.
SUMMARY
High-fat diets induce hyperglycemia, glucose intolerance, and increased hepatic content of glycogen and triglyceride. High-fat diets also suppress hepatic Elovl5 enzyme activity. Modest elevation of hepatic Elovl5 activity in obese mice is sufficient to restore euglycemia and lower hepatic glycogen and triglyceride to levels seen in nonobese mice. Under the conditions of this study, Elovl5 does not significantly affect body weight (Table 2). The mechanism for these changes involves, at least in part, suppression in the nuclear abundance of transcription factors (FoxO1, PGC1α) and the regulation of cell signaling pathways (Akt, Gsk3β, PP2A) controlling gluconeogenesis and triglyceride metabolism. These studies establish a link between fatty acid elongation and hepatic glucose and triglyceride metabolism and suggest a role for regulators of Elovl5 activity in the treatment of diet-induced hyperglycemia and fatty liver.
Supplementary Material
Acknowledgments
The authors appreciate the excellent technical assistance of Karin Hardin.
Footnotes
Abbreviations:
- ApoC2
- apolipoprotein C2
- ApoC3
- apolipoprotein C3
- ACOT1
- acyl CoA thioesterase-1
- c/EBPα
- CCAAT/enhancer binding protein α
- ChREBP
- carbohydrate regulatory element binding protein
- CTRC2
- CREB-regulated transcription co-activator 2
- CTMP
- C-terminal modulator protein
- CYP4A10
- cytochrome P450 4 A10
- Elovl
- elongation of long chain fatty acid
- Elovl2
- fatty acid elongase-2
- Elovl5
- fatty acid elongase-5
- Elovl6
- fatty acid elongase-6
- FADS1
- Δ5-fatty acid desaturase
- FADS2
- Δ6-fatty acid desaturase
- FGF21
- fibroblast growth factor 21
- FoxO1
- forkhead box O1
- G6Pc
- glucose-6 phosphatase, catalytic unit
- Gsk3β
- glycogen synthase-3β
- HADHA
- hydroxyacyl-coenzyme A dehydrogenase/3-ketoacyl-Coenzyme A thiolase/enoyl-coenzyme A hydratase (trifunctional protein), alpha subunit
- HS2
- HMG CoA synthase 2
- HNF4α
- hepatic nuclear protein 4α
- HOMA-IR
- homeostasis model assessment of insulin resistance
- Luc
- luciferase; MLX, max-like factor X
- PepCk (Pck1)
- phosphoenolpyruvate carboxykinase
- Pcx
- pyruvate carboxylase
- PP2A
- protein phosphatase 2A
- PPARα
- peroxisome proliferator activated receptor α
- PGC1α
- peroxisome proliferator activated receptor γ co-activator 1α
- SIRT1
- sirtuin 1
- SCD1
- stearoyl CoA desaturase-1
- SREBP-1
- sterol regulatory element binding protein-1
- TBP
- TATA-binding protein
- TRB3
- tribbles-related protein B3
The online version of this article (available at http://www.jlr.org) contains supplementary data in the form of four figures.
REFERENCES
- 1.Cinti D. L., Cook L., Nagi M. N., Suneja S. K. 1992. The fatty acid chain elongation system of mammalian endoplasmic reticulum. Prog. Lipid Res. 31: 1–51. [DOI] [PubMed] [Google Scholar]
- 2.Jakobsson A., Westerberg R., Jacobsson A. 2006. Fatty acid elongases in mammals: their regulation and role in metabolism. Prog. Lipid Res. 45: 237–249. [DOI] [PubMed] [Google Scholar]
- 3.Leonard A. E., Pereira S. L., Sprecher H., Huang Y. S. 2004. Elongation of long-chain fatty acids. Prog. Lipid Res. 43: 36–54. [DOI] [PubMed] [Google Scholar]
- 4.Denic V., Weissman J. S. 2007. A molecular caliper mechanism for determining very long-chain fatty acid length. Cell. 130: 663–677. [DOI] [PubMed] [Google Scholar]
- 5.Moon Y. A., Horton J. D. 2003. Identification of two mammalian reductases involved in the two-carbon fatty acyl elongation cascade. J. Biol. Chem. 278: 7335–7343. [DOI] [PubMed] [Google Scholar]
- 6.Cook H. W. 1985. Fatty acid desaturation and chain elongation in eucaryotes. Biochemistry of Lipids and Membranes. Vance D. E., Vance J. E., Benjamin Cummings Publishing Co, Don Mill, ON: 181–212. [Google Scholar]
- 7.Wang Y., Botolin D., Xu J., Christian B., Mitchell E., Jayaprakasam B., Nair M. G., Peters J. M., Busik J. V., Olson L. K., et al. 2006. Regulation of hepatic fatty acid elongase and desaturase expression in diabetes and obesity. J. Lipid Res. 47: 2028–2041. [DOI] [PMC free article] [PubMed] [Google Scholar]
- 8.Wang Y., Botolin D., Christian B., Busik J., Xu J., Jump D. B. 2005. Tissue-specific, nutritional, and developmental regulation of rat fatty acid elongases. J. Lipid Res. 46: 706–715. [DOI] [PMC free article] [PubMed] [Google Scholar]
- 9.Moon Y. A., Shah N. A., Mohapatra S., Warrington J. A., Horton J. D. 2001. Identification of a mammalian long chain fatty acyl elongase regulated by sterol regulatory element-binding proteins. J. Biol. Chem. 276: 45358–45366. [DOI] [PubMed] [Google Scholar]
- 10.Wang Y., Torres-Gonzalez M., Tripathy S., Botolin D., Christian B., Jump D. B. 2008. Elevated hepatic fatty acid elongase-5 activity affects multiple pathways controlling hepatic lipid and carbohydrate composition. J. Lipid Res. 49: 1538–1552. [DOI] [PMC free article] [PubMed] [Google Scholar]
- 11.Sprecher H. 2000. Metabolism of highly unsaturated n-3 and n-6 fatty acids. Biochim. Biophys. Acta. 1486: 219–231. [DOI] [PubMed] [Google Scholar]
- 12.Westerberg R., Mansson J. E., Golozoubova V., Shabalina I. G., Backlund E. C., Tvrdik P., Retterstol K., Capecchi M. R., Jacobsson A. 2006. ELOVL3 is an important component for early onset of lipid recruitment in brown adipose tissue. J. Biol. Chem. 281: 4958–4968. [DOI] [PubMed] [Google Scholar]
- 13.Jump D. B., Botolin D., Wang Y., Xu J., Demeure O., Christian B. 2008. Docosahexaenoic acid (DHA) and hepatic gene transcription. Chem. Phys. Lipids. 153: 3–13. [DOI] [PMC free article] [PubMed] [Google Scholar]
- 14.Jump D. B. 2008. N-3 polyunsaturated fatty acid regulation of hepatic gene transcription. Curr. Opin. Lipidol. 19: 242–247. [DOI] [PMC free article] [PubMed] [Google Scholar]
- 15.Jump D. B. 2004. Fatty acid regulation of gene transcription. Crit. Rev. Clin. Lab. Sci. 41: 41–78. [DOI] [PubMed] [Google Scholar]
- 16.Matsuzaka T., Shimano H., Yahagi N., Kato T., Atsumi A., Yamamoto T., Inoue N., Ishikawa M., Okada S., Ishigaki N., et al. 2007. Crucial role of a long-chain fatty acid elongase, Elovl6, in obesity-induced insulin resistance. Nat. Med. 13: 1193–1202. [DOI] [PubMed] [Google Scholar]
- 17.Moon Y. A., Hammer R. E., Horton J. D. 2008. Deletion of ELOVL5 leads to fatty liver through activation of SREBP-1c in mice. J. Lipid Res. 50: 412–423. [DOI] [PMC free article] [PubMed] [Google Scholar]
- 18.Yang J., Kong X., Martins-Santos M. E., Aleman G., Chaco E., Liu G. E., Wu S. Y., Samols D., Hakimi P., Chiang C. M., et al. 2009. Activation of SIRT1 by resveratrol represses transcription of the gene for the cytosolic form of phosphoenolpyruvate carboxykinase (GTP) by deacetylating hepatic nuclear factor 4alpha. J. Biol. Chem. 284: 27042–27053. [DOI] [PMC free article] [PubMed] [Google Scholar]
- 19.Rhee J., Inoue Y., Yoon J. C., Puigserver P., Fan M., Gonzalez F. J., Spiegelman B. M. 2003. Regulation of hepatic fasting response by PPARgamma coactivator-1alpha (PGC-1): requirement for hepatocyte nuclear factor 4alpha in gluconeogenesis. Proc. Natl. Acad. Sci. USA. 100: 4012–4017. [DOI] [PMC free article] [PubMed] [Google Scholar]
- 20.Zhang W., Patil S., Chauhan B., Guo S., Powell D. R., Le J., Klotsas A., Matika R., Xiao X., Franks R., et al. 2006. FoxO1 regulates multiple metabolic pathways in the liver: effects on gluconeogenic, glycolytic, and lipogenic gene expression. J. Biol. Chem. 281: 10105–10117. [DOI] [PubMed] [Google Scholar]
- 21.Cassuto H., Kochan K., Chakravarty K., Cohen H., Blum B., Olswang Y., Hakimi P., Xu C., Massillon D., Hanson R. W., et al. 2005. Glucocorticoids regulate transcription of the gene for phosphoenolpyruvate carboxykinase in the liver via an extended glucocorticoid regulatory unit. J. Biol. Chem. 280: 33873–33884. [DOI] [PubMed] [Google Scholar]
- 22.Koo S. H., Satoh H., Herzig S., Lee C. H., Hedrick S., Kulkarni R., Evans R. M., Olefsky J., Montminy M. 2004. PGC-1 promotes insulin resistance in liver through PPAR-alpha-dependent induction of TRB-3. Nat. Med. 10: 530–534. [DOI] [PubMed] [Google Scholar]
- 23.Potthoff M. J., Inagaki T., Satapati S., Ding X., He T., Goetz R., Mohammadi M., Finck B. N., Mangelsdorf D. J., Kliewer S. A., et al. 2009. FGF21 induces PGC-1alpha and regulates carbohydrate and fatty acid metabolism during the adaptive starvation response. Proc. Natl. Acad. Sci. USA. 106: 10853–10858. [DOI] [PMC free article] [PubMed] [Google Scholar]
- 24.Puigserver P., Rhee J., Donovan J., Walkey C. J., Yoon J. C., Oriente F., Kitamura Y., Altomonte J., Dong H., Accili D., et al. 2003. Insulin-regulated hepatic gluconeogenesis through FOXO1-PGC-1alpha interaction. Nature. 423: 550–555. [DOI] [PubMed] [Google Scholar]
- 25.Matsumoto M., Pocai A., Rossetti L., Depinho R. A., Accili D. 2007. Impaired regulation of hepatic glucose production in mice lacking the forkhead transcription factor Foxo1 in liver. Cell Metab. 6: 208–216. [DOI] [PubMed] [Google Scholar]
- 26.Aoki M., Jiang H., Vogt P. K. 2004. Proteasomal degradation of FoxO1 transcriptional regulator in cells transformed by P3K and Akt oncoproteins. Proc. Natl. Acad. Sci. USA. 101: 13613–13617. [DOI] [PMC free article] [PubMed] [Google Scholar]
- 27.Guo S., Rena G., Cichy S., He X., Cohen P., Unterman T. 1999. Phosphorylation of serine 256 by protein kinase B disrupts transactivation by FKHR and mediates effects of insulin on insulin-like growth factor-binding protein-1 promoter activity through a conserved insulin response sequence. J. Biol. Chem. 274: 17184–17192. [DOI] [PubMed] [Google Scholar]
- 28.An J., Muoio D. M., Shiota M., Fujimoto Y., Cline G. W., Shulman G. I., Koves T. R., Stevens R., Millington D., Newgard C. B. 2004. Hepatic expression of malonyl CoA decarboxylase reverses muscle, liver and whole animal insulin resistance. Nat. Med. 10: 268–274. [DOI] [PubMed] [Google Scholar]
- 29.Yoon J. C., Puigserver P., Chen G., Donovan J., Wu Z., Rhee J., Adelmant G., Stafford J., Kahn C. R., Granner D. K., et al. 2001. Control of hepatic gluconeogenesis through the transcriptional coactivator PGC-1. Nature. 413: 131–138. [DOI] [PubMed] [Google Scholar]
- 30.Inagaki T., Dutchak P., Zhao G., Ding X., Gautron L., Parameswara V., Li Y., Goetz R., Mohammadi M., Esser V., et al. 2007. Endocrine regulation of the fasting response by PPARalpha-mediated induction of fibroblast growth factor 21. Cell Metab. 5: 415–425. [DOI] [PubMed] [Google Scholar]
- 31.Raymer B., Kavana M., Price A., Wang B., Corcoran L., Kulathila R., Groarke J., Mann T. 2009. Synthesis and characterization of a BODIPY-labeled derivative of Soraphen A that binds to acetyl-CoA carboxylase. Bioorg. Med. Chem. Lett. 19: 2804–2807. [DOI] [PubMed] [Google Scholar]
- 32.Daitoku H., Yamagata K., Matsuzaki H., Hatta M., Fukamizu A. 2003. Regulation of PGC-1 promoter activity by protein kinase B and the forkhead transcription factor FKHR. Diabetes. 52: 642–649. [DOI] [PubMed] [Google Scholar]
- 33.Matsuzaki H., Daitoku H., Hatta M., Tanaka K., Fukamizu A. 2003. Insulin-induced phosphorylation of FKHR (FoxO1) targets to proteasomal degradation. Proc. Natl. Acad. Sci. U.S.A. 100: 11285–11290. [DOI] [PMC free article] [PubMed] [Google Scholar]
- 34.Du K., Herzig S., Kulkarni R. N., Montminy M. 2003. TRB3: a tribbles homolog that inhibits Akt/PKB activation by insulin in liver. Science. 300: 1574–1577. [DOI] [PubMed] [Google Scholar]
- 35.Maira S. M., Galetic I., Brazil D. P., Kaech S., Ingley E., Thelen M., Hemmings B. A. 2001. Carboxyl-terminal modulator protein (CTMP), a negative regulator of PKB/Akt and v-Akt at the plasma membrane. Science. 294: 374–380. [DOI] [PubMed] [Google Scholar]
- 36.Ugi S., Imamura T., Maegawa H., Egawa K., Yoshizaki T., Shi K., Obata T., Ebina Y., Kashiwagi A., Olefsky J. M. 2004. Protein phosphatase 2A negatively regulates insulin's metabolic signaling pathway by inhibiting Akt (protein kinase B) activity in 3T3L1 adipocytes. Mol. Cell. Biol. 24: 8778–8789. [DOI] [PMC free article] [PubMed] [Google Scholar]
- 37.Yan L., Lavin V. A., Moser L. R., Cui Q., Kanies C., Yang E. 2008. PP2A regulates the pro-apoptotic activity of FOXO1. J. Biol. Chem. 283: 7411–7420. [DOI] [PMC free article] [PubMed] [Google Scholar]
- 38.Chen J., Martin B. L., Brautigan D. L. 1992. Regulation of protein serine-threonine phosphatase type-2A by tyrosine phosphorylation. Science. 257: 1261–1264. [DOI] [PubMed] [Google Scholar]
- 39.Zhou Y., Li L., Liu Q., Xing G., Kuai X., Sun J., Yin X., Wang J., Zhang L., He F. 2008. E3 ubiquitin ligase SIAH1 mediates ubiquitination and degradation of TRB3. Cell. Signal. 20: 942–948. [DOI] [PubMed] [Google Scholar]
- 40.Pawar A., Jump D. B. 2003. Unsaturated fatty acid regulation of peroxisome proliferator-activated receptor alpha activity in rat primary hepatocytes. J. Biol. Chem. 278: 35931–35939. [DOI] [PubMed] [Google Scholar]
- 41.Jump D. B. 2002. The biochemistry of n-3 polyunsaturated fatty acids. J. Biol. Chem. 277: 8755–8758. [DOI] [PubMed] [Google Scholar]
- 42.Stulnig T. M., Huber J., Leitinger N., Imre E. M., Angelisova P., Nowotny P., Waldhausl W. 2001. Polyunsaturated eicosapentaenoic acid displaces proteins from membrane rafts by altering raft lipid composition. J. Biol. Chem. 276: 37335–37340. [DOI] [PubMed] [Google Scholar]
- 43.Chen W., Jump D. B., Esselman W. J., Busik J. V. 2007. Inhibition of cytokine signaling in human retinal endothelial cells through modification of caveolae/lipid rafts by docosahexaenoic acid. Invest. Ophthalmol. Vis. Sci. 48: 18–26. [DOI] [PMC free article] [PubMed] [Google Scholar]
- 44.Chen W., Esselman W. J., Jump D. B., Busik J. V. 2005. Anti-inflammatory effect of docosahexaenoic acid on cytokine-induced adhesion molecule expression in human retinal vascular endothelial cells. Invest. Ophthalmol. Vis. Sci. 46: 4342–4347. [DOI] [PMC free article] [PubMed] [Google Scholar]
- 45.Chen W., Jump D. B., Grant M. B., Esselman W. J., Busik J. V. 2003. Dyslipidemia, but not hyperglycemia, induces inflammatory adhesion molecules in human retinal vascular endothelial cells. Invest. Ophthalmol. Vis. Sci. 44: 5016–5022. [DOI] [PubMed] [Google Scholar]
- 46.Tikhonenko M., Lydic T., Wang Y., Chen W., Opreanu M., Sochacki A., McSorley K. M., Renis R. L., Kern T., Jump D. B., et al. 2010. Remodeling of retinal fatty acids in an animal model of diabetes. A decrease in long chain PUFA is associated with a decrease in fatty acid elongases Elovl2 and Elovl4. Diabetes. 59: 219–227. [DOI] [PMC free article] [PubMed] [Google Scholar]
- 47.Abu-Elheiga L., Matzuk M. M., Kordari P., Oh W., Shaikenov T., Gu Z., Wakil S. J. 2005. Mutant mice lacking acetyl-CoA carboxylase 1 are embryonically lethal. Proc. Natl. Acad. Sci. USA. 102: 12011–12016. [DOI] [PMC free article] [PubMed] [Google Scholar]
- 48.Sakamoto K., McCarthy A., Smith D., Green K. A., Grahame Hardie D., Ashworth A., Alessi D. R. 2005. Deficiency of LKB1 in skeletal muscle prevents AMPK activation and glucose uptake during contraction. EMBO J. 24: 1810–1820. [DOI] [PMC free article] [PubMed] [Google Scholar]
- 49.Samuel V. T., Beddow S. A., Iwasaki T., Zhang X. M., Chu X., Still C. D., Gerhard G. S., Shulman G. I. 2009. Fasting hyperglycemia is not associated with increased expression of PEPCK or G6Pc in patients with Type 2 Diabetes. Proc. Natl. Acad. Sci. USA. 106: 12121–12126. [DOI] [PMC free article] [PubMed] [Google Scholar]
- 50.Burgess S. C., He T., Yan Z., Lindner J., Sherry A. D., Malloy C. R., Browning J. D., Magnuson M. A. 2007. Cytosolic phosphoenolpyruvate carboxykinase does not solely control the rate of hepatic gluconeogenesis in the intact mouse liver. Cell Metab. 5: 313–320. [DOI] [PMC free article] [PubMed] [Google Scholar]
- 51.Chevalier S., Burgess S. C., Malloy C. R., Gougeon R., Marliss E. B., Morais J. A. 2006. The greater contribution of gluconeogenesis to glucose production in obesity is related to increased whole-body protein catabolism. Diabetes. 55: 675–681. [DOI] [PubMed] [Google Scholar]
- 52.Kamagate A., Qu S., Perdomo G., Su D., Kim D. H., Slusher S., Meseck M., Dong H. H. 2008. FoxO1 mediates insulin-dependent regulation of hepatic VLDL production in mice. J. Clin. Invest. 118: 2347–2364. [DOI] [PMC free article] [PubMed] [Google Scholar]
- 53.Altomonte J., Cong L., Harbaran S., Richter A., Xu J., Meseck M., Dong H. H. 2004. Foxo1 mediates insulin action on apoC-III and triglyceride metabolism. J. Clin. Invest. 114: 1493–1503. [DOI] [PMC free article] [PubMed] [Google Scholar]
- 54.Jump D. B. 2009. Mammalian fatty acid elongases. Methods Mol. Biol. 579: 375–389. [DOI] [PMC free article] [PubMed] [Google Scholar]
Associated Data
This section collects any data citations, data availability statements, or supplementary materials included in this article.