

Abstract
The formation of an internal barrier to the diffusion of small molecules in the lens during middle age is hypothesized to be a key event in the development of age-related nuclear (ARN) cataract. Changes in membrane lipids with age may be responsible. In this study, we investigated the effect of age on the distribution of sphingomyelins, the most abundant lens phospholipids. Human lens sections were initially analyzed by MALDI mass spectrometry imaging. A distinct annular distribution of the dihydrosphingomyelin, DHSM (d18:0/16:0), in the barrier region was observed in 64- and 70-year-old lenses but not in a 23-year-old lens. An increase in the dihydroceramide, DHCer (d18:0/16:0), in the lens nucleus was also observed in the older lenses. These findings were supported by ESI mass spectrometry analysis of lipid extracts from lenses dissected into outer, barrier, and nuclear regions. A subsequent analysis of 18 lenses ages 20–72 years revealed that sphingomyelin levels increased with age in the barrier region until reaching a plateau at approximately 40 years of age. Such changes in lipid composition will have a significant impact on the physical properties of the fiber cell membranes and may be associated with the formation of a barrier.
Keywords: cataract, MALDI imaging, sphingomyelin, dihydrosphingomyelin, phospholipid, ceramide, dihydroceramide, lipidomics
Due to a lack of turnover (1), the lens is an ideal tissue for examining age-related changes to biomolecules, and characterizing these can have clinical relevance for understanding the molecular basis of ocular conditions such as presbyopia (2) and nuclear cataract (3, 4).
It is not known which are the critical factors predisposing the human lens to age-related nuclear (ARN) cataract. Research from one of us, over many years, suggests that the formation of an internal barrier to the diffusion of small molecules may be a key event in the onset of this pathology (5, 6). The barrier forms in the normal lens at middle age and uncouples the center of the lens from the metabolically active outer region. Because the lens grows continuously throughout life, the outmost part of the lens is the region that was formed most recently and has the highest concentration of active enzymes (7, 8). It is where the major antioxidant glutathione (GSH) is synthesized and the oxidized form of glutathione rereduced (9, 10). Since GSH is essential for maintaining a reducing environment in the lens center and for protection of protein structure, formation of the barrier allows oxidative modification of nuclear proteins that is the hallmark of nuclear cataract. The dimensions of the barrier region (7 mm equatorial × 3 mm axial) corresponds to the part of the adult lens that was synthesized immediately after birth (11, 12).
Recent data implicate the binding of denatured proteins to the fiber cell membrane as the mechanism responsible for the barrier (13), possibly by occluding the membrane pores that normally facilitate the movement of GSH and water from cell to cell via connexon (14) and aquaporin 0 (15) channels, respectively. Moreover, aquaporin 0 requires interaction with distinct membrane lipids to form its correct functional conformation (15). If interactions with fiber cell membranes are involved in barrier formation, it is clearly important to characterize age-related changes to membrane composition.
This study employed matrix-assisted laser desorption ionization (MALDI) imaging and electrospray-ionization mass spectrometry (ESI-MS) to examine the phospholipid composition within defined regions of the human lens.
METHODS
Lens preparation for MALDI analysis
Human lenses (ages 23–70, male) were obtained from the Sydney Lions Eye Bank, Sydney, NSW, Australia. All work was approved by the human research ethics committees at the University of Sydney (#7292) and the University of Wollongong (HE 99/001). Lenses were sliced using a cryostat (Leica, 1720) at −20°C. Sufficient TissueTekTM was applied to adhere the lens to the cutting block in the correct orientation (i.e., the lens was not completely submerged in TissueTekTM). Transverse slices of the lenses (10–25 μm thick) were placed directly onto glass cover slips and stored at −20°C until analyzed.
MALDI imaging
Imaging of human lens lipids was executed as previously described for other tissues (16). In brief, double-sided, heat-conducting tape was used to adhere the underside of each glass cover slip to a steel plate. The steel plate was inverted and placed on the cold finger of a glass sublimation device with the lens slice exposed, and dihydroxybenzoic acid (275 mg) was sublimed for 11 min. Following sublimation of the matrix, the heat-conducting tape was removed, and the lens slices were analyzed using a QSTAR XLTM (Applied Biosystems/MDS Sciex, Thornhill, Ontario, Canada) quadrupole-TOF mass spectrometer fitted with an orthogonal MALDI source. Positive ion images m/z 350–1000 were obtained using a spatial resolution of 50 μm. Mass spectra were acquired using 10 laser pulses per image spot with a 0.5 s accumulation time. Collision-induced dissociation was used for structural confirmation of abundant lipids observed with sphingomyelin ions identified by the observation of the characteristic phosphocholine fragment ion at m/z 184. Data were analyzed using Applied Biosystems Analyst QSTM and BiomapsTM version 3.7.5.5 software (Novartis, Basel, Switzerland).
Averaged MALDI spectra for the outer, barrier, and nuclear regions of the lens were obtained by selecting the region of interest (ROI) according to the dimensions shown in Fig. 1B within the BiomapsTM software. The counts of the [DHSM (d18:0/ 16:0) + H]+ (m/z 705) and [DHCer (d18:0/16:0) + H]+ (m/z 540) ions obtained from these regionally averaged spectra were used to create graphs (see Fig. 6A, C, E, G).
Fig. 1.

The three regions of the lens (nucleus, barrier and outer) shown in coronal (A) and transverse (B) sections. Abbreviations: b, barrier; n, nucleus; o, outer.
Fig. 6.

A comparison of the ion abundance of [DHSM (d18:0/ 16:0) + H]+ obtained from MALDI analysis of lens slices from (A) 23-year-old and (C) 70-year-old males compared with an ESI-MS analysis of sectioned whole lenses from (B) 31-year-old and (D) 73-year-old males. A comparison of the ion abundance of [DHCer (d18:0/16:0) + H]+ obtained from MALDI analysis of lens slices from (E) 23-year-old and (G) 70-year-old males compared with an ESI-MS analysis of sectioned whole lenses from (F) 31-year-old and (H) 73-year-old males. *Ion abundance is presented as an average ion count. #Ion abundance is presented as a fraction of the internal standard for that lipid class. Abbreviations: DHCer, dihydroceramide; DHSM, dihydrosphingomyelin.
Regional dissection of lenses
Two pairs of human lenses (31 and 73 years old) were sectioned into three regions as shown in Fig. 1A. In brief, frozen decapsulated human lenses were sectioned axially using cold trephines into nuclear, barrier, and outer regions of radius 3, 4, and ≥4.5 mm, respectively. The lens regions from each pair were combined and the sphingolipids were extracted as described below.
Sphingolipid extraction
Sphingolipids from the three lens regions were extracted by the method of Sullards et al. (17) with minor modification. In brief, lenses were weighed and 2 ml of methanol:chloroform was added to glass tubes containing each lens section. A methanolic solution containing 75 µM each of the internal standards Cer (d18:1/17:0) and DHSM (d18:0/12:0) was added to the tissues at 1.4 µl per milligram of lens tissue. The samples were sonicated and incubated at 48°C overnight. After cooling, methanolic potassium hydroxide (150 µl, 1 M) was added to each tube prior to incubation at 37°C for 2 h. After the tubes had cooled, 6 µl of glacial acetic acid was added, followed by 1 ml of chloroform and 2 ml of Milli QTM water. The solution was then gently mixed and centrifuged at 2000 g for 5 min. The upper layer was removed and discarded, and the remaining phase was evaporated to dryness under nitrogen at 37°C. The dried sphingolipid extract was then reconstituted in 200 µl of chloroform and stored at −80°C until analysis.
ESI-MS of lens sphingolipids
Each sphingolipid extract was diluted with 2:1 methanol: chloroform, and aqueous ammonium acetate (1 M) was added at 50 µl·ml−1. Samples were infused into the electrospray ion source at a flow rate of 10 μl·min−1 using the instrument's onboard syringe pump and mass spectra acquired as previously described (18). All mass spectra were obtained using a Waters QuattroMicroTM (Waters, Manchester, UK) equipped with a z-spray electrospray ion source and controlled by Micromass MasslynxTM version 4.0 software. Capillary voltage was set to 3000 V, source temperature to 80°C, and desolvation temperature to 120°C. Cone voltage was set to −50 V and 35 V in negative and positive ion modes, respectively. Nitrogen was used as the drying gas at a flow rate of 320 l·h−1 and argon as the collision gas at a pressure of 3 mTorr. Dihydrosphingomyelins were identified by precursor ion scans in positive ion mode for both the phosphocholine headgroup (m/z 184 at collision energy 35 eV) and the d18:0 sphingoid base (m/z 266 at collision energy 50 eV). DHSM (d18:0/16:0) ion abundances are presented as a fraction of the DHSM (d18:0/12:0) internal standard using m/z 184 precursor ion scans. Ceramides and dihydroceramides were characterized by neutral loss scans for 256 and 258 Da (respectively) in negative ion mode using a collision energy of 35 eV. DHCer (d18:0/16:0) ion abundances are presented as a fraction of the Cer (d18:1/17:0) internal standard using negative ion mass spectra. All ion abundances were calculated after correction for isotope contributions.
LC-MS analysis of sphingolipid extracts
Liquid chromatography-mass spectrometry (LC-MS) analysis was conducted on the sphingolipid extracts (see above) for further confirmation of the ceramide and sphingolipid components. These experiments were carried out on an AB 2000 triple quadrupole mass spectrometer (Applied Biosystems/MDS Sciex, Thornhill, Ontario, Canada) in precursor ion scanning mode (positive ions) monitoring m/z 184 (sphingomyelin), m/z 264 (ceramide), and m/z 266 (dihydroceramide) sequentially within one high-performance liquid chromatography (HPLC) analysis. The following instrument conditions were used: ion spray voltage = 5500 V; declustering potential = 80 V; focusing potential = 250 V; and collision energy = 35 V. Normal phase HPLC conditions were applied to fully separate ceramides from sphingomyelin molecules as described by Sullards et al. (17). Briefly, HPLC conditions involved a 150 × 2.0 mm, 3 μm particle size Ultremex NH2 HPLC column (Phenomenex; Torrance, CA), flow rate 200 ml·min−1, solvent “A” composed of CH3CN/CH3OH/CH3COOH (97:2:1 v:v:v) with 5 mM ammonium acetate; “B” composed of CH3OH/CH3COOH (99:1 v:v) with 5 mM ammonium acetate; gradient elution starting at 2% B isocratic for 5 min, increasing linearly to 95% B in 10 min, then returning to 2% B in 1 min.
Analysis of barrier region total sphingomyelin
Human lenses (n = 18) between the ages of 20 and 72 years were sectioned into regions as described above, in accordance with Heys et al. (19). The barrier regions were homogenized and then fractionated on sucrose gradients as part of a study to investigate the effect of age on the membrane binding of proteins (13). Total lipids from each sucrose band were then extracted by the method of Folch (20) with minor modifications (18). Identification and quantification of sphingomyelins in these extracts was performed using ESI-MS/MS analysis as described above.
RESULTS
Imaging of lens sphingolipids
Previous analyses from our laboratory (and others) have shown that the dihydrosphingomyelin DHSM (d18:0/16:0) is the most abundant phospholipid in the human lens, representing more than 25% of detectable phospholipids (18, 21, 22). Fig. 2A shows a representative positive ion MALDI mass spectrum acquired from tissue sliced from a 70-year-old human lens. The most abundant ions present are those of dehydrated cholesterol (m/z 369) and the protonated (m/z 705), sodiated (m/z 727), and potassiated (m/z 743) ions of dihydrosphingomyelin 16:0. The identity of the ion at m/z 705 was confirmed by acquisition of a collision-induced dissociation (CID) mass spectrum that revealed the phosphocholine cation (m/z 184) as the major product ion (Fig. 2B). The variation in abundance of the m/z 705 ion across tissue slices from one young (23 years old) and two old (64 and 70 years old) human lenses is displayed in Fig. 3. Similar patterns were observed for the corresponding [M+Na]+ and [M+K]+ ions (supplementary Figs. I and IV), suggesting that these images are representative of the distribution of the lipid within the tissue. The data in Fig. 3 indicate that while the distribution of DHSM (d18:0/16:0) is relatively homogeneous in the 23-year-old lens, there is a distinct annular distribution of this lipid observed in both older lenses. MALDI analysis of lens tissue also revealed a low-abundance ion at m/z 815 corresponding to the [M+H]+ ion of the long-chain dihydrosphingomyelin, DHSM (d18:0/24:1). Although the ion abundance was too low to confirm the assignment directly by CID, the distribution patterns observed for this ion were analogous to those of m/z 705 in both young and old lens tissue sections (supplementary Fig. II).
Fig. 2.

A: An averaged positive ion MALDI mass spectrum acquired directly from a tissue slice obtained from a 70-year-old human lens. B: An MS/MS spectrum obtained for m/z 705 generated by MALDI analysis of a tissue slice from a 64-year-old human lens. Phosphocholine cation (m/z 184) is produced by all sphingomyelins.
Fig. 3.
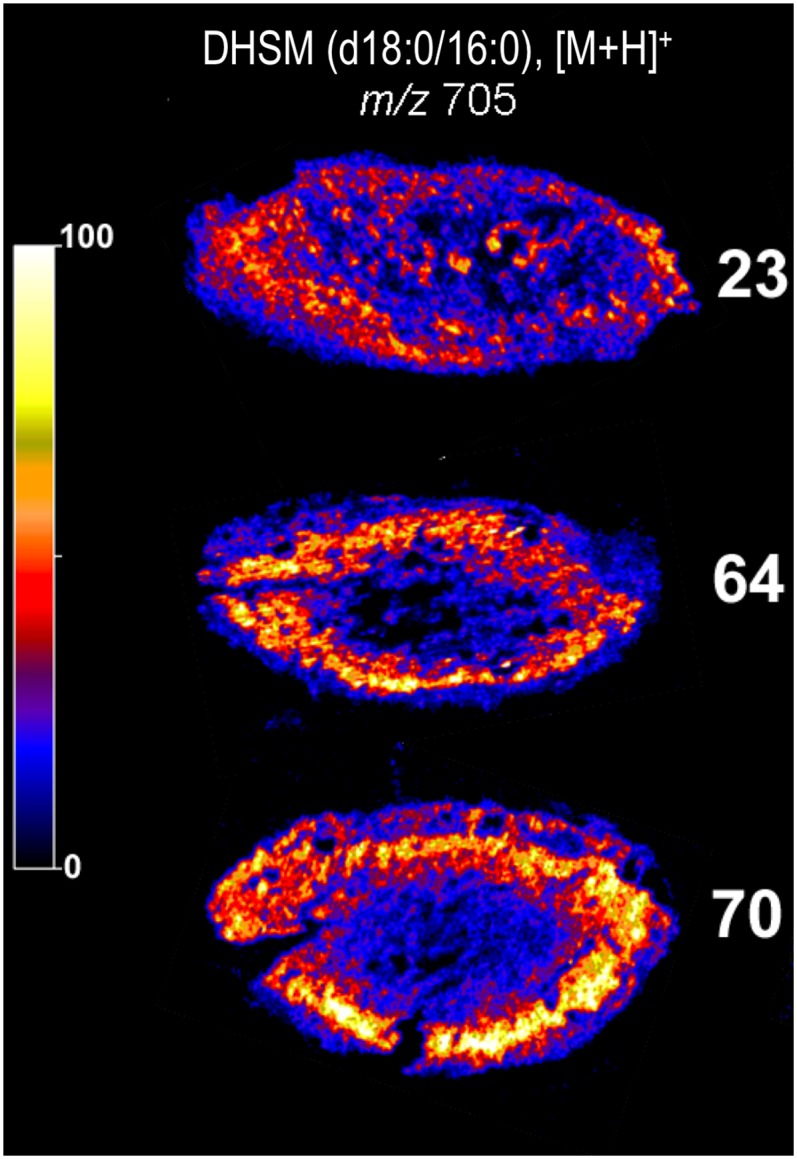
Positive ion MALDI images showing the distribution of the ion at m/z 705 corresponding to [DHSM (d18:0/16:0) + H]+ in transverse slices from 23-, 64-, and 70-year-old human lenses. The regions of highest ion abundance are shown in white, while the background corresponding to zero signal is black (see color key inset). The tissue slices imaged in these experiments were 10–25 µm thick. Abbreviation: DHSM, dihydrosphingomyelin.
The quadrupole-time of flight mass spectrometer used for MALDI imaging in this study acquires a full mass spectrum (Fig. 2A) for each position on the tissue that is interrogated by the laser. As such, the dataset used to produce the images in Fig. 3 could be manually searched for ions showing abundance distributions that were either analogous or complementary to those of m/z 705. These examinations revealed an ion at m/z 540 that, while of low overall abundance relative to m/z 705 (Fig. 2A), was found in the older lenses to have a distribution complementary to that of DHSM (d18:0/16:0). The MALDI images of m/z 540 in the same three lens sections are shown in Fig. 4 and reveal that while this ion is below detection limits in the 23-year-old lens, in both the 64- and 70-year-old tissues, it is most abundant in the nuclear region while being virtually absent in the outer regions of the lens. Intriguingly, m/z 540 corresponds in mass to the [M+H]+ ion of the dihydroceramide, DHCer (d18:0/16:0), the structural analog of the most abundant lens phospholipid DHSM (d18:0/16:0). While the identity of this [M+H]+ ion could not be directly verified from the MALDI data, ESI-MS analysis of lipid extracts of tissue from the nucleus of other old lenses revealed the corresponding [M-H]− ions at m/z 538 (Fig. 5A) that were also present in neutral loss scans for 258 Da (Fig. 5B), which are specific for dihydroceramides (23). These negative ion analyses also identified the presence of the long-chain ceramide DHCer (d18:0/24:1) with an [M-H]− ion at m/z 648 (Fig. 5). The corresponding [M+H]+ positive ion at m/z 650 was only present in very low abundance in the MALDI analysis but revealed a distribution similar to that of DHCer (d18:0/16:0) and complementary to the related dihydrosphingomyelin DHSM (d18:0/24:1) (supplementary Fig. II). The presence of ceramides DHCer (d18:0/16:0) and DHCer (d18:0/24:1) in lens tissue was confirmed by LC-MS analysis of extracts from nuclear tissue using a normal phase HPLC column as described by Sullards et al. (17). Under these conditions, all ceramides were eluted from the HPLC column between 3.0 and 3.5 min and were clearly separated from intact sphingomyelins that eluted between 13.8 and 14.8 min. The dihydroceramides DHCer (d18:0/16:0) and DHCer (d18:0/24:1) were clearly identified in the LC-MS analysis by precursor ion scans for m/z 266 that found [M+H]+ ions at m/z 540 and 650, respectively (supplementary Fig. III). LC-MS analysis also revealed the presence of [M+H−H2O]+ ions at m/z 522 and 632 from the corresponding dehydrated forms of these dihydroceramides. The m/z 522 ion is also present in the MALDI spectrum shown in Fig. 2, and examination of its distribution (data not shown) revealed a pattern analogous to that of m/z 540, providing some further support for the assignment of the latter ion as [DHCer (d18:0/16:0) + H]+ within the MALDI experiment.
Fig. 4.
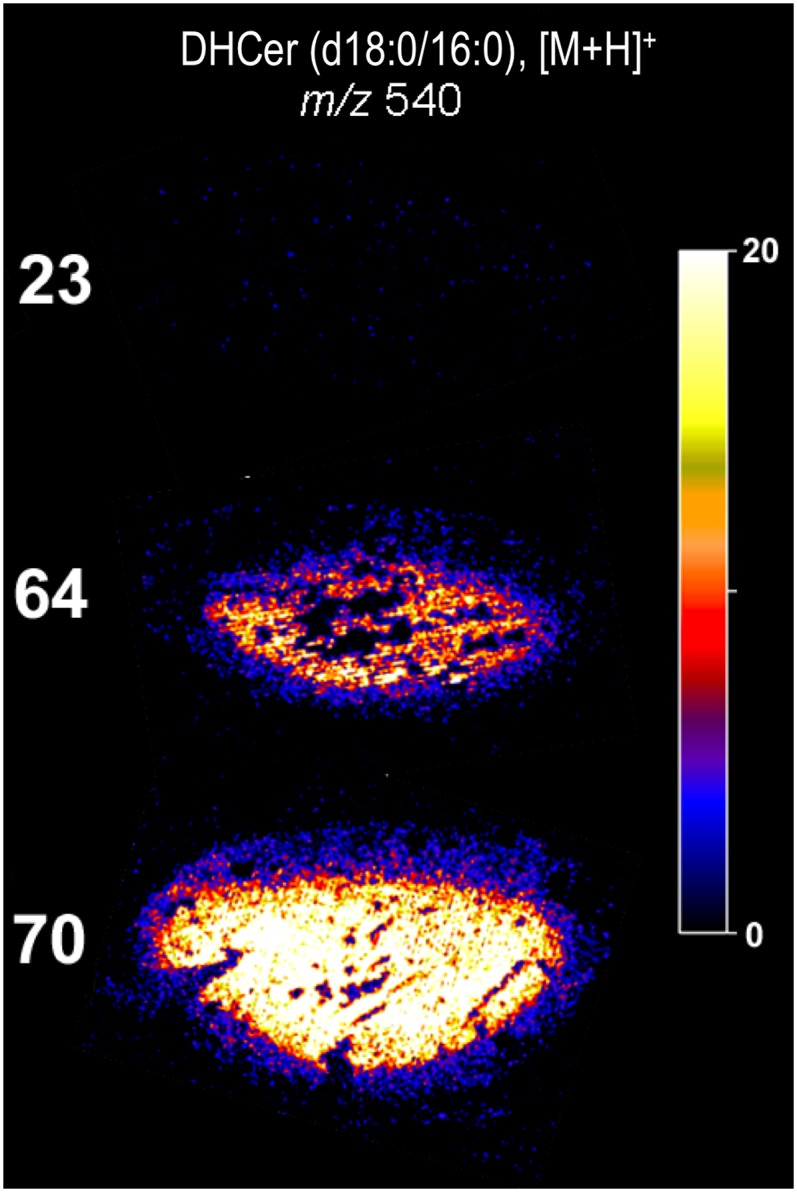
Positive ion MALDI images showing the distribution of the ion at m/z 540 corresponding to [DHCer (d18:0/16:0) + H]+ ions in transverse slices from 23-, 64-, and 70-year-old human lenses. The regions of highest ion abundance are shown in white, while the background corresponding to zero signal is black (see color key inset). The tissue slices imaged in these experiments were 10–25 µm thick. Abbreviation: DHCer, dihydroceramide.
Fig. 5.

Negative ion ESI mass spectra of the lipid extract from a 78-year-old “inner” lens region. A negative mass spectrum (A) and ions that produce a neutral loss of 258 Da following collision-induced dissociation (B). This provides a spectrum that displays all of the DHCer (d18:0) dihydroceramides in the lipid extract. Abbreviations: Cer, ceramide; DHCer, dihydroceramide.
Regional analysis of lens sphingolipids
To determine if the images of ionized DHSM (d18:0/ 16:0) and DHCer (d18:0/16:0) obtained from the human lens tissue sections were representative of the distribution of the lipids in whole lenses, an alternative analysis of these tissues was undertaken. Lenses obtained from 31- and 73-year-old males were dissected as described in “Methods,” and the relative abundance of DHSM (d18:0/16:0) and DHCer (d18:0/16:0) were determined in each region by extraction of the tissue and ESI-MS analysis in the presence of internal standards (e.g., Fig. 5). Fig. 6 shows a comparison of the peak intensities obtained from averaging the MALDI mass spectra obtained over the corresponding regions of the lens (Fig. 1) with the abundance of the same lipids obtained by ESI-MS of dissected whole lenses. The average [DHSM (d18:0/16:0) + H]+ ion counts obtained from each region of the MALDI image data are displayed in Fig. 6A (23 years old) and Fig. 6C (70 years old). The ion distribution of the three regions obtained from MALDI imaging shows a similar trend to the data obtained from the sectioning study for both the 31-year-old (Fig. 6B) and 73-year-old (Fig. 6D) lenses. In both cases, the young lenses show a relatively homogeneous distribution of DHSM (d18:0/16:0) throughout the lens, while the older lenses show evidence of greater abundance of this lipid in the barrier region. This finding indicates that the distribution of the m/z 705 ion as observed by MALDI imaging (Fig. 3) is representative of the distribution of the DHSM (d18:0/16:0) lipid within the lens and is not an artifact arising from changes in lens morphology or local variations in salt concentrations influencing the efficiency of the MALDI process. The congruence between the MALDI imaging data and that obtained from the regional lipid extracts also holds for DHCer (d18:0/16:0), as can be seen in . Using either technique, DHCer (d18:0/16:0) was virtually undetectable in the young lenses (Fig. 6E, F) while the same experiments on the older lenses show nearly identical trends with increasing DHCer (d18:0/16:0) levels, particularly in the nucleus.
Changes in sphingomyelin content of the barrier region with age
While both datasets shown in Fig. 6 point to an increase in DHSM (d18:0/16:0) in the barrier region with age, there is insufficient data (a total of only two young and three old individuals) to draw strong conclusions about age-related trends in molecular composition of the lens. In particular, the lack of available lenses from young individuals in the timeframe of this study was found to be limiting. To address this, extracts from the barrier region of the lenses of 18 individuals, ranging in age from 20 to 72 years, were obtained from a parallel study investigating the membrane association of lens proteins (13). Lipid extraction and ESI-MS analysis of these samples was undertaken in the present study, and the relative amount of all detectable sphingomyelin was determined relative to internal standards. In agreement with the qualitative data described above, this more comprehensive dataset (Fig. 7) reveals an almost 2-fold increase in the total sphingomyelin abundance in the barrier region between 20 and 40 years of age. This is followed by relatively little change in sphingomyelin concentration between the ages of 40 and 72 years.
Fig. 7.

Total sphingomyelin levels in the lens barrier region versus age (n = 18). The lens barrier region was dissected out, and the relative abundance of total sphingomyelin determined by electrospray ionization mass spectrometry as described in “Methods.” The line of best fit is a three-parameter sigmoid curve. #Relative ion abundance is presented as a fraction of the [DHSM (d18:0/12:0) + H]+ internal standard. Abbreviation: DHSM, dihydrosphingomyelin.
DISCUSSION
MALDI mass spectrometric imaging of lens sections revealed a marked regional variation in the distribution of lipids in older human lenses. In particular, a pronounced “ring” of high DHSM concentration was observed in lenses older than 60 years, and its geometric dimensions correspond in size to that of the barrier to diffusion (5, 6). The elevated concentrations of sphingomyelins in this zone were confirmed using quantitative methods based on electrospray ionization mass spectrometry. The region of high DHSM concentration was not apparent in younger lenses. Recently obtained MALDI images of lipids within the porcine lens suggest higher abundances of sphingomyelins in the nucleus than the cortex, but no distinct structure is observed in the lipid distribution (24) akin to that reported here.
The barrier to diffusion, which becomes apparent in normal human lenses at middle age, has been proposed (4) to be the prime reason for the later onset of the ARN cataract. By restricting the flow of small molecular weight substances, such as the antioxidant glutathione, from its place of synthesis or reduction in the lens cortex into the lens nucleus, the proteins in the center of the lens become susceptible to oxidative modification, which is the hallmark of the ARN cataract (3, 25).
There are several possible explanations for the age-related increase in sphingomyelin content in the barrier region observed in this study. The first is that the fiber cell membranes of the barrier region undergo a compositional change with age; i.e., the sphingomyelin content increases at the expense of other membrane lipids. Several studies have identified an increase in the sphingomyelin content relative to glycerophospholipids in whole lenses (26, 27) and also in the lens cortex and nucleus separately (28). Indeed, these and other changes in the ocular lens lipidome have been the subject of a recent comprehensive review (29). There are, however, no existing data describing the relationship between age and glycerophospholipids in the barrier region. Note that large age-related increases in SM concentration are also observed in specific regions of the rat brain with no increase in total phospholipid; i.e., a decrease in glycerophospholipid (30).
An alternative (second) explanation for the age-related increase in sphingomyelin lies in the fact that lipid levels in this study were measured as a function of tissue weight; i.e., the amount of internal standard added was determined by tissue mass (see “Methods”). Therefore, a decrease in the mass of the barrier region could also result in an observed increase in sphingomyelin. The main contributors to tissue mass in the lens are protein and water. While water content (at least in the nuclear region) appears to remain constant throughout life (19), there is a slight decrease of ∼17% in barrier-region protein concentration between the ages of 19 and 85 (unpublished observations). This decrease is not sufficient, however, to explain the near doubling of sphingomyelin levels observed in the barrier region between ages 20 and 40 (Fig. 7).
The central part of the human lens, which is approximately 6 mm in equatorial diameter (Fig. 1), corresponds to the size of the lens at birth (12) and is not compressed during adult life (19, 31, 32). However, the lens grows throughout life (33–35), yet remarkably, the equatorial dimensions of the human lens do not change appreciably in the adult (36). Therefore, a third possible explanation of our data is a localized, age-dependent compression of lens fiber cells in the barrier region. One could postulate that during adulthood, the synthesis of new fiber cells is matched by corresponding stacking of internal fiber cells onto the preexisting nucleus. Such an increase in the density of lens fiber cells with age in the barrier region may be one factor that contributes to the formation of the barrier by increasing the number of cellular membranes that need to be crossed by small molecules diffusing toward the lens center. Electron microscopic evidence also suggests that compaction may occur in some areas of the human lens with age (37).
Mass spectral measurements also revealed the presence of ceramides in the lens that increased in concentration with age. This phenomenon was most noticeable in the nuclear region. Both the sphingoid base and fatty amide composition of the ceramides corresponded exactly to those of human lens SM. Consequently, the most likely explanation for the origin of the ceramides is that they are generated by hydrolysis of the SM head groups. The current data also suggest that this process is associated with age. In the central region of the lens, there is no protein turnover (1); therefore, it is unlikely that enzymatic processes are involved because this would require that enzyme molecules remain active for several decades. For this reason, it is probable that our finding of ceramides in older lenses reflects an intrinsic instability of DHSM in this environment over a long time period. This aspect is currently under investigation.
Although it is not known if the ceramides are able to diffuse appreciable distances within the lens, the known biological activities of these molecules could mean that in older lenses they may be involved in other metabolic processes. For example, at low concentrations in cell culture, ceramides are able to cause cell death of lens epithelial cells (38) and have therefore been postulated to play a role in the formation of cortical cataract.
Our work has documented large changes in the lipid composition of the human lens with age. The compression of fiber cells, in addition to the conversion of a percentage of DHSM into ceramide, may provide one explanation for the recent finding of pronounced binding of normally soluble lens crystallins onto the fiber cell membranes in middle-aged lenses (13).
Supplementary Material
Acknowledgments
The authors are grateful to Dr Berwyck Poad for his assistance in preparation of some of the figures.
Footnotes
Abbreviations:
- ARN cataract
- age-related nuclear cataract
- Cer
- ceramide
- DHCer
- dihydroceramide
- DHSM
- dihydrosphingomyelin
This work was supported by an Australian postgraduate award (J.M.D.); Grants LP0989883 and DP0986628 from University of Wollongong and the Australian Research Council (S.J.B. and T.W.M.); Grant 512334 from the National Health and Medical Research Council (R.J.W.T.); Ophthalmic Research Institute of Australia (R.J.W.T.); and Lipid Maps Large Scale Collaborative Grant GM-069338 (R.C.M.) from the National Institutes of Health. Its contents are solely the responsibility of the authors and do not necessarily represent the official views of the National Institutes of Health.
The online version of this article (available at http://www.jlr.org) contains supplementary data in the form of two figures.
REFERENCES
- 1.Lynnerup N., Kjeldsen H., Heegaard S., Jacobsen C., Heinemeier J. 2008. Radiocarbon dating of the human eye lens crystallines reveal proteins without carbon turnover throughout life. PLoS ONE. 3: e1529. [DOI] [PMC free article] [PubMed] [Google Scholar]
- 2.Glasser A., Campbell M. C. W. 1999. Biometric, optical and physical changes in the isolated human crystalline lens with age in relation to presbyopia. Vision Res. 39: 1991–2015. [DOI] [PubMed] [Google Scholar]
- 3.Spector A. 1984. Oxidation and cataract. Ciba Found. Symp. 106: 48–64. [DOI] [PubMed] [Google Scholar]
- 4.Truscott R. J. W. 2005. Age-related nuclear cataract - oxidation is the key. Exp. Eye Res. 80: 709–725. [DOI] [PubMed] [Google Scholar]
- 5.Moffat B. A., Landman K. A., Truscott R. J. W., Sweeney M. H. J., Pope J. M. 1999. Age-related changes in the kinetics of water transport in normal human lenses. Exp. Eye Res. 69: 663–669. [DOI] [PubMed] [Google Scholar]
- 6.Sweeney M. H. J., Truscott R. J. W. 1998. An impediment to glutathione diffusion in older normal human lenses: a possible precondition for nuclear cataract. Exp. Eye Res. 67: 587–595. [DOI] [PubMed] [Google Scholar]
- 7.Dovrat A., Scharf J., Gershon D. 1984. Glyceraldehyde-3-phosphate dehydrogenase-activity in rat and human lenses and the fate of enzyme molecules in the aging lens. Mech. Ageing Dev. 28: 187–191. [DOI] [PubMed] [Google Scholar]
- 8.Zhang W. Z., Augusteyn R. C. 1994. Aging of glutathione-reductase in the lens. Exp. Eye Res. 59: 91–95. [DOI] [PubMed] [Google Scholar]
- 9.Giblin F. J. 2000. Glutathione: a vital lens antioxidant. J. Ocul. Pharmacol. Ther. 16: 121–135. [DOI] [PubMed] [Google Scholar]
- 10.Rathbun W. B., Bovis M. G., Holleschau A. M. 1986. Species survey of glutathione peroxidase and glutathione reductase: search for an animal model of the human lens. Ophthalmic Res. 18: 282–287. [DOI] [PubMed] [Google Scholar]
- 11.Kuszak J. R. 1995. The development of lens sutures. Prog. Retin. Eye Res. 14: 567–592. [Google Scholar]
- 12.Garland D. L., Duglas-Tabor Y., Jimenez-Asensio J., Datiles M. B., Magno B. 1996. Nucleus of the human lens: demonstration of a highly characteristic protein pattern by two-dimensional electrophoresis and a new method of lens dissection. Exp. Eye Res. 62: 285–291. [DOI] [PubMed] [Google Scholar]
- 13.Friedrich M. G., Truscott R. J. W. 2009. Membrane association of proteins in the aging human lens: profound changes take place in the fifth decade of life. Invest. Ophthalmol. Vis. Sci. 50: 4786–4793. [DOI] [PubMed] [Google Scholar]
- 14.Jacobs M. D., Soeller C., Sisley A. M., Cannell M. B., Donaldson P. J. 2004. Gap junction processing and redistribution revealed by quantitative optical measurements of connexin46 epitopes in the lens. Invest. Ophthalmol. Vis. Sci. 45: 191–199. [DOI] [PubMed] [Google Scholar]
- 15.Gonen T., Cheng Y., Sliz P., Hiroaki Y., Fujiyoshi Y., Harrison S. C., Walz T. 2005. Lipid-protein interactions in double-layered two-dimensional AQP0 crystals. Nature. 438: 633–638. [DOI] [PMC free article] [PubMed] [Google Scholar]
- 16.Hankin J. A., Barkley R. M., Murphy R. C. 2007. Sublimation as a method of matrix application for mass spectrometric imaging. J. Am. Soc. Mass Spectrom. 18: 1646–1652. [DOI] [PMC free article] [PubMed] [Google Scholar]
- 17.Sullards M. C., Allegood J. C., Kelly S., Wang E., Haynes C. A., Park H., Chen Y., Merrill A. H., Jr 2007. Structure-specific, quantitative methods for analysis of sphingolipids by liquid chromatography-tandem mass spectrometry: “inside-out” sphingolipidomics. Methods Enzymol. 432: 83–115. [DOI] [PubMed] [Google Scholar]
- 18.Deeley J. M., Mitchell T. W., Nealon J. R., Wei X., Korth J., Blanksby S. J., Truscott R. J. W. 2008. Human lens lipids differ markedly from those of commonly used experimental animals. Biochim. Biophys. Acta. 1781: 288–298. [DOI] [PubMed] [Google Scholar]
- 19.Heys K. R., Friedrich M. G., Truscott R. J. W. 2008. Free and bound water in normal and cataractous human lenses. Invest. Ophthalmol. Vis. Sci. 49: 1991–1997. [DOI] [PubMed] [Google Scholar]
- 20.Folch J., Lees M., Sloane-Stanley G. H. 1957. A simple method for the isolation and purification of total lipides from animal tissues. J. Biol. Chem. 226: 497–509. [PubMed] [Google Scholar]
- 21.Byrdwell W. C., Borchman D. 1997. Liquid chromatography mass-spectrometric characterization of sphingomyelin and dihydrosphingomyelin of human lens membranes. Ophthalmic Res. 29: 191–206. [DOI] [PubMed] [Google Scholar]
- 22.Estrada R., Puppato A., Borchman D., Yappert M. C. 2010. Reevaluation of the phospholipid composition in membranes of adult human lenses by 31P NMR and MALDI MS. Biochim. Biophys. Acta. 1798: 303–311. [DOI] [PubMed] [Google Scholar]
- 23.Han X. 2002. Characterization and direct quantitation of ceramide molecular species from lipid extracts of biological samples by electrospray ionization tandem mass spectrometry. Anal. Biochem. 302: 199–212. [DOI] [PubMed] [Google Scholar]
- 24.Vidova V., Pol J., Volny M., Novak P., Havlicek V., Wiedmer S. K., Holopainen J. M. Visualizing spatial lipid distribution in porcine lens by MALDI imaging high-resolution mass spectrometry. J. Lipid Res. Epub ahead of print. April 13, 2010; doi:10.1194/jlr.M005488. [DOI] [PMC free article] [PubMed] [Google Scholar]
- 25.Truscott R. J. W., Augusteyn R. C. 1977. Oxidative changes in human lens proteins during senile nuclear cataract formation. Biochim. Biophys. Acta. 492: 43–52. [DOI] [PubMed] [Google Scholar]
- 26.Huang L., Grami V., Marrero Y., Tang D., Yappert M. C., Rasi V., Borchman D. 2005. Human lens phospholipid changes with age and cataract. Invest. Ophthalmol. Vis. Sci. 46: 1682–1689. [DOI] [PubMed] [Google Scholar]
- 27.Merchant T. E., Lass J. H., Meneses P., Greiner J. V., Glonek T. 1991. Human crystalline lens phospholipid analysis with age. Invest. Ophthalmol. Vis. Sci. 32: 549–555. [PubMed] [Google Scholar]
- 28.Yappert M. C., Rujoi M., Borchman D., Vorobyov I., Estrada R. 2003. Glycero- versus sphingo-phospholipids: correlations with human and non-human mammalian lens growth. Exp. Eye Res. 76: 725–734. [DOI] [PubMed] [Google Scholar]
- 29.Borchman D., Yappert M. C. Lipids and the ocular lens. J. Lipid Res. Epub ahead of print. April 20, 2010; doi:10.1194/jlr.R004119. [DOI] [PMC free article] [PubMed] [Google Scholar]
- 30.Giusto N. M., Roque M. E., Deboschero M. G. I. 1992. Effects of aging on the content, composition and synthesis of sphingomyelin in the central-nervous-system. Lipids. 27: 835–839. [DOI] [PubMed] [Google Scholar]
- 31.Fagerholm P. P., Philipson B. T., Lindstrom B. 1981. Normal human lens - the distribution of protein. Exp. Eye Res. 33: 615–620. [DOI] [PubMed] [Google Scholar]
- 32.van Heyningen R. 1972. The human lens. 3. Some observations on the post-mortem lens. Exp. Eye Res. 13: 155–160. [DOI] [PubMed] [Google Scholar]
- 33.Augusteyn R. C. 2007. Growth of the human eye lens. Mol. Vis. 13: 252–257. [PMC free article] [PubMed] [Google Scholar]
- 34.Augusteyn R. C. 2008. Growth of the lens: in vitro observations. Clin. Exp. Optom. 91: 226–239. [DOI] [PubMed] [Google Scholar]
- 35.Strenk S. A., Strenk L. M., Semmlow J. L., DeMarco J. K. 2004. Magnetic resonance image study of the effects of age accommodation on the human lens cross-sectional area. Invest. Ophthalmol. Vis. Sci. 45: 539–545. [DOI] [PubMed] [Google Scholar]
- 36.Strenk S. A., Semmlow J. L., Strenk L. M., Munoz P., Gronlund-Jacob J., DeMarco J. K. 1999. Age-related changes in human ciliary muscle and lens: a magnetic resonance imaging study. Invest. Ophthalmol. Vis. Sci. 40: 1162–1169. [PubMed] [Google Scholar]
- 37.Al-Ghoul K. J., Nordgren R. K., Kuszak A. J., Freel C. D., Costello M. J., Kuszak J. R. 2001. Structural evidence of human nuclear fiber compaction as a function of ageing and cataractogenesis. Exp. Eye Res. 72: 199–214. [DOI] [PubMed] [Google Scholar]
- 38.Samadi A. 2007. Ceramide-induced cell death in lens epithelial cells. Mol. Vis. 13: 1618–1626. [PubMed] [Google Scholar]
Associated Data
This section collects any data citations, data availability statements, or supplementary materials included in this article.