

Abstract
Objective:
To assess the value of quantitative ultrasound in patients with type 2 and 3 spinal muscular atrophy (SMA).
Methods:
Twenty-five patients with SMA (15 type 2 and 10 type 3) and 21 normal subjects were enrolled for this observational study. Strength of biceps brachii, wrist extensors, quadriceps, and tibialis anterior were measured with hand-held dynamometry. In addition, these 4 muscles were studied with a standard ultrasound system using a 5-MHz probe, and luminosity values for each muscle and the overlying subcutaneous fat were obtained by subsequent image analysis. A luminosity ratio (LR) for each muscle was calculated by dividing the muscle by the subcutaneous fat luminosity. The LR and strength scores for all 4 muscles were averaged to provide a single summary value for each patient.
Results:
The LRs increased with disease severity: 1.27 ± 0.26 for normal subjects, 2.43 ± 0.78 for type 3 SMA, and 3.85 ± 1.3 for type 2 SMA (p < 0.001). Taking all the normal subject and patient data together, there was a good correlation between strength and LR (r = −0.711, p < 0.001). There was also a moderate relationship between LR and strength in the patients with SMA alone (r = −0.588, p = 0.008), and, as expected, a nonsignificant relationship between LR and strength in normal subjects (r = −0.011).
Conclusions:
Quantitative ultrasound has the potential of serving as a marker of SMA severity and may be useful in future clinical trials.
GLOSSARY
- LR
= luminosity ratio;
- MUNE
= motor unit number estimation;
- SMA
= spinal muscular atrophy.
Spinal muscular atrophy (SMA) is a common neuromuscular disease of childhood characterized by motor neuron loss and varies greatly in severity. Infants with type 1 disease can present in respiratory distress and never achieve the ability to sit whereas patients with type 4 disease do not develop even mild appendicular weakness until adulthood.1 Patients with type 2 (sitters) and type 3 (walkers) SMA have intermediate phenotypes. Currently, no sensitive outcome measure exists to assess the severity of the illness and disease progression. Although a variety of disease markers are used, including the Hammersmith Scale of physical function,2,3 dynamometry strength testing,4 and motor unit number estimation (MUNE),5 all have limitations. For example, dynamometry is difficult to perform in young children, those with near-normal strength, or those who are profoundly weak.
One technique that may be useful as an outcome measure in SMA clinical trials is that of diagnostic ultrasound since it is well-tolerated, requires minimal patient cooperation, and can survey multiple muscles quickly. Previous studies have demonstrated that ultrasound is useful in assessing muscle deterioration in a variety of neuromuscular diseases.6–14 Patients with neuromuscular disorders show increased muscle echogenicity from infiltration of muscle architecture by fat and connective tissue.15 Moreover, patients with myopathies typically have normal or increased muscle thickness and normal subcutaneous fat thickness, whereas patients with neurogenic processes have decreased muscle thickness and increased subcutaneous fat thickness.10,14,15 Importantly, muscle echo intensity can be quantified via computer-assisted grayscale analysis with increased echo intensity correlating to increased disease severity.10,11,16 Thus, the objective of this study is to assess the ability of quantitative ultrasound to evaluate muscles of individuals with the most common subtypes of SMA, types 2 and 3.
METHODS
Standard protocol approvals, registrations, and patient consents.
The study was approved by the Children's Hospital Boston Institutional Review Board, and all parents/subjects were required to give signed informed consent and assent. Patients with SMA aged 1 year and above were recruited through the Neurology service at Children's Hospital Boston. Inclusion criteria included having genetically confirmed SMA and clinically classified as type 2 (sitters) and type 3 (walkers). For the youngest patients, the classification of type 2 or type 3 was based on the clinical findings of a pediatric neurologist (B.T.D.) with many years of expertise as to the likelihood of the child achieving the ability to walk.
Normal subjects were also recruited through Children's Hospital Boston. All normal subjects underwent a brief history and examination to ensure that they were free of underlying neuromuscular disease.
Ultrasound measurements.
In each subject, the biceps brachii, wrist extensors, quadriceps, and tibialis anterior at their midpoints on one arbitrarily chosen side were studied with the limb in a relaxed posture (midposition between flexed and extended). Ultrasonographic images were obtained using a Terason 2000 Handheld Ultrasound System (Terason, Burlington, MA) with a 5-MHz probe. The gain, compression, and time gain compensation sonographic settings were kept constant between subjects and all images were acquired on this single ultrasound device. Only the depth setting was adjusted in order to best evaluate the muscle of interest. Data analysis was performed on transverse images only since that has been the preferred approach of most investigators,10,11,16 although recent data suggest that longitudinal image analysis can also work effectively and may be superior in some respects.17
Images were exported from the Terason software to Adobe Photoshop (Adobe Systems Incorporated, San Jose, CA) as tagged image file format files. Tissue luminosity was quantified following a modified version of previous investigators.11 Representative boxes of interest were placed in the muscle and subcutaneous fat, excluding fascia (at the periphery or between muscle) and muscle-tendon transitions, similar to the technique previously described.16 The Adobe grayscale histogram function was then applied (figure 1). The histogram function provided luminosity values for the selected area of tissue and since the distribution of the luminosity of the tissue was usually skewed, the median value was recorded for both the subcutaneous fat and the muscle at each of the 4 anatomic sites for each subject. A luminosity ratio (LR) for each muscle was then calculated by dividing the muscle luminosity value by the overlying subcutaneous fat luminosity value. A luminosity difference, obtained by subtracting the subcutaneous fat luminosity value from the muscle luminosity value, was also assessed. Using this approach, we could account for minor variations in image windowing, by using the subcutaneous fat as an internal reference. The subcutaneous skin thickness was determined by using electronic calipers during the ultrasound imaging process. The distance from the interface between the dermis and fat to the ventral fascia corresponded to the subcutaneous fat layer in all 4 locations. The subjects were asked to gently flex the muscle of interest to help with this determination. This was measured for all subjects in all 4 anatomic locations. All image data analysis was performed by one investigator (J.S.W.) who was blinded to all clinical information, did not participate in the ultrasound data acquisition, and was also blind to the dynamometry strength data when he performed this analysis.

Figure 1 Quantitative ultrasound image analysis using Adobe Photoshop
Screen capture image from Adobe Photoshop shows a region of interest in the quadriceps muscle in an ultrasound image from a normal subject. The histogram box to the left of the image shows the corresponding grayscale luminosity values (mean 43 and median 38). Subcutaneous fat is also shown (dashed line). b = bone; m = muscle; sc fat = subcutaneous fat.
Dynamometry.
Dynamometry was performed on the same side as the ultrasound examination by 2 research assistants trained in strength measurements by the Pediatric Neuromuscular Research Network. All subjects underwent dynamometry using a handheld device (Manual Muscle Test System Model 01163, Lafayette Instruments, Lafayette, IN). Subjects were asked to sustain a maximum contraction for 5 seconds and each measurement was performed twice, the higher value being recorded each time. Subjects under 3 years of age, or those who clearly could not cooperate, were not studied.
Data analysis.
The LRs for all 4 muscles were averaged to obtain a single value for the entire subject. Similarly, strength scores and skin-fat thicknesses were also averaged per subject. One-way analyses of variance with post hoc t tests were performed to determine if there were significant differences among the type 2 patients, type 3 patients, and normal subjects. In order to evaluate the relationships between strength, skin-fat thickness, and LR, Pearson correlation analyses were performed. Significance was determined with α <0.05, 2-tailed. All statistical analyses were conducted using SPSS (SPSS, Inc., Chicago, IL).
RESULTS
Demographics.
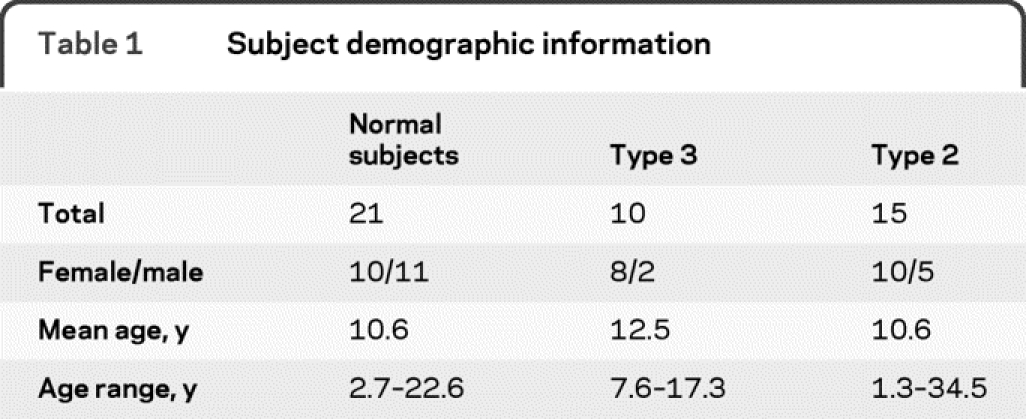
A total of 46 subjects were enrolled, 25 of whom had SMA (15 type 2 and 10 type 3) and 21 normal subjects. Demographic information is summarized in table 1. There was no significant difference in age or sex among the 3 groups, although the percentage of female subjects in the SMA group as a whole (72%) was higher than that of the normal subject group (48%).
Table 1 Subject demographic information
Ultrasound data.
The mean (±SD) raw luminosity values for muscle, subcutaneous fat, and the resulting LRs are provided in table 2. Raw values for muscle and the LR were significantly different between groups, being lowest in the healthy subject group and highest in the type 2 SMA group and intermediate in the type 3 SMA group (figure 2). No difference was found for the raw subcutaneous fat analyses. Post hoc t tests with Bonferroni correction for multiple comparisons showed that both the raw muscle values and the LRs were significantly different across all groups (i.e., control vs SMA type 2, control vs SMA type 3, and SMA type 2 vs SMA type 3). Similar differences were identified for the luminosity difference measurement (table 2), including the post hoc analyses.
Table 2 Summary data on luminosity values
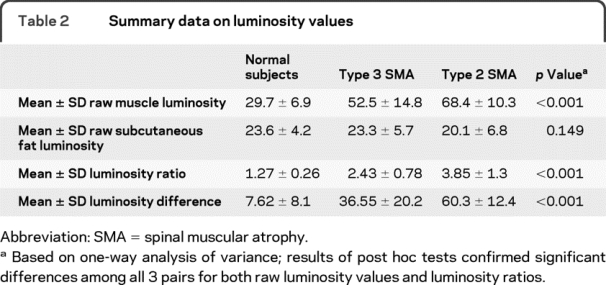

Figure 2 Muscle echo intensity in normal subjects and subjects with spinal muscular atrophy (SMA)
Transverse ultrasound images from the quadriceps of a normal subject (A), a patient with type 3 SMA (B), and a patient with type 2 SMA (C). The muscles demonstrate increasing echo intensity from normal to the most severe (the patient with type 2 SMA). The luminosity ratio between the muscle and the subcutaneous fat is as follows: normal = 1.03, type 3 SMA = 2.34, and type 2 SMA = 5.31. b = bone; m = muscle; sc fat = subcutaneous fat.
Since our SMA population had a substantially greater number of female than male subjects, we investigated whether there was a male-female difference in the raw ultrasound values and LR in normal subjects. Although neither the raw muscle nor raw subcutaneous fat values were different, the LR was slightly higher in the female subjects vs the male subjects (1.40 ± 0.33 vs 1.16 ± 0.25, p = 0.033). However, this difference was so small relative to the differences observed between healthy/disease groups that even substituting the female-only normal data for the data from the full cohort of normal subjects and repeating the same analyses did not alter the results.
Skin-fat thickness was different (p < 0.001) between the groups, with the normal subjects having the lowest values (a mean of 5.37 ± 2.6 mm), followed by the type 3 patients (a mean of 8.82 ± 3.7 mm), and followed by the type 2 patients (a mean of 12.5 ± 4.3 mm). Post hoc t tests demonstrated a significant difference between normal subjects and both groups of patients with SMA, but not between type 2 and type 3 patients.
Dynamometry data.
Dynamometry data were obtained on 22 of the patients with SMA and 20 of the normal subjects; dynamometry was not performed in 4 patients because they were too young to cooperate. The mean force ± SD for the normal subjects was 26.6 ± 7.2 pounds as compared to the type 3 patients with a mean value of 14.7 ± 5.8 pounds and the type 2 patients with a mean value of 2.5 ± 1.7 pounds. These values were all different from one another (p < 0.001).
Additional analyses.
We completed a series of correlation analyses to better understand the relationship among the LR, strength, and skin-fat thickness and whether increased skin thickness could impact the LR. Taking all the normal subject and patient data together, there was a correlation between strength and the LR (r = −0.711, p < 0.001) with a higher LR correlating with lower strength in the patients with SMA (r = −0.588, p = 0.008), and a nonsignificant correlation between LR and strength in normal subjects (r = −0.011). Furthermore, across all subjects, the skin-subcutaneous fat thickness showed a nonsignificant relationship to the raw skin-fat luminosity value (r = −0.215), supporting that this value was stable across all subjects. Moreover, in normal subjects there was no significant relationship between skin-fat thickness and raw luminosity of the muscle (r = 0.179). In the patients with SMA, skin-fat thickness increased with the LR (r = 0.552, p = 0.009). Once again, similar results were obtained for the luminosity difference (for example, the correlation between strength and the luminosity difference gave r = 0.67, p < 0.01).
DISCUSSION
In this study, we show that quantitative ultrasound using a LR can discriminate between type 2 and type 3 SMA subtypes and that the LR correlates well with strength as measured by dynamometry. These results are consistent with previously published reports that ultrasound can be used to evaluate SMA7–10,15; for example, using quantitative ultrasound, one study showed that neuromuscular disease could be distinguished from non-neuromuscular diseases with a sensitivity of 92% and specificity of 90% when 3 or more muscle groups showed an echo intensity more than 0.9 SD above normal.10 Using qualitative ultrasound, another study showed that 16 of 18 patients with SMA had increased muscle echo intensity, increased subcutaneous tissue thickness, and muscle atrophy.7 In that study, the 2 patients with SMA with relatively normal findings were infants, where it was hypothesized that changes in the muscle had not yet developed.7
We chose a somewhat different approach to quantifying the ultrasound data than others. Previous investigators created a database of normal muscle echo intensity values in a group of normal subjects and used these reference values when assessing patients with neuromuscular disorders.11 Since we were using an ultrasound machine different from other authors and did not have a large repository of normal subject data, we were interested in determining whether we could utilize the LR instead. Our results appear to support this approach. By employing the LR, we used the subcutaneous fat as an internal reference by which to compare differences in muscle echo intensity among the 3 study groups, with a high LR indicating increased muscle echo intensity and hence more diseased muscle. Utilizing a luminosity difference (possibly preferable to the LR for technical mathematical reasons) fared similarly. We also found virtually identical echo intensities for the skin-subcutaneous fat layer across the different subject groups, supporting the hypothesis that subcutaneous fat values can be used as an internal standard for each patient. This simple approach can be used to assess muscle health without a database of normal reference values and has the potential to be used with different ultrasound devices. Although other investigators have demonstrated the feasibility of converting normal muscle echo intensity values established on one ultrasound scanner for use on another using a phantom and a conversion equation, the technique we described could make these conversion techniques unnecessary.18
Similar to prior studies,10,13,18,19 we evaluated 4 muscle groups; however, we chose to average data from the 4 muscles studied in each patient, thus assigning average values to the entire patient rather than to individual muscles. It would have been possible to complete a similar analysis with each of the 4 muscle groups; however, such an approach would have unnecessarily complicated the analysis. Nonetheless, this may be useful in future studies as children with type 3 SMA can have relatively normal upper extremity function but markedly impaired function in the lower extremities.
One confounding element to this study is the fact that the subcutaneous fat thickness also varies with disease group and severity. Theoretically, increasing skin-subcutaneous fat thickness might be expected to reduce the amount of sound waves reaching the muscle, thus causing the muscle to appear less echogenic. However, increasing subcutaneous fat is likely to be associated with increasing IM fat. Indeed, in normal subjects, there is no clear association between the raw muscle echo intensity and the skin-fat thickness. Among the patients with SMA, the subcutaneous fat thickness increased, rather than decreased, with muscle echo intensity, supporting the idea that disease severity is reflected in both the subcutaneous fat thickness and the muscle echogenicity. Indeed, in general, there is an increase in the subcutaneous fat in children with worsening disease severity with a variety of neuromuscular diseases.7,8,10,14 Previous work has also shown that reduction in actual muscle size in SMA can be readily detected on ultrasound7,8,10,13,15; however, the increased echo intensity of muscle in individuals with advanced disease obscured deeper tissue and bone, making measurement of muscle thickness difficult.8 This was true in a number of our patients with SMA, and thus muscle thickness could not be readily assessed and is not reported here.
Another small but important result is that the LR appears to be mildly dependent on sex, with slightly higher values found in the normal female subjects than male subjects. However, as noted above, this difference is small relative to the differences between groups, and this issue would likely not be relevant to any study assessing changes in the LR over time during a clinical trial.
Some additional limitations to our work deserve mention. First, dynamometry measurements in children, especially young ones, can be unreliable. Hence, the robustness of an association between an ultrasound parameter and the measured muscle strength needs to be interpreted cautiously. Second, there is inevitable variation in the process of selecting the areas of subcutaneous fat and muscle for grayscale analysis. We attempted to do this consistently and also performed the entire analysis in a blinded fashion. Third, it is possible that differences in ultrasound devices, transducer frequency, gain, compression, and time gain compensation may affect the data. Theoretically, variations in each of these ultrasound characteristics and settings could impact the image echo intensity. Complicating these variations further is the fact that ultrasound systems calculate the echo intensity data via complex formulas that are often proprietary. Also important, a higher frequency transducer may produce an image with differing echo intensity values when compared to a lower frequency transducer. Thus, additional studies, investigating the robustness of our findings and whether they hold across a variety of ultrasound systems, would be useful. Finally, we restricted our study to only patients with type 2 and type 3 disease, and did not attempt to evaluate the most severely affected, younger patients (e.g., type 1), in whom ultrasound may also be useful.
Although the focus of this work was on establishing quantitative ultrasound as a means of discriminating disease type, the next, more challenging question will be to determine whether ultrasound is capable of detecting alterations in SMA disease severity over time. If it is, it could provide a simple, noninvasive method for evaluating treatment efficacy in future clinical trials.
AUTHOR CONTRIBUTIONS
Statistical analysis was conducted by Dr. Seward B. Rutkove.
ACKNOWLEDGMENT
The authors thank Matt Gregas, PhD, for assistance with the statistical aspects of this work; Hailly Butler, Jayson Caracciolo, and Connie Lin for their assistance with data collection; and the Pediatric Neuromuscular Clinical Research Network for Spinal Muscular Atrophy for development of the infrastructure that made this work possible.
DISCLOSURE
Dr. Wu reports no disclosures. Dr. Darras has received publishing royalties from UpToDate, Inc.; serves as a consultant for Genzyme, Inc.; receives research support from the NIH (NIAMS 2P01 NS040828-6A11 [co-PI]), the SMA Foundation, the Muscular Dystrophy Association, the New England Research Institutes/SMA Foundation, and the Slaney Family Fund for SMA; and has served as a consultant in medico-legal cases not related to SMA. Dr. Rutkove has a patent pending re: Electrical impedance myography; receives royalties from UpToDate, Inc. and for the publication of The Clinical Neurophysiology Primer (Humana Press, 2007); serves as a consultant for and holds stock in Convergence Medical Devices, Inc.; and receives research support from the NIH (NINDS R01NS055099 [PI] and NINDS K24NS060951-01A1 [PI]), the SMA Foundation, the ALS Association, and the Center for Integration of Medicine and Innovative Technology.
Address correspondence and reprint requests to Dr. Seward B. Rutkove, Beth Israel Deaconess Medical Center, Department of Neurology, 330 Brookline Avenue, Shapiro 810 Boston, MA 02215 srutkove@bidmc.harvard.edu
Study funding: Supported by the Spinal Muscular Atrophy Foundation.
Disclosure: Author disclosures are provided at the end of the article.
Received December 5, 2009. Accepted in final form April 26, 2010.
REFERENCES
- 1.Lunn MR, Wang CH. Spinal muscular atrophy. Lancet 2008;371:2120–2133. [DOI] [PubMed] [Google Scholar]
- 2.Main M, Kairon H, Mercuri E, Muntoni F. The Hammersmith functional motor scale for children with spinal muscular atrophy: a scale to test ability and monitor progress in children with limited ambulation. Eur J Paediatr Neurol 2003;7:155–159. [DOI] [PubMed] [Google Scholar]
- 3.O'Hagen JM, Glanzman AM, McDermott MP, et al. An expanded version of the Hammersmith Functional Motor Scale for SMA II and III patients. Neuromuscul Disord 2007;17:693–697. [DOI] [PubMed] [Google Scholar]
- 4.Merlini L, Mazzone ES, Solari A, Morandi L. Reliability of hand-held dynamometry in spinal muscular atrophy. Muscle Nerve 2002;26:64–70. [DOI] [PubMed] [Google Scholar]
- 5.Swoboda KJ, Prior TW, Scott CB, et al. Natural history of denervation in SMA: relation to age, SMN2 copy number, and function. Ann Neurol 2005;57:704–712. [DOI] [PMC free article] [PubMed] [Google Scholar]
- 6.Heckmatt JZ, Dubowitz V, Leeman S. Detection of pathological change in dystrophic muscle with B-scan ultrasound imaging. Lancet 1980;1:1389–1390. [DOI] [PubMed] [Google Scholar]
- 7.Heckmatt JZ, Leeman S, Dubowitz V. Ultrasound imaging in the diagnosis of muscle disease. J Pediatr 1982;101:656–660. [DOI] [PubMed] [Google Scholar]
- 8.Heckmatt JZ, Pier N, Dubowitz V. Assessment of quadriceps femoris muscle atrophy and hypertrophy in neuromuscular disease in children. J Clin Ultrasound 1988;16:177–181. [DOI] [PubMed] [Google Scholar]
- 9.Zuberi SM, Matta N, Nawaz S, Stephenson JB, McWilliam RC, Hollman A. Muscle ultrasound in the assessment of suspected neuromuscular disease in childhood. Neuromuscul Disord 1999;9:203–207. [DOI] [PubMed] [Google Scholar]
- 10.Pillen S, Scholten RR, Zwarts MJ, Verrips A. Quantitative skeletal muscle ultrasonography in children with suspected neuromuscular disease. Muscle Nerve 2003;27:699–705. [DOI] [PubMed] [Google Scholar]
- 11.Scholten RR, Pillen S, Verrips A, Zwarts MJ. Quantitative ultrasonography of skeletal muscles in children: normal values. Muscle Nerve 2003;27:693–698. [DOI] [PubMed] [Google Scholar]
- 12.Brockmann K, Becker P, Schreiber G, Neubert K, Brunner E, Bonnemann C. Sensitivity and specificity of qualitative muscle ultrasound in assessment of suspected neuromuscular disease in childhood. Neuromuscul Disord 2007;17:517–523. [DOI] [PubMed] [Google Scholar]
- 13.Pillen S, Verrips A, van Alfen N, Arts IM, Sie LT, Zwarts MJ. Quantitative skeletal muscle ultrasound: diagnostic value in childhood neuromuscular disease. Neuromuscul Disord 2007;17:509–516. [DOI] [PubMed] [Google Scholar]
- 14.Pillen S, Arts IM, Zwarts MJ. Muscle ultrasound in neuromuscular disorders. Muscle Nerve 2008;37:679–693. [DOI] [PubMed] [Google Scholar]
- 15.Heckmatt JZ, Pier N, Dubowitz V. Real-time ultrasound imaging of muscles. Muscle Nerve 1988;11:56–65. [DOI] [PubMed] [Google Scholar]
- 16.Maurits NM, Beenakker EA, van Schaik DE, Fock JM, van der Hoeven JH. Muscle ultrasound in children: normal values and application to neuromuscular disorders. Ultrasound Med Biol 2004;30:1017–1027. [DOI] [PubMed] [Google Scholar]
- 17.Zaidman CM, Holland MR, Anderson CC, Pestronk A. Calibrated quantitative ultrasound imaging of skeletal muscle using backscatter analysis. Muscle Nerve 2008;38:893–898. [DOI] [PubMed] [Google Scholar]
- 18.Pillen S, van Dijk JP, Weijers G, Raijmann W, de Korte CL, Zwarts MJ. Quantitative gray-scale analysis in skeletal muscle ultrasound: a comparison study of two ultrasound devices. Muscle Nerve 2009;39:781–786. [DOI] [PubMed] [Google Scholar]
- 19.Pillen S, van Keimpema M, Nievelstein RA, Verrips A, van Kruijsbergen-Raijmann W, Zwarts MJ. Skeletal muscle ultrasonography: visual versus quantitative evaluation. Ultrasound Med Biol 2006;32:1315–1321. [DOI] [PubMed] [Google Scholar]