

Abstract
Frontotemporal lobar degeneration (FTLD) is a neurodegenerative disease of the frontal and temporal neocortex. The single most common pathology underlying FTLD is neuronal degeneration with ubiquitin-positive but tau-negative inclusions consisting of Tar DNA binding proteins (TDP-43). Inclusions containing TDP-43 in neurons are also the most common pathology underlying motor neuron disease (MND). The present study tested the hypothesis that abnormal metabolite patterns within the dorsolateral prefrontal cortex (DLPFC) as well as the motor cortex (MC) may be observed in FTLD patients without motor disorders, using proton magnetic resonance spectroscopy (1H MRS). Twenty-six FTLD patients with cognitive damage and ten controls underwent multivoxel 1H MRS. Absolute concentrations of N-acetyl aspartate (NAA), creatine (Cr), choline (Cho) and myo-inositol (mI) were measured from the DLPFC, the MC and the parietal cortex (PC, an internal control). Statistical analyses were performed for group differences between FTLD patients and controls. Comparisons were also made across brain regions (PC and DLPFC; PC and MC) within FTLD patients. Significant reductions in NAA and Cr along with increased Cho and mI were observed in the DLPFC of FTLD patients compared to controls. Significantly lower NAA and higher Cho were also observed in the MCs of patients as compared to controls. Within the FTLD patients, both the MC and the DLPFC exhibited significantly decreased NAA and elevated Cho compared to the PC. However, only the DLPFC had significantly lower Cr and higher mI. Abnormal metabolite pattern from the MC supports the hypothesis that FTLD and MND may be closely linked.
Keywords: Frontotemporal lobar degeneration, Motor neuron disease, Proton magnetic resonance spectroscopy, Dorsolateral prefrontal cortex, Motor cortex
Introduction
Frontotemporal lobar degeneration (FTLD) is a progressive neurodegenerative syndrome characterized by tau or ubiquitin positive spherical cortical inclusions, microvacuolar degeneration, and gliosis, affecting predominantly the frontal and anterior temporal lobes [12, 17, 25, 35]. Patients usually present with a progressive decline in cognitive, social, behavioral, and/or language functions. The three major phenotypes of FTLD are categorized as frontal variant FTLD (fvFTLD), progressive non-fluent aphasia (PNFA), and semantic dementia (SD) [17, 21, 36].
Evidence supporting the involvement of the dorsolateral prefrontal cortex (DLPFC) in FTLD is emerging and some investigators have observed reduced glucose metabolism [41] and blood flow [26] in the DLPFC. Voxel based morphometry analyses using high-resolution structural magnetic resonance imaging (MRI) have also demonstrated involvement of the DLPFC region in FTLD patients [18, 39]. These neuroimaging findings are concordant with postmortem histopathological studies on human brain specimens demonstrating neuropathological features of FTLD in the DLPFC [1, 12].
Proton magnetic resonance spectroscopy (1H MRS) enables assessment of metabolic processes, which may lead to a better understanding of underlying pathophysiological events in neurodegenerative diseases [15, 16]. Few 1H MRS studies on FTLD patients have demonstrated multiple brain metabolite alterations, such as a decrease in N-acetyl aspartate (NAA) along with an increase in choline (Cho) and myo-inositol (mI), using creatine (Cr) as an internal reference. The abnormal metabolic features have been observed from different regions of the brain, such as anterior cingulate cortex (ACC) [8], posterior cingulate cortex (PCC) [29], medial frontal cortex (MFC) [11] and temporal cortex (TC) [8, 11]. However, metabolite abnormalities from the DLPFC region have not been reported. The motor cortex (MC) is another region that remains unexplored on 1H MRS of FTLD patients. There is increasing evidence of a clinical and pathological overlap between FTLD and motor neuron disease (MND). Recent discovery of Tar DNA binding protein-43 (TDP-43) as a disease protein, common to both FTLD and MND conditions [38], has helped to conceptualize the occurrence of FTLD syndromes in patients with clinical evidence of MND [22, 38]. Some FTLD patients with clinically normal motor examinations have manifested abnormal needle electromyography (EMG) of the tongue and extremity muscles [34]. EMG nonspecifically demonstrates abnormalities of the lower motor neuron; evidence of an abnormality in the upper motor neuron segment in FTLD patients without clinical evidence of MND would be valuable.
The present study was designed to test the hypothesis that FTLD patients will exhibit abnormal 1H MRS metabolite patterns within the DLPFC and MC regions. To test this hypothesis, we performed multivoxel proton magnetic resonance spectroscopic imaging (1H MRSI) in the DLPFC and MC regions of patients with FTLD who presented with no clinical signs of motor system abnormality.
Materials and methods
Subjects
The primary inclusion criterion for this study was a diagnosis of FTLD with any of the three phenotypes (fvFTLD, PNFA and SD). All subjects were evaluated by an experienced neurologist (MG) with expertise in dementia illnesses using a semi-structured medical history, a complete neurological examination, and a detailed mental status evaluation, including administration of the Philadelphia Brief Assessment of Cognition [31]. All recruited patients met international consensus diagnostic criteria for FTLD [36]. Cognitive tests such as mini-mental state examination (MMSE), verbal fluency with phonemic and semantic cues tests, verbal short-term memory test (Digit Span), and executive function tests (Trail-Making Test B) were performed on all patients. Behavioral and psychiatric disturbances were evaluated with the Neuropsychiatric Inventory [9] and Frontal Behavioral Inventory [28]. The mean (±SD) MMSE score was 23.63 ± 5.82.
Exclusion criteria were: (1) presence of intracranial mass lesions or subdural hematomas on T1 and T2 weighted images as determined by a neuroradiologist (SW); (2) clinical evidence of stroke, although some patients demonstrated occasional white matter changes on conventional T1 and T2 weighted images; (3) history of traumatic brain injury or presence of other neurological disease; (4) major depressive disorder, bipolar disorder, schizophrenia, substance use, or mental retardation; (5) significant medical problems such as poorly controlled diabetes mellitus, or hypertension or cancer within the past 10 years.
Based upon the inclusion and exclusion criteria, twenty-six FTLD patients (mean age = 64.35 ± 6.66 years, 16M/10F) were recruited for this study. The study was approved by the Institutional Review Board and informed consent was obtained from all participants. Two independent examiners established consensus diagnosis for FTLD patients using a modification of published criteria [37], with a subsequent designation of one of the three major clinical subtypes: fvFTLD, PNFA, and SD [37]. Participants included 19 patients with fvFTLD, 5 patients with PNFA and 2 with SD phenotypes. None of the patients demonstrated clinical evidence of weakness, loss of muscle bulk, fasciculations or spasticity suggestive of MND. In addition, 10 normal healthy age-matched volunteers (mean age, 59.0 ± 8.79 years, 6M/4F) acted as controls. There was no statistical difference in the mean age between the patient group and healthy subjects (p > 0.05).
Data acquisition
Magnetic resonance imaging (MRI) and multivoxel magnetic resonance spectroscopic imaging (1H MRSI) were performed on a 3 Tesla Tim Trio whole body MR system (Siemens Medical Systems, Erlangen, Germany) equipped with a standard quadrature head coil provided by the manufacturer. The imaging protocol included three-plane scout localizer, 3D T1-weighted magnetization prepared rapid gradient echo (MPRAGE) [Repetition time (TR)/echo time (TE)/inversion time (TI)/flip angle (FA) = 1,620/3.9/950 ms/15°, 192 × 256 matrix size, 1 mm slice thickness] and axial T2 weighted images (TR/TE = 2,660/91 ms, 3 mm slice thickness).
1H MRSI
Single slice two-dimensional (2D) multivoxel 1H MRSI was performed using a spin echo (point resolved spectroscopy) sequence with water suppression by means of a chemical shift selective saturation (CHESS) pulse. Sequence parameters included: TR/TE/FA = 17,00/30 ms/90°, number of excitations (NEX) = 3, field of view = 16 × 15 cm2, slice thickness = 20 mm resulting in a voxel size of 10 × 9.4 × 20 mm3, bandwidth = 1,200 Hz, matrix size = 16 × 16, vector size = 1,024. The volume of interest (VOI) was selected so as to include the DLPFC, MC and PC regions bilaterally avoiding the scalp, skull base or sinuses. The VOI was centered on the central sulcus, carefully chosen to ensure the same locations in each subject, based on anatomical landmarks. Eight outer volume saturation slabs (30 mm thick) were placed outside the VOI to suppress lipid signals from the scalp. The data set was acquired using elliptical k-space sampling with weighted phase encoding to reduce the acquisition time. Total acquisition time for 1H MRSI sequence was 6 min and 53 s. Manual shimming was performed to achieve an optimal full width half maximum of <20 Hz (magnitude spectrum) of the water signal. A water unsuppressed 1H MRSI spectrum was also acquired to use the water signal for computing metabolite concentrations.
Data analysis
1H MRSI data were analyzed from voxels encompassing at least 50% of the DLPFC, MC and PC regions as shown in Fig. 1. The PC has been reported to be relatively spared from atrophy and metabolic abnormalities in FTLD patients [18, 52], and was thus used as an internal control in this study. Absolute concentrations of metabolites were measured using a user-independent spectral fit program [Linear Combination (LC) Model] [44, 45]. The region between 0.2 and 4.0 ppm of the spectrum was analyzed and the following metabolites were evaluated: NAA, 2.02 ppm; Cr, 3.02 ppm; Cho, 3.22 ppm; mI, 3.56 ppm. The average metabolite concentration from each region (DLPFC, MC and PC) was computed by calculating the mean concentration from all voxels within the specific region as shown in Fig. 1. The error in the spectral fitting routine (LC Model) was used to assess the spectral quality for a particular voxel; metabolite concentrations from only those voxels were used which had standard deviations (SD) of less than 20% for all the metabolites.
Fig. 1.
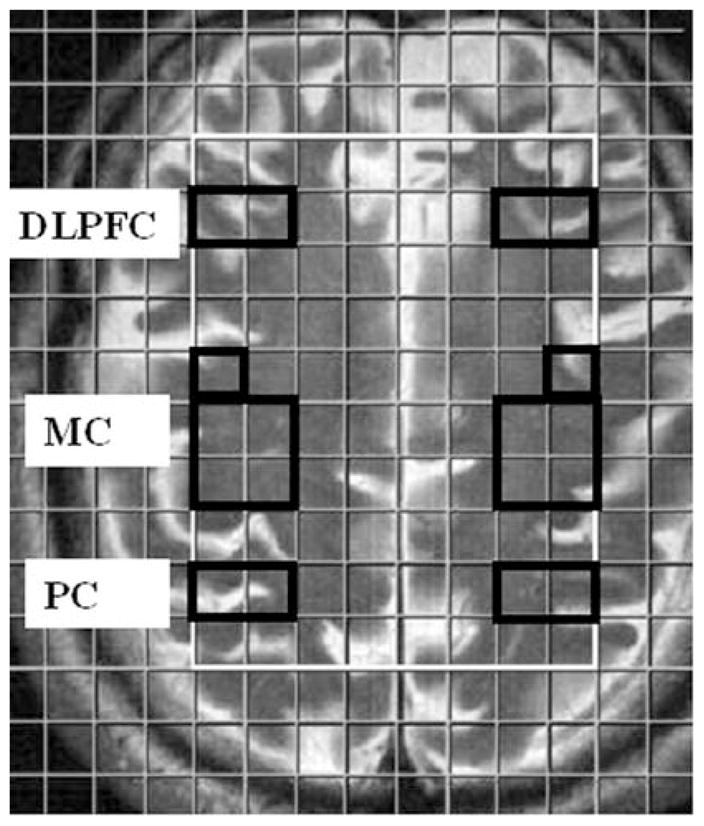
1H MRSI grid overlaid over axial T2 weighted image demonstrating the location of voxels from DLPFC, MC and PC regions of the brain
Statistical analysis
Concentrations of NAA, Cr, Cho, and mI were compared between FTLD and control groups from the DLPFC, MC and PC regions using a two-tailed Student t-test. A probability (p) value of less than 0.05 was considered significant. Comparisons were also made across brain regions (between PC and DLPFC, between PC and MC) within the FTLD group by one-way analysis of variance (ANOVA). If an ANOVA test was found to be significant (p < 0.05), a post-hoc test (Bonferroni test) was performed. All data analysis was performed using a statistical tool (SPSS for Windows, version 15.0; SPSS Inc., Chicago, III, USA).
Results
Representative spectra from the DLPFC, MC and PC regions of an FTLD patient are shown in Fig. 2. These spectra demonstrate lower NAA and Cr along with higher Cho and mI in the DLPFC and MC regions in comparison to the PC region. No significant difference in metabolite concentrations between the PC regions of patients and controls was observed (p > 0.05), confirming that the PC in FTLD patients is metabolically preserved.
Fig. 2.

Representative spectra from different cortical regions of an FTLD patient demonstrating various metabolites. Numbers in parenthesis indicate the metabolite concentrations in mM
A comparison of metabolite concentrations from different cortical regions of normal controls and FTLD patients is shown in Fig. 3. The DLPFC region in FTLD patients exhibited significant reductions in NAA and Cr along with increased Cho and mI in comparison to healthy controls (p < 0.05). Similarly, significantly lower NAA and higher Cho levels were observed from the MCs of FTLD patients as compared to normal controls (p < 0.05). A non-significant (p = 0.06), but higher mI was also observed from the MCs of FTLD patients in comparison to healthy controls.
Fig. 3.

Bar diagrams demonstrating comparison of mean metabolite concentration (mM units) between normal controls (Cont) and FTLD patients (FTLD) from DLPFC, MC and PC regions. Error bars indicate ± 1SD. *indicates statistical significance (p < 0.05)
Regional variations in metabolite concentrations were observed from FTLD patients in that both MC and DLPFC regions had significantly lower NAA [F ratio (variance between samples/variance within samples) = 76.38], and higher Cho (F ratio = 7.20) compared to PC (p < 0.05, one-way ANOVA). A significantly lower Cr (F ratio = 17.51) and elevated mI levels (F ratio = 16.74) were also observed from only the DLPFC region as compared to the PC region (p < 0.05; Fig. 4).
Fig. 4.

Bar diagrams showing variations in mean concentration (mM units) of metabolites from different cortical regions within FTLD patients. Error bars indicate ± 1SD. * indicates that results from ANOVA test are significant (p <0.05)
Discussion
In the present study, we observed an abnormal metabolite pattern in the DLPFC and MC regions in patients with FTLD reflecting metabolic deterioration in these regions. Previous 1H MRS studies in FTLD patients have reported abnormal metabolite patterns from the anterior cingulate cortex, posterior cingulate cortex, medial frontal cortex and temporal cortex of the brain [8, 11, 29]. Abnormal glucose metabolism from other gray matter structures of the brain in FTLD patients has also been observed [24] suggesting that metabolic abnormality in FTLD is more diffuse and widespread than previously understood, extending beyond the previously reported regions.
The DLPFC and MC regions constitute major functional loci in the normal brain. The DLPFC, encompassing Brodmann’s areas 9, 10 and 46 [42] regulates executive functions and organizes behavioral responses and strategies in learning new tasks [2]. It is one of the last regions to mature in the human brain, consistent with its integrative role in cognitive functions [14, 49]. Damage to the DLPFC causes dorsolateral syndrome, which impairs decision making, working memory and planning [23]. In a recent study, patients with FTLD performed poorly on neuropsychological tests assessing prefrontal functioning in comparison to healthy subjects [31], implicating involvement of the DLPFC, and confirmed in patients with known FTLD pathology [19].
The MC region encompasses Broadman’s areas 4 and 6 and is considered not only as an executive locus for simple voluntary movements but is also known to participate in motor functions [13]. Metabolite alterations have been observed from MC regions in MND patients without any evidence of FTLD [3, 5, 43, 50]. We observed decreased NAA and elevated Cho within this region in our population of FTLD patients who did not have any overt motor impairment. It is now widely believed that FTLD and MND represent different manifestations of the same neurodegenerative disorder. As many as 50% of patients screened for MND meet the criteria for possible or probable FTLD [32]. In addition, about 30% of FTLD patients meet the criteria for possible or definite MND [33]. Increasing neuropathological evidence [1, 20] supports the observations of clinical overlap between FTLD and MND [38]. Ubiquitination of TDP-43 protein that aggregates in the cytoplasm and/or nucleus of neurons is the key characteristic shared by these two neurodegenerative diseases [38].
Recently, a 1H MRS study reported an abnormal metabolite pattern from the MC region in an FTLD patient who also had clinical MND [47]. Our observation of an abnormal metabolite pattern from the MC region in FTLD patients who were clinically asymptomatic for motor impairments extends this finding and is in concordance with reports of subclinical MND in patients with FTLD [27]. While FTLD patients may not exhibit clinical features of MND, this body of work suggests that there is a continuum of pathological process from FTLD to FTLD/MND and to MND.
Our observation of reduced NAA in both the DLPFC and MC regions is consistent with other reports of reduced NAA in many pathological conditions [7, 46, 53]. Reduced NAA concentration reflects loss or dysfunction of neurons and axons. It is believed that nerve cell degeneration in FTLD is probably induced by accumulation of mutated and structurally misfolded and ubiquitinated proteins [38].
We observed a significant reduction in Cr in the DLPFC compared to the PC. Decreased Cr from the midfrontal cortex has also been reported in FTLD patients [11]. The reduction in Cr is indicative of an energy deficit that might result from a defect in oxidative metabolism in impaired cells. Such a hypothesis is concordant with a report of ultrastructural damage in neuronal mitochondria in a patient with FTLD [6].
We also observed higher mI in the DLPFC and MC regions of FTLD patients. 1H MRS detectable mI is thought to be a marker of neuroglial cells and is an important organic osmolyte [4]. Increased mI might indicate elevated neuroglial concentration. In neuropathological studies of dementia including FTLD, gliosis has been associated with neuronal loss [48]. It is possible that in response to neuronal loss, neuroglial cells become diseased, resulting in disruption of osmotic balance. Myoinositol may accumulate within the neuroglial cells to regulate osmotic balance, thereby maintaining cell volume homeostasis. We believe that the combined effect of gliosis and osmotic stress may be responsible for increased mI concentration observed in the DLPFC and MC regions.
The combined Cho resonance visible on 1H MRS is thought to be due to cytosolic Cho, phosphocholine (precursor for membrane phosphatidylcholine biosynthesis) and glycerophosphocholine (breakdown product of membrane phosphatidylcholine) [30]. A possible explanation for the elevation of Cho in FTLD patients is an increase in membrane turnover, secondary to dying back of the neurophil (degeneration of axons and dendritic processes following disruption of axonal/dendritic transport and/or nerve cell death). Thus a significant increase in Cho concentration from both DLPFC and MC regions in the present study is suggestive of a higher membrane turnover occurring in these regions.
Previous 1H MRS studies on FTLD patients have reported their results as metabolic ratios with respect to Cr. However, as demonstrated in the present study, a reduction in Cr concentration is observed in FTLD patients, which may lead to an over-estimation in metabolic abnormality in NAA and Cho. Variations in Cr level have also been observed in patients with dementia [51]. Thus, we believe that measurement of absolute metabolite concentrations as performed in the present study provides a more reliable and sensitive indicator of metabolic abnormality in FTLD patients.
Although the 1H MRSI technique offers the ability to acquire spectra from multiple contiguous voxels simultaneously, the current study is limited by the fact that 1H MRSI was performed from a single slice, which covered only the frontal and parietal regions of the brain. The temporal lobe is another important region that is known to be affected in FTLD, and was not covered in the FOV of the present single slice study. In order to cover a larger segment of the brain, it is necessary to perform 3D 1H MRSI studies. However, 3D 1HMRSI techniques are limited by increased acquisition times that could be prohibitive in clinical settings. A strategy to overcome this shortcoming may be the use of parallel 1H MRS [40] or echo-planar spectroscopic imaging [10] techniques.
Conclusion
The present study demonstrates 1H MRS abnormalities in the DLFPC and MC regions of FTLD patients and provides further evidence that FTLD and MND present a pathophysiological continuum of neurodegeneration.
Acknowledgments
The support of MRI coordinator Alea Khan and technologists Doris Cain, Tonya Kurtz and Patricia O’ Donnell is gratefully acknowledged. This work was funded by NIH grants AG17586, NS44266 and AG15116.
Contributor Information
Sanjeev Chawla, Department of Radiology, University of Pennsylvania, B6 Blockley Hall, 423 Guardian Drive, Philadelphia, PA 19104, USA.
Sumei Wang, Department of Radiology, University of Pennsylvania, B6 Blockley Hall, 423 Guardian Drive, Philadelphia, PA 19104, USA.
Peachie Moore, Department of Neurology, University of Pennsylvania, Philadelphia, PA, USA.
John H. Woo, Department of Radiology, University of Pennsylvania, B6 Blockley Hall, 423 Guardian Drive, Philadelphia, PA 19104, USA
Lauren Elman, Department of Neurology, University of Pennsylvania, Philadelphia, PA, USA.
Leo F. McCluskey, Department of Neurology, University of Pennsylvania, Philadelphia, PA, USA
Elias R. Melhem, Department of Radiology, University of Pennsylvania, B6 Blockley Hall, 423 Guardian Drive, Philadelphia, PA 19104, USA
Murray Grossman, Department of Neurology, University of Pennsylvania, Philadelphia, PA, USA.
Harish Poptani, Email: poptanih@uphs.upenn.edu, Harish.Poptani@uphs.upenn.edu, Department of Radiology, University of Pennsylvania, B6 Blockley Hall, 423 Guardian Drive, Philadelphia, PA 19104, USA.
References
- 1.Bigio EH, Lipton AM, White CL, 3rd, Dickson DW, Hirano A. Frontotemporal and motor neurone degeneration with neurofilament inclusion bodies: additional evidence for overlap between FTD and ALS. Neuropathol Appl Neurobiol. 2003;29:239–253. doi: 10.1046/j.1365-2990.2003.00466.x. [DOI] [PubMed] [Google Scholar]
- 2.Blumenfeld RS, Ranganath C. Dorsolateral prefrontal cortex promotes long-term memory formation through its role in working memory organization. J Neurosci. 2006;26:916–925. doi: 10.1523/JNEUROSCI.2353-05.2006. [DOI] [PMC free article] [PubMed] [Google Scholar]
- 3.Bowen BC, Pattany PM, Bradley WG, Murdoch JB, Rotta F, Younis AA, Duncan RC, Quencer RM. MR imaging and localized proton spectroscopy of the precentral gyrus in amyotrophic lateral sclerosis. Am J Neuroradiol. 2000;21:647–658. [PMC free article] [PubMed] [Google Scholar]
- 4.Brand A, Richter-Landsberg C, Leibfritz D. Multinuclear NMR studies on the energy metabolism of glial and neuronal cells. Dev Neurosci. 1993;15:289–298. doi: 10.1159/000111347. [DOI] [PubMed] [Google Scholar]
- 5.Chan S, Shungu DC, Douglas-Akinwande A, Lange DJ, Rowland LP. Motor neuron diseases: comparison of single-voxel proton MR spectroscopy of the motor cortex with MR imaging of the brain. Radiology. 1999;212:763–769. doi: 10.1148/radiology.212.3.r99au35763. [DOI] [PubMed] [Google Scholar]
- 6.Chang L, Cornford M, Miller BL, Itabashi H, Mena I. Neuronal ultrastructural abnormalities in a patient with frontotemporal dementia and motor neuron disease. Dementia. 1995;6:1–8. doi: 10.1159/000106915. [DOI] [PubMed] [Google Scholar]
- 7.Cordery RJ, MacManus D, Godbolt A, Rossor MN, Waldman AD. Short TE quantitative proton magnetic resonance spectroscopy in variant Creutzfeldt-Jakob disease. Eur Radiol. 2006;16:1692–1698. doi: 10.1007/s00330-005-0090-4. [DOI] [PubMed] [Google Scholar]
- 8.Coulthard E, Firbank M, English P, Welch J, Birchall D, O’Brien J, Griffiths TD. Proton magnetic resonance spectroscopy in frontotemporal dementia. J Neurol. 2006;253:861–868. doi: 10.1007/s00415-006-0045-y. [DOI] [PubMed] [Google Scholar]
- 9.Cummings JL, Mega M, Gray K, Rosenberg-Thompson S, Carusi DA, Gornbein J. The neuropsychiatric inventory: comprehensive assessment of psychopathology in dementia. Neurology. 1994;44:2308–2314. doi: 10.1212/wnl.44.12.2308. [DOI] [PubMed] [Google Scholar]
- 10.Ebel A, Soher BJ, Maudsley AA. Assessment of 3D proton MR echo-planar spectroscopic imaging using automated spectral analysis. Magn Reson Med. 2001;46:1072–1078. doi: 10.1002/mrm.1301. [DOI] [PubMed] [Google Scholar]
- 11.Ernst T, Chang L, Melchor R, Mehringer CM. Frontotemporal dementia and early Alzheimer disease: differentiation with frontal lobe H-1 MR spectroscopy. Radiology. 1997;203:829–836. doi: 10.1148/radiology.203.3.9169712. [DOI] [PubMed] [Google Scholar]
- 12.Forman MS, Farmer J, Johnson JK, Clark CM, Arnold SE, Coslett HB, Chatterjee A, Hurtig HI, Karlawish JH, Rosen HJ, Van Deerlin V, Lee VM, Miller BL, Trojanowski JQ, Grossman M. Frontotemporal dementia: clinicopathological correlations. Ann Neurol. 2006;59:952–962. doi: 10.1002/ana.20873. [DOI] [PMC free article] [PubMed] [Google Scholar]
- 13.Gerloff C, Corwell B, Chen R, Hallett M, Cohen LG. The role of the human motor cortex in the control of complex and simple finger movement sequences. Brain. 1998;121:1695–1709. doi: 10.1093/brain/121.9.1695. [DOI] [PubMed] [Google Scholar]
- 14.Giedd JN, Blumenthal J, Jeffries NO, Castellanos FX, Liu H, Zijdenbos A, Paus T, Evans AC, Rapoport JL. Brain development during childhood and adolescence: a longitudinal MRI study. Nat Neurosci. 1999;2:861–863. doi: 10.1038/13158. [DOI] [PubMed] [Google Scholar]
- 15.Griffith HR, den Hollander JA, Okonkwo OC, O’Brien T, Watts RL, Marson DC. Brain metabolism differs in Alzheimer’s disease and Parkinson’s disease dementia. Alzheimers Dement. 2008;4:421–427. doi: 10.1016/j.jalz.2008.04.008. [DOI] [PMC free article] [PubMed] [Google Scholar]
- 16.Grosskreutz J, Kaufmann J, Frädrich J, Dengler R, Heinze HJ, Peschel T. Widespread sensorimotor and frontal cortical atrophy in amyotrophic lateral sclerosis. BMC Neurol. 2006;25:6–17. doi: 10.1186/1471-2377-6-17. [DOI] [PMC free article] [PubMed] [Google Scholar]
- 17.Grossman M. Frontotemporal dementia: a review. J Int Neuropsychol Soc. 2002;8:566–583. doi: 10.1017/S1355617702814 357. [DOI] [PubMed] [Google Scholar]
- 18.Grossman M, Libon DJ, Forman MS, Massimo L, Wood E, Moore P, Anderson C, Farmer J, Chatterjee A, Clark CM, Coslett HB, Hurtig HI, Lee VM, Trojanowski JQ. Distinct ante-mortem profiles in patients with pathologically defined frontotemporal dementia. Arch Neurol. 2007;64:1601–1609. doi: 10.1001/archneur.64.11.1601. [DOI] [PubMed] [Google Scholar]
- 19.Grossman M, Xie SX, Libon DJ, Wang X, Massimo L, Moore P, Vesely L, Berkowitz R, Chatterjee A, Coslett HB, Hurtig HI, Forman MS, Lee VM, Trojanowski JQ. Longitudinal decline in autopsy-defined frontotemporal lobar degeneration. Neurology. 2008;70:2036–2045. doi: 10.1212/01.wnl.0000303816.25065.bc. [DOI] [PMC free article] [PubMed] [Google Scholar]
- 20.Guedj E, Le Ber I, Lacomblez L, Dubois B, Verpillat P, Didic M, Salachas F, Vera P, Hannequin D, Lotterie JA, Puel M, Decousus M, Thomas-Antérion C, Magne C, Vercelletto M, Bernard AM, Golfier V, Pasquier J, Michel BF, Namer I, Sellal F, Bochet J, Volteau M, Brice A, Meininger V, Habert MO French RESEARCH NETWORK on FTD/FTD-MND. Brain SPECT perfusion of frontotemporal dementia associated with motor neuron disease. Neurology. 2007;69:488–490. doi: 10.1212/01.wnl. 0000266638.53185.e7. [DOI] [PubMed] [Google Scholar]
- 21.Hodges JR, Miller B. The classification, genetics and neuropathology of frontotemporal dementia. Introduction to the special topic papers: part I. Neurocase. 2001;7:31–35. doi: 10.1093/neucas/7.1.31. [DOI] [PubMed] [Google Scholar]
- 22.Hosler BA, Siddique T, Sapp PC, Sailor W, Huang MC, Hossain A, Daube JR, Nance M, Fan C, Kaplan J, Hung WY, McKenna-Yasek D, Haines JL, Pericak-Vance MA, Horvitz HR, Brown RH., Jr Linkage of familial amyotrophic lateral sclerosis with frontotemporal dementia to chromosome 9q21–q22. JAMA. 2000;284:1664–1669. doi: 10.1001/jama.284.13.1664. [DOI] [PubMed] [Google Scholar]
- 23.Imre S. Disorders of executive consciousness. Ideggyogy Sz. 2004;57:292–300. [PubMed] [Google Scholar]
- 24.Ishii K, Sakamoto S, Sasaki M, Kitagaki H, Yamaji S, Hashimoto M, Imamura T, Shimomura T, Hirono N, Mori E. Cerebral glucose metabolism in patients with frontotemporal dementia. J Nucl Med. 1998;39:1875–1878. [PubMed] [Google Scholar]
- 25.Jackson M, Lowe J. The new neuropathology of degenerative frontotemporal dementias. Acta Neuropathol. 1996;91:127–134. doi: 10.1007/s004010050403. [DOI] [PubMed] [Google Scholar]
- 26.Jagust WJ, Reed BR, Seab JP, Kramer JH, Budinger TF. Clinical-physiologic correlates of Alzheimer’s disease and frontal lobe dementia. Am J Physiol Imaging. 1989;4:89–96. [PubMed] [Google Scholar]
- 27.Josephs KA, Parisi JE, Knopman DS, Boeve BF, Petersen RC, Dickson DW. Clinically undetected motor neuron disease in pathologically proven frontotemporal lobar degeneration with motor neuron disease. Arch Neurol. 2006;63:506–512. doi: 10.1001/archneur.63.4.506. [DOI] [PubMed] [Google Scholar]
- 28.Kertesz A, Davidson W, Fox H. Frontal behavioral inventory: diagnostic criteria for frontal lobe dementia. Can J Neurol Sci. 1997;24:29–36. doi: 10.1017/s0317167100021053. [DOI] [PubMed] [Google Scholar]
- 29.Kizu O, Yamada K, Ito H, Nishimura T. Posterior cingulate metabolic changes in frontotemporal lobar degeneration detected by magnetic resonance spectroscopy. Neuroradiology. 2004;46:277–281. doi: 10.1007/s00234-004-1167-5. [DOI] [PubMed] [Google Scholar]
- 30.Klein J. Membrane breakdown in acute and chronic neurodegeneration: focus on choline-containing phospholipids. J Neural Transm. 2000;107:1027–1063. doi: 10.1007/s007020070051. [DOI] [PubMed] [Google Scholar]
- 31.Libon DJ, Massimo L, Moore P, Coslett HB, Chatterjee A, Aguirre GK, Rice A, Vesely L, Grossman M. Screening for frontotemporal dementias and Alzheimer’s disease with the Philadelphia brief assessment of cognition: a preliminary analysis. Dement Geriatr Cogn Disord. 2007;24:441–447. doi: 10.1159/000110577. [DOI] [PubMed] [Google Scholar]
- 32.Lomen-Hoerth C, Anderson T, Miller B. The overlap of amyotrophic lateral sclerosis and frontotemporal dementia. Neurology. 2002;59:1077–1079. doi: 10.1212/wnl.59.7.1077. [DOI] [PubMed] [Google Scholar]
- 33.Lomen-Hoerth C, Murphy J, Langmore S, Kramer JH, Olney RK, Miller B. Are amyotrophic lateral sclerosis patients cognitively normal? Neurology. 2003;60:1094–1097. doi: 10.1212/01.wnl.0000055861.95202.8d. [DOI] [PubMed] [Google Scholar]
- 34.Lomen-Hoerth C. Characterization of amyotrophic lateral sclerosis and frontotemporal dementia. Dement Geriatr Cogn Disord. 2004;17:337–341. doi: 10.1159/000077167. [DOI] [PubMed] [Google Scholar]
- 35.Mann DM. Dementia of frontal type and dementias with subcortical gliosis. Brain Pathol. 1998;8:325–338. doi: 10.1111/j.1750-3639.1998.tb00157.x. [DOI] [PMC free article] [PubMed] [Google Scholar]
- 36.McKhann GM, Albert MS, Grossman M, Miller B, Dickson D, Trojanowski JQ. Work Group on Frontotemporal Dementia and Pick’s Disease. Clinical and pathological diagnosis of frontotemporal dementia: report of the Work Group on Frontotemporal Dementia and Pick’s Disease. Arch Neurol. 2001;58:1803–1809. doi: 10.1001/archneur.58.11.1803. [DOI] [PubMed] [Google Scholar]
- 37.Neary D, Snowden JS, Gustafson L, Passant U, Stuss D, Black S, Freedman M, Kertesz A, Robert PH, Albert M, Boone K, Miller BL, Cummings J, Benson DF. Frontotemporal lobar degeneration: a consensus on clinical diagnostic criteria. Neurology. 1998;51:1546–1554. doi: 10.1212/wnl.51.6.1546. [DOI] [PubMed] [Google Scholar]
- 38.Neumann M, Sampathu DM, Kwong LK, Truax AC, Micsenyi MC, Chou TT, Bruce J, Schuck T, Grossman M, Clark CM, McCluskey LF, Miller BL, Masliah E, Mackenzie IR, Feldman H, Feiden W, Kretzschmar HA, Trojanowski JQ, Lee VM. Ubiquitinated TDP-43 in frontotemporal lobar degeneration and amyotrophic lateral sclerosis. Science. 2006;314:130–133. doi: 10.1126/science.1134108. [DOI] [PubMed] [Google Scholar]
- 39.Ogar JM, Dronkers NF, Brambati SM, Miller BL, Gorno-Tempini ML. Progressive nonfluent aphasia and its characteristic motor speech deficits. Alzheimer Dis Assoc Disord. 2007;21:S23–S30. doi: 10.1097/WAD.0b013e31815d19fe. [DOI] [PubMed] [Google Scholar]
- 40.Osorio JA, Ozturk-Isik E, Xu D, Cha S, Chang S, Berger MS, Vigneron DB, Nelson SJ. 3D 1H MRSI of brain tumors at 3.0 Tesla using an eight-channel phased-array head coil. J Magn Reson Imaging. 2007;26:23–30. doi: 10.1002/jmri.20970. [DOI] [PubMed] [Google Scholar]
- 41.Peters F, Perani D, Herholz K, Holthoff V, Beuthien-Baumann B, Sorbi S, Pupi A, Degueldre C, Lemaire C, Collette F, Salmon E. Orbitofrontal dysfunction related to both apathy and dis-inhibition in frontotemporal dementia. Dement Geriatr Cogn Disord. 2006;21:373–379. doi: 10.1159/000091898. [DOI] [PubMed] [Google Scholar]
- 42.Petrides M, Pandya DN. Dorsolateral prefrontal cortex: comparative cytoarchitectonic analysis in the human and the macaque brain and corticocortical connection patterns. Eur J Neurosci. 1999;11:1011–1036. doi: 10.1046/j.1460-9568.1999.00518.x. [DOI] [PubMed] [Google Scholar]
- 43.Pohl C, Block W, Träber F, Schmidt S, Pels H, Grothe C, Schild HH, Klockgether T. Proton magnetic resonance spectroscopy and transcranial magnetic stimulation for the detection of upper motor neuron degeneration in ALS patients. J Neurol Sci. 2001;190:21–27. doi: 10.1016/S0022-510X(01)00568-8. [DOI] [PubMed] [Google Scholar]
- 44.Provencher SW. Estimation of metabolite concentrations from localized in vivo proton NMR spectra. Magn Reson Med. 1993;30:672–679. doi: 10.1002/mrm.1910300604. [DOI] [PubMed] [Google Scholar]
- 45.Provencher SW. Automatic quantitation of localized in vivo 1H spectra with LCModel. NMR Biomed. 2001;14:260–264. doi: 10.1002/nbm.698. [DOI] [PubMed] [Google Scholar]
- 46.Rigotti DJ, Inglese M, Gonen O. Whole-brain N-acetyl-aspartate as a surrogate marker of neuronal damage in diffuse neurologic disorders. Am J Neuroradiol. 2007;28:1843–1849. doi: 10.3174/ajnr.A0774. [DOI] [PMC free article] [PubMed] [Google Scholar]
- 47.Sarac H, Zagar M, Vranjes D, Henigsberg N, Bilić E, Pavlisa G. Magnetic resonance imaging and magnetic resonance spectroscopy in a patient with amyotrophic lateral sclerosis and frontotemporal dementia. Coll Antropol. 2008;32(Suppl 1):205–210. [PubMed] [Google Scholar]
- 48.Schofield E, Kersaitis C, Shepherd CE, Kril JJ, Halliday GM. Severity of gliosis in Pick’s disease and frontotemporal lobar degeneration: tau-positive glia differentiate these disorders. Brain. 2003;126:827–840. doi: 10.1093/brain/awg085. [DOI] [PubMed] [Google Scholar]
- 49.Sowell ER, Thompson PM, Holmes CJ, Jernigan TL, Toga AW. In vivo evidence for post-adolescent brain maturation in frontal and striatal regions. Nat Neurosci. 1999;2:859–861. doi: 10.1038/13154. [DOI] [PubMed] [Google Scholar]
- 50.Wang S, Poptani H, Woo JH, Desiderio LM, Elman LB, McCluskey LF, Krejza J, Melhem ER. Amyotrophic lateral sclerosis: diffusion-tensor and chemical shift MR imaging at 3.0 T. Radiology. 2006;239:831–838. doi: 10.1148/radiol.2393050573. [DOI] [PubMed] [Google Scholar]
- 51.Watanabe T, Shiino A, Akiguchi I. Absolute quantification in proton magnetic resonance spectroscopy is superior to relative ratio to discriminate Alzheimer’s disease from Binswanger’s disease. Dement Geriatr Cogn Disord. 2008;26:89–100. doi: 10.1159/000144044. [DOI] [PubMed] [Google Scholar]
- 52.Whitwell JL, Josephs KA, Rossor MN, Stevens JM, Revesz T, Holton JL, Al-Sarraj S, Godbolt AK, Fox NC, Warren JD. Magnetic resonance imaging signatures of tissue pathology in frontotemporal dementia. Arch Neurol. 2005;62:1402–1408. doi: 10.1001/archneur.62.9.1402. [DOI] [PubMed] [Google Scholar]
- 53.Xuan X, Ding M, Gong X. Proton magnetic resonance spectroscopy detects a relative decrease of N-acetylaspartate in the hippocampus of patients with dementia with Lewy bodies. J Neuroimaging. 2008;18:137–141. doi: 10.1111/j.1552-6569.2007.00203.x. [DOI] [PubMed] [Google Scholar]