Abstract
Both lipids and mucins contribute to the stability of the tear film and lipids may inhibit tears from evaporating. Younger people have lower lipid viscosity, higher lipid volume, and a lower rate of tear evaporation. Since age-related changes in human meibum composition and conformation have never been investigated, as a basis for the study of lipid-associated changes with meibomian gland dysfunction, we used the power of infrared spectroscopy to characterize hydrocarbon chain conformation and packing in meibum from humans without dry eye symptoms in relation to age and sex. Meibum from normal human donors ranging in age from 3 to 88 years was studied. Meibum phase transitions were quantified by fitting them to a 4-parameter 2-state sigmoidal equation. Human meibum order and phase transition temperatures decrease with age and this trend may be attributed to lipid compositional changes. If meibum has the same thermodynamic properties on the surface of the tears as it does on the lid margin, a decrease in lipid-lipid interaction strength with increasing age could decrease the stability of tears since lipid-lipid interactions on the tear surface must be broken for the tear film to break up. This study also serves as a foundation to examine meibum conformational differences in meibum from people with meibomian gland dysfunction.
Key Words: Aging, Human meibum, Infrared spectroscopy, Lipids, Tears
Introduction
Meibum is delivered from the meibomian gland orifices located on the eyelid margins to the tear film on blinking [1,2] to form a lipid layer about 100 nm thick [3,4,5,6] on the surface of the tear film. Both lipids and mucins stabilize the tear film [7,8,9,10,11] and lipids may inhibit tears from evaporating [12,13]. Meibum may also prevent skin lipids from contaminating tears and prevent tears from flowing over the lid margin, however, species comparison of meibomian gland distribution make this function less likely [14].
There are only a few studies that document changes in tear lipids with age. Younger people have lower lipid viscosity, higher lipid volume [1], and a lower rate of tear evaporation [15]. These studies are in contrast with others that show no human age-related changes in the rate of evaporation [16,17,18].
No age-related meibum compositional studies have been published. Human meibum lipid composition varies greatly from study to study and has been attributed to the different analytical methodologies employed and the inherent variability of biological samples [14]. There are three major lipid classes associated with meibum: wax, hydrocarbons and cholesterol esters. The range of hydrocarbon chain types associated with each class of lipids is extremely diverse in human meibum, potentially complicating a lipidomics analysis [19].
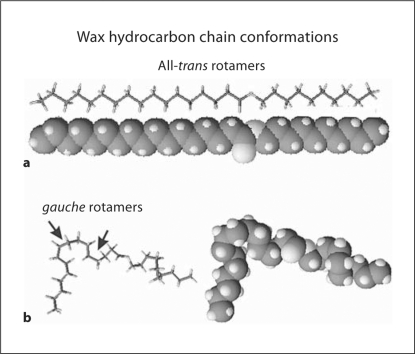
Since all lipids have methylene (CH2) groups, an initial approach to simplify the characterization of potential tear lipid differences with age, sex, and dry eye symptoms is to measure lipid-lipid interactions in terms of hydrocarbon chain order, phase transition enthalpy, entropy, cooperativity, and phase transition temperature [20]. Changes in these parameters would reflect changes in lipid composition. When lipids are highly ordered, the hydrocarbon chain trans rotamers predominate (fig. 1). The lipids can pack tightly and van der Waal's interactions between hydrocarbon chains are maximal. When lipids are fluid, gauche rotamers predominate and cause the hydrocarbon chains to bend (fig. 1). Lipids are far apart from each other and van der Waal's interaction between chains is minimal. Temperature-induced phase transitions from an ordered (more trans) conformation to a disordered (more gauche) conformation can be used to measure the strength of lipid-lipid interactions [21]. The phase transitions are similar to but not the same as melting curves because lipids pack in liquid crystalline structures and even when disordered maintain some structure. In a previous study, phase transitions of human meibum were experimentally reproducible and were similar for multiple samples collected from the same person [21]. The conformational changes observed in the hydrocarbon chains of meibum with temperature suggest that the observed therapeutic increased delivery of meibum with eyelid heating could be related to the increased disorder in the packing of the hydrocarbon tails [21].
Fig. 1.
Stick and space-filling models of a wax in the ordered alltrans rotamer (a), and disordered gauche rotamer conformations (b).
Infrared and fluorescence spectroscopes were also applied to characterize the molecular conformation and structure and dynamics of human meibum and tear lipids [21]. The molecular structure is the arrangement of lipid molecules in space which is defined by the molecular conformation of the molecules. Conformation is defined by the dihedral angles between molecules. Molecular order is a nondynamic, structural term measured using infrared spectroscopy [21]. The dynamic wobble and movement of molecules was measured using fluorescent probes [21]. Meibum contained a significant amount of wax and more C=C and CH3 moieties than tear lipids [21].
Since age-related changes in human meibum have never been investigated, as a basis for the study of lipid-associated changes with meibomian gland dysfunction, we used infrared spectroscopy to characterize hydrocarbon chain conformation and packing in meibum from humans without dry eye symptoms in relation to age and sex.
Materials and Methods
Materials
Silver chloride windows for infrared spectroscopy were obtained from Crystran Limited, Poole, UK.
Collection of Tear Lipids
Meibum was obtained from normal living subjects as described in Kilp et al. [22], except that meibomian gland excreta were collected with a platinum spatula. Normal status was considered when there were patent meibomian gland orifices without evidence of keratinization nor plugging with turbid nor thickened secretions and without dilated blood vessels on the eyelid margin. Meibomian gland expression was done by compressing the eyelid between cotton-tipped applicators with strict attention to avoid touching the eyelid margin during expression. All 4 eyelids were expressed and about 1 mg of meibum was collected per individual for direct spectroscopic study. The expressate was collected with a platinum spatula and immediately spread onto the AgCl window, and the remainder of expressate on the tip then swirled into a solution of anhydrous tetrahydrofuran:methanol (3:1). All samples were then frozen under argon gas until analysis. Analyses were performed within 3 weeks of collection of the sample. Written informed consent was obtained from all donors. Protocols and procedures were approved by the University of Louisville Institutional Review Board as well as the Louisville Veterans Affairs Institutional Review Board, and procedures were in accord with the Declaration of Helsinki.
Fourier Transform Infrared Spectroscopy
Infrared spectra were measured using a Nicolet 5000 Magna Series Fourier transform infrared spectrometer (Thermo Fisher Scientific, Inc., Waltham, Mass., USA). The meibum was placed on the AgCl window and in a temperature-controlled infrared cell holder. The cell was jacketed by an insulated water coil connected to a Neslab R-134A (Neslab Instruments, Newton, N.H., USA) circulating water bath. The sample temperature was measured and controlled by a thermistor touching the sample cell window. The water bath unit was programmed to measure the temperature at the thermistor and to adjust the bath temperature so that the sample temperature was adjusted to the desired set point. The rate of heating or cooling (1°C/15 min) at the sample was also adjusted by the water bath unit. Temperatures were maintained within ±0.01°C. Exactly 150 interferograms were recorded and averaged. Spectral resolution was set to 1.0 cm−1.
Infrared data analysis was performed with GRAMS/386 software (Galactic Industries, Salem, N.H., USA). The frequency of the CH2 band near 2,850 cm−1 was used to estimate the content of trans and gauche rotamers in the hydrocarbon chains (see Introduction). was calculated by first baseline leveling the CH stretching region near 3,100 and 2,700 cm−1. The center of mass of the CH2 symmetric stretching band was calculated by integrating the top 105 of the intensity of the band. The baseline for integrating the top 10% of the intensity of the band was parallel to the −CH region baseline.
Lipid CH2 groups in the hydrocarbon chains are present as gauche rotamers, prevalent in disordered hydrocarbon chains, or trans rotamers, more abundant in ordered hydrocarbon chains (fig. 1). Thus, lipid hydrocarbon chain order may be evaluated in terms of the amount of CH2trans rotamers. The frequency of the CH2 symmetric stretch, , is dependent on the amount of trans or gauche rotamers [23] and has been used to characterize lipid phase transitions [20,24,25,26,27,28,29,30,31] to measure the trans rotamer content of lipid hydrocarbon chains with changes in temperature [20,23,24,25,26]. Since rotamers are either trans or gauche, phase transition plots, versus temperature, can be described by a two-state sigmoidal equation shown below, as described by Borchman et al. [20].
| (1) |
The phase transition data were fit to equation 1 using the 4-parameter logistic curve fit in SigmaPlot software, version 10 (Richmond, Calif., USA). Lipid order at 33.4°C was calculated by extrapolating at 33.4°C from the fit of the phase transition and then converting to the percentage of trans rotamers, a measure of lipid conformational order [20], using equation 2.
| (2) |
To estimate the van't Hoff enthalpy of the phase transition, Arrhenius plots, i.e., ln (% trans rotamer) versus 1/T (T in kelvin) were constructed [24]. The slope of the linear region of the Arrhenius plot near the phase transition temperature was used to calculate the enthalpy of the phase transition. The change in entropy (randomness) of the phase transition was calculated by dividing the enthalpy by the phase transition temperature (ΔS = H/T, at equilibrium conditions, ΔG = 0, where H is the enthalpy and T is the phase transition temperature). Arrhenius plots from tear lipid phase transitions were linear with correlation coefficients greater than 0.998.
Statistics
Data are presented as mean ± standard error of the mean. Significance was determined using Student's t test or the correlation coefficient from the linear regression best fit. Values of p < 0.01 were considered statistically significant.
Results
Human Material
Twenty-seven human donors of meibum were recruited from the members and associates of Dr. Borchman's laboratory and patients of Dr. Foulks at the Kentucky Lions Eye Center and the Veterans Affairs Hospital, Louisville, Ky., USA. Ages of subjects ranged from 3 to 88 years and samples were assigned to three groups by age (table 1). There were 21 males and 8 females. The racial/ethnic distribution was 23 Caucasians, 3 Asians, and 1 African-American. None of the donors had ever experienced dry eye symptoms or blepharitis. Females with eye makeup were excluded.
Table 1.
Human meibum sample information
| Age/sex/ethnicity | |
|---|---|
| Group 1 | 3/M/C, 4/F/C, 6/M/C, 8/F/C, 10/M/C, 12/F/C, 13/F/C |
| Meibum below 14 years |
|
| Group 2 | 17/M/C, 19/M/C, 19/F/C, 20/F/A, 20/M/A, 21/M/C, 21/M/C, 23/M/C, 23/M/C, 24/M/C, 26/M/A, 32/M/C |
| Meibum 14–33 years |
|
| Group 3 | 52/F/C, 54/M/C, 62/M/C, 65/M/C, 67/M/C, 80/F/B, 83/M/C, 88/M/C |
| Meibum above 33 years |
The age is in years. M = Male; F = female; A = Asian; B = Black; C = Caucasian.
Lipid Phase Transitions and the Infrared CH Stretching Region
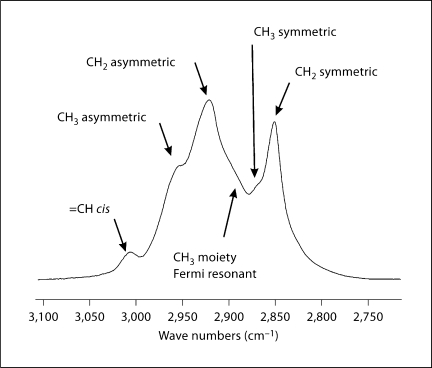
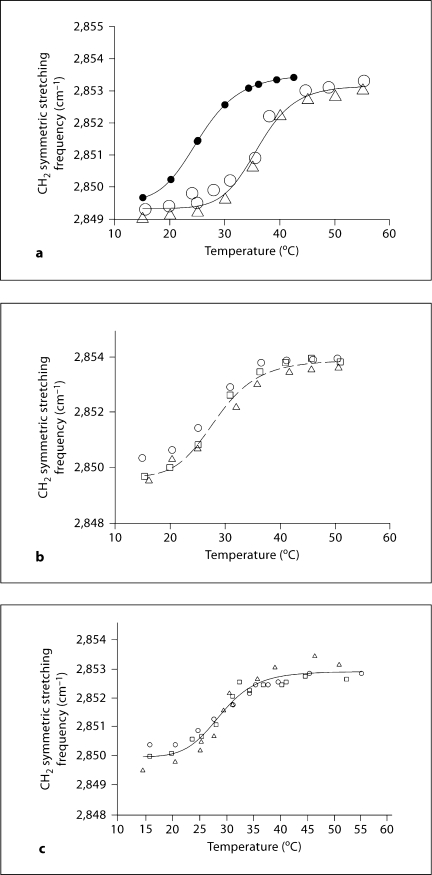
The CH stretching region of the infrared spectrum corresponding to meibum is shown in figure 2. The CH2 stretching bands are predominant in the infrared spectra of lipids due to the large number of CH2 groups in their hydrocarbon chains. The CH stretching region is composed of 6 major bands. In this study, we used near 2,850 cm−1 to estimate the trans to gauche rotamer content of the hydrocarbon chains (fig. 1). increases with the number of gauche rotamers concurrent with a decrease in intensity. A phase transition from the ordered (gel) phase, at lower temperatures, to the disordered (liquid crystalline) phase, at higher temperatures, is noticeable for meibum (fig. 3). The extreme age-related differences between meibum phase transitions are evident in the meibum phase transition of a 3-year-old male (fig. 3a, open symbols), compared with an 88-year-old male (fig. 3a, filled symbols). Repeatability of measurement was strong: the phase transitions for 3 meibum samples taken from a 23-year-old male at least 2 weeks apart were identical (fig. 3b). Likewise, the results for both a 3-year-old male (fig. 3a, right phase transition) and an 83-year-old male (fig. 3c) were closely repeatable when the phase transition for the same sample was measured 2–3 times, weeks apart. This degree of intrasample experimental reproducibility was documented for 2 human meibum samples in Borchman et al. [20] and many samples in this study (data not shown).
Fig. 2.
Typical infrared spectrum of the CH stretching region for human meibum composed of at least 6 bands. The CH2 symmetric stretching band frequency was used to calculate lipid hydrocarbon chain conformation.
Fig. 3.
a Phase transitions of meibum from a 3-year-old male (open symbols) and an 88-year-old male (filled symbols). The open triangles and circles represent phase transitions measured on the same sample weeks apart. Curves represent the extremes of the values measured. Other examples are seen in b and c. b Phase transitions of meibum lipid from a 21-year-old male. Different symbols represent phase transition measured on 3 different samples of the same person collected months apart. c Phase transition of an 83-year-old male. Different symbols represent 3 phase transitions measured on the same sample weeks apart. A lower value for the CH2 symmetric stretching frequency corresponds to higher hydrocarbon chain order or stiffness.
Meibum phase transitions were quantified by fitting them to a 4-parameter 2-state sigmoidal equation as described by Borchman et al. [20]. The 4 parameters fitted were: the minimum and maximum of of the phase transition corresponding to the most ordered state and disordered state, respectively; the transition temperature at which half of the lipid molecules have undergone a phase change, and the relative cooperativity. The broader the phase transition the smaller the absolute value for the cooperativity. Cooperativity describes how the order of a lipid influences that of neighboring lipids.
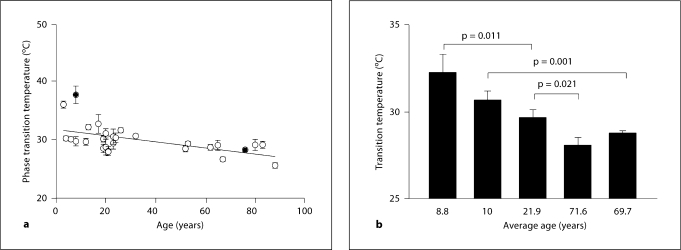
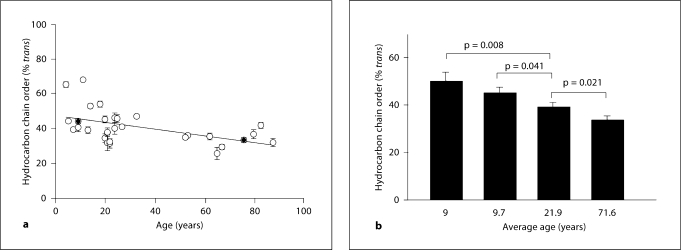
The phase transition parameters for the three age groups of human meibum are listed in table 2. Two of the phase transition parameters, the maximum frequency and cooperativity, did not change with age (p > 0.05; table 2). The minimum frequency was slightly but significantly lower in the younger age group compared to the two older age groups (p < 0.01; table 2). The ungrouped individual phase transition temperatures versus age (fig. 4a) could be fit with linear regression analysis by the line with a slope of −0.0456 and an intercept of 31.2 (r = 0.576, p < 0.005). The phase transition temperature decreased by 4°C from about 31°C at birth to about 27°C at 90 years of age.
Table 2.
Phase transition parameters
| Phase transition parameter | Meibum |
Age-related difference | ||
|---|---|---|---|---|
| below 14 years | 14–35 years | above 35 years | ||
| Age (mean ± SD), years | 8 ± 1 | 22 ± 4 | 67 ± 4 | |
| Minimum frequency, cm−1 | 2,849.37 ± 0.08 | 2,849.82 ± 0.08 | 2,849.9 ± 0.1 | below 14 years, p < 0.01 |
| Maximum frequency, cm−1 | 2,853.31 ± 0.31 | 2,853.4 ± 0.1 | 2,853.4 ± 0.1 | r = 0.115; p > 0.05 |
| Cooperativity | −9.4 ± 0.5 | −8.4 ± 0.6 | −9.0 ± 0.5 | r = 0.054; p > 0.05 |
| Phase transition temperature, °C | 31.3 ± 0.9 | 29.9 ± 0.4 | 28.2 ± 0.5 | r = 0.576; p > 0.005 |
| Enthalpy, kcal/mol | 154 ± 8 | 135 ± 10 | 146 ± 8 | r = 0.0597; p > 0.05 |
| Entropy, kcal/mol/degree | 0.51 ± 0.03 | 0.45 ± 0.03 | 0.48 ± 0.03 | r = 0.0411; p > 0.05 |
| Phase transition fit (r) | 0.999 | 0.997 | 0.997 | |
| Order at 33.4°C, % | 50 ± 4 | 40 ± 2 | 27 ± 2 | r = 0.501; p > 0.005 |
| Number of samples | 7 | 12 | 8 | |
Fig. 4.
Relationship between meibum phase transition temperature and age.
The small 4°C difference in the phase transition temperature has a profound influence on lipid order. Lipid order at 33.4°C was calculated by extrapolating at 33.4°C from the fit of the phase transition and then converting to the percentage of trans rotamers, a measure of 0.005 (table 2). The ungrouped individual lipid order data versus age (fig. 5a) could be fit with linear regression analysis by the line with a slope of −0.197 and an intercept of 47.7 (r = 0.501, p < 0.005). Meibum hydrocarbon chain order decreased from about 48% trans rotamers at birth to about 30% trans rotamers at 90 years old (fig. 5b). A small 2°C decrease in transition temperature resulted in a large and significant decrease in the lipid order from 44% at birth to 32% at 90 years old.
Fig. 5.
Relationship between meibum order at 33.4°C and age.
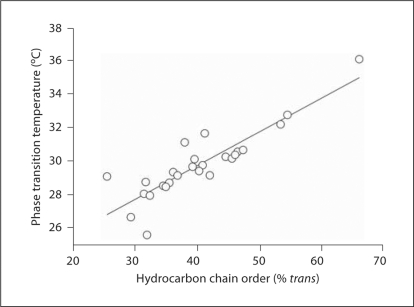
The values for meibum order and phase transition temperatures (fig. 6) were fit by linear regression analysis. The fitted line had a slope of 0.202 and an intercept of 21.6 (r = 0.879, p < 0.005).
Fig. 6.
Relationship between meibum phase transition temperature and order at 33.4°C.
The percent trans rotamer data were used to calculate the phase transition enthalpy and entropy from the slopes of Arrhenius plots as described in Borchman et al. [20]. The enthalpy, 143 ± 8 kcal/mol, and entropy, 0.47 ± 0.02 kcal/mol/degree, of the phase transitions did not change significantly with age (table 2).
Prior to measuring phase transition, infrared spectra of samples were measured outside of the temperature-controlled cell just after collection. Water was not present in our samples measured prior to phase transition measurements because only a small OH stretching band near 3,400 cm−1 was measured in 7 of our 29 samples and the intensity of the CH stretching band was only 0.01. The OH stretch may be due to lipid hydroxyl groups rather than water since the intensity of this band did not change after a phase transition. There was no correlation between lipid order and the OH band intensity.
Discussion
A major finding of this study is that meibum hydrocarbon chain order decreased from about 48% trans rotamers (52% gauche rotamers) at birth to about 30% trans rotamers at 85 years old indicating that meibum compositional changes occur with age. Because of the complexity and wide range of lipid classes associated with meibum [14], it is not possible at this time to assess, specifically, which lipid components or interactions lead to the observed thermodynamic and conformational differences found in this study. Meibum is composed of wax esters, di- and triglycerides, cholesterol esters and hydrocarbons [14]. The possible interactions among these lipids and their relationship to lipid hydrocarbon order deserve further investigation.
We studied phospholipid conformation-composition relationships with age in the human lens [24,25,26,27]. Lipid order in the human lens increases with age as a result of an overall increase in hydrocarbon chain saturation and mostly due to an increase in the relative amount of saturated sphingolipid [27]. Cholesterol has been shown to order disordered lipids and disorder ordered lipids [28]. Insight cannot be gained from these lens studies because sphingolipid and cholesterol are very minor components of human meibum composing less than a percent of the total lipid and meibum is composed of unusual lipids not found elsewhere in the human body [14].
Human meibum composition varies greatly from study to study in the literature [14]. The compositional variability has been attributed to the different analytical methodologies employed and the inherent variability of biological samples [14]. Interperson variability in lipid order is much greater than the experimental variability and intraperson variability of lipid order. We can infer from the low intraperson variability in our phase transition parameters that meibum compositional/conformational changes are negligible on a month-to-month basis. The higher interperson variability indicates that meibum compositional/conformational differences between age-matched individuals could be relatively higher.
What Causes Changes in Meibum Order and Phase Transition Temperature?
Because waxes are not present throughout the human body, composition-conformation relationships have not been studied as extensively as they were for phospholipid membranes [32]. In general, one might expect that hydrocarbon chain saturation and length would order the lipids and increase the phase transition temperature. How wax, diglycerides, hydrocarbons, and cholesterol esters interact with each other and the aqueous tear film could be the subject of many future studies.
Meibum phase transition temperature decreased by 4°C from about 31°C at birth to about 27°C at 90 years old. The phase transition temperature range is close to the surface temperature of the cornea which ranges from 26.4°C (ambient air temperature of −20°C) to 36.7°C (ambient air temperature of 40°C) [33]. The melting of meibum has been visually assessed to range from 19 to 39°C [34,35,36,37]. As the temperature increased from 25 to 45°C, a significant decrease in the refractive index has been reported for human meibum [38]. In line with these trends, we found that lipid hydrocarbon order decreased when the temperature was raised from 25 to 40°C (fig. 3), the same temperature range at which lipid delivery to the margins was observed to increase [39]. When lipid order decreases, van der Waal's interactions between lipids decrease and the meibum would become less viscous and spread more readily perhaps increasing delivery to the margins. In another study using a fluorescent probe, we showed that the motion of the hydrocarbon chain region increases with an increase in the hydrocarbon chain disorder. This enhanced motion could affect meibum delivery. Lipid hydrocarbon chain order measured in a separate study was related to meibum delivery [20] to the eyelid margin [39]. This raises the possibility that hydrocarbon chain order could contribute to the delivery of meibum from the meibomian glands to the lid margins. Lipid-protein and lipid-aqueous interactions may influence meibum structure and spreading on the surface of tears [40,41,42,43,44]. Assuming meibum finds its way to the aqueous tear film surface, if the lipid-lipid interactions are too strong, the lipid will aggregate and will not spread. Strong meibum lipid-lipid interactions have to be overcome by perhaps meibum-protein interactions to allow the meibum to spread on the tear film surface [40]. The current study forms the basis for future model studies to determine the roles of tear film moieties in influencing the structure and spreading of meibum.
A small change in enthalpy, 3 kcal/mol, would be enough to increase the phase transition temperature by 21°C. Phase transition enthalpy and entropy could not be statistically related to the small 3°C change in the transition temperature with age because the experimental variability of the phase transition enthalpy and entropy was too large. One would expect that the enthalpy would increase with age causing an increase in the phase transition temperature. Meibum order, however, was directly related to the meibum phase transition temperature (fig. 6) and because the phase transition temperatures were near physiological temperature, a small change in the phase transition temperature caused a large change in lipid order. Compositional changes or drugs that influence the phase transition temperature would be expected to change meibum order.
In conclusion, human meibum order and phase transition temperatures decrease with age and this trend may be attributed to lipid compositional changes. Compositional changes or drugs that influence the phase transition temperature would be expected to change meibum order. This study serves as a foundation to examine meibum conformational differences in meibum from people with meibomian gland dysfunction.
Acknowledgements
This study was supported by Public Health Service research grant EY017094-01 (Bethesda, Md., USA), the Kentucky Lions Eye Foundation, and an unrestricted grant from Research to Prevent Blindness Inc. Much of this material is the result of work supported with resources and use of the facilities at the Louisville Veterans Affairs Medical Center, Louisville, KY. Dr Foulks is a member of the part-time staff of the Surgical Service, Department of Veteran Affairs Medical Center, Louisville, KY.
References
- 1.Chew CK, Hykin PG, Jansweijer C, Dikstein S, Tiffany JM, Bron AJ. The casual level of meibomian lipids in humans. Curr Eye Res. 1993;12:255–259. doi: 10.3109/02713689308999471. [DOI] [PubMed] [Google Scholar]
- 2.Korb DR, Baron DF, Herman JP, Finnemore VM, Exford JM, Hermosa JL, Leahy CD, Glonek T, Greiner JV. Tear film lipid layer thickness as a function of blinking. Cornea. 1994;13:354–359. doi: 10.1097/00003226-199407000-00012. [DOI] [PubMed] [Google Scholar]
- 3.Creech JL, Do LT, Fatt I, Radke CJ. In vivo tear-film thickness determination and implications for tear-film stability. Curr Eye Res. 1998;17:1058–1066. doi: 10.1076/ceyr.17.11.1058.5233. [DOI] [PubMed] [Google Scholar]
- 4.King-Smith PE, Fink BA, Hill RM, Koelling KW, Tiffany JM. The thickness of the tear film. Curr Eye Res. 2005;29:357–368. doi: 10.1080/02713680490516099. [DOI] [PubMed] [Google Scholar]
- 5.Radke CJ. Comments on ‘The thickness of the tear film’. Curr Eye Res. 2005;30:1131–1132. doi: 10.1080/02713680500445815. [DOI] [PubMed] [Google Scholar]
- 6.McDonald JE. Surface phenomena of tear films. Trans Am Ophthalmol Soc. 1968;66:905–939. [PMC free article] [PubMed] [Google Scholar]
- 7.Haberich FJ. Der präkorneale Tränenfilm (PKTF) Dtsch Opt Ztg. 1981:24–33. [Google Scholar]
- 8.Van Haeringen NJ. Clinical biochemistry of tears. Surv Ophthalmol. 1981;26:84–96. doi: 10.1016/0039-6257(81)90145-4. [DOI] [PubMed] [Google Scholar]
- 9.Wolff E. Muco-cutaneous function of the lid margin and the distribution of the tear fluid. Trans Ophthalmol Soc UK. 1946;66:291–308. [Google Scholar]
- 10.Craig JP, Blades K, Patel S. Tear lipid layer structure and stability following expression of the meibomian glands. Ophthalmic Physiol Optics. 1995;15:569–574. [PubMed] [Google Scholar]
- 11.Craig JP, Tomlinson A. Importance of the lipid layer in human tear film stability and evaporation. Optom Vis Sci. 1997;74:8–13. doi: 10.1097/00006324-199701000-00014. [DOI] [PubMed] [Google Scholar]
- 12.Mathers WD, Lane JA, Sutphin JE, et al. Model for ocular tear film function. Cornea. 1996;15:110–119. doi: 10.1097/00003226-199603000-00002. [DOI] [PubMed] [Google Scholar]
- 13.Mathers W. Evaporation from the ocular surface. Exp Eye Res. 2004;78:389–394. doi: 10.1016/s0014-4835(03)00199-4. [DOI] [PubMed] [Google Scholar]
- 14.Butovich IA, Millar TJ, Ham BM. Understanding and analyzing meibomian lipids – A review. Curr Eye Res. 2008;33:405–420. doi: 10.1080/02713680802018419. [DOI] [PMC free article] [PubMed] [Google Scholar]
- 15.Mathers WD, Lane JA. Meibomian gland lipid, evaporation, and tear film stability. In: Sullivan DA, Dartt DA, Meneray MA, editors. Lacrimal Gland, Tear Film, and Dry Eye Syndromes 2. New York: Plenum Press; 1998. pp. 349–360. [DOI] [PubMed] [Google Scholar]
- 16.Craig JP, Tomlinson A. Age and gender effects on the tear film. In: Sullivan DA, Dartt DA, Meneray MA, editors. Lacrimal Gland, Tear Film, and Dry Eye Syndromes 2. New York: Plenum Press; 1998. pp. 411–415. [Google Scholar]
- 17.Rolando M, Refojo MF. Tear evaporimeter for measuring water evaporation from the tear film under controlled conditions in humans. Exp Eye Res. 1983;36:25–33. doi: 10.1016/0014-4835(83)90086-6. [DOI] [PubMed] [Google Scholar]
- 18.Tomlinson A, Giesbrecht C. The ageing tear film. Br J Contact Lens Assoc. 1993;16:67–69. [Google Scholar]
- 19.Nicolaides N, Santos EC. The di- and tri-esters of the lipids of steer and human meibomian glands. Lipids. 1985;20:454–467. doi: 10.1007/BF02534237. [DOI] [PubMed] [Google Scholar]
- 20.Borchman D, Foulks GN, Yappert MC, Ho DV. Temperature-induced conformational changes in human tear lipids hydrocarbon chains. Biopolymers. 2007;87:124–133. doi: 10.1002/bip.20798. [DOI] [PubMed] [Google Scholar]
- 21.Borchman D, Foulks GN, Yappert MC, Tang D, Ho DV. Spectroscopic evaluation of human tear lipids. Chem Phys Lipids. 2007;147:87–102. doi: 10.1016/j.chemphyslip.2007.04.001. [DOI] [PubMed] [Google Scholar]
- 22.Kilp H, Schmid E, Kirchner L, Pohl A. Tear film observation by reflecting microscopy and differential interference contrast microscopy. In: Holly FJ, editor. The Preocular Tear Film in Health, Disease and Contact Lens Wear. Lubbock: The Dry Eye Institute; 1986. pp. 564–569. [Google Scholar]
- 23.Kóta Z, Debreczeny M, Szalontai B. Separable contributions of ordered and disordered lipid fatty acyl chain segments to νCH2 bands in model and biological membranes: a Fourier transform infrared spectroscopic study. Biospectroscopy. 1999;5:169–178. doi: 10.1002/(SICI)1520-6343(1999)5:3<169::AID-BSPY6>3.0.CO;2-#. [DOI] [PubMed] [Google Scholar]
- 24.Borchman D, Yappert MC, Herrell P. Structural characterization of human lens membrane lipid by infrared spectroscopy. Invest Ophthalmol Vis Sci. 1991;32:2404–2416. [PubMed] [Google Scholar]
- 25.Borchman D, Tang D, Yappert MC. Lipid composition, membrane structure relationships in lens and muscle sarcoplasmic reticulum membranes Biospectroscopy. 1999;5:151–167. doi: 10.1002/(SICI)1520-6343(1999)5:3<151::AID-BSPY5>3.0.CO;2-D. [DOI] [PubMed] [Google Scholar]
- 26.Borchman D, Yappert MC, Afzal M. Lens lipids and maximum lifespan. Exp Eye Res. 2004;79:761–768. doi: 10.1016/j.exer.2004.04.004. [DOI] [PubMed] [Google Scholar]
- 27.Borchman D, Cenedella RI, Lamba OP. Role of cholesterol in the structural order of lens membrane lipids. Exp Eye Res. 1996;62:191–197. doi: 10.1006/exer.1996.0023. [DOI] [PubMed] [Google Scholar]
- 28.Moore DJ, Wyrwa M, Reboulleau CP, Mendelsohn R. Quantitative IR studies of acyl chain conformational order in fatty acid homogeneous membranes of live cells of Acholeplasma laidlawii B. Biochemistry. 1993;32:6281–6287. doi: 10.1021/bi00075a023. [DOI] [PubMed] [Google Scholar]
- 29.Popova AV, Hincha DK. Intermolecular interactions in dry and rehydrated pure and mixed bilayers of phosphatidylcholine and digalactosyldiacylglycerol: a Fourier transform infrared spectroscopy study. Biophys J. 2003;85:1682–1690. doi: 10.1016/S0006-3495(03)74598-6. [DOI] [PMC free article] [PubMed] [Google Scholar]
- 30.Casal HL, Mantsch HH. Polymorphic phase behaviour of phospholipid membranes studied by infrared spectroscopy. Biochim Biophys Acta. 1984;779:381–401. doi: 10.1016/0304-4157(84)90017-0. [DOI] [PubMed] [Google Scholar]
- 31.Mantsch HH, McElhaney RN. Phospholipid phase transitions in model and biological membranes as studied by infrared spectroscopy. Chem Phys Lipids. 1991;57:213–226. doi: 10.1016/0009-3084(91)90077-o. [DOI] [PubMed] [Google Scholar]
- 32.Mendelsohn R, Moore DJ. Vibrational spectroscopic studies of lipid domains in biomembranes and model systems. Chem Phys Lipids. 1998;96:141–157. doi: 10.1016/s0009-3084(98)00085-1. [DOI] [PubMed] [Google Scholar]
- 33.Geiser MH, Bonvin M, Quibel O. Corneal and retinal temperatures under various ambient conditions: a model and experimental approach. Klin Monatsbl Augenheilkd. 2004;221:311–314. doi: 10.1055/s-2004-812878. [DOI] [PubMed] [Google Scholar]
- 34.Brown SI, Dervichian DG. The oils of the meibomian glands. Physical and surface characteristics. Arch Ophthalmol. 1969;82:537–540. doi: 10.1001/archopht.1969.00990020539019. [DOI] [PubMed] [Google Scholar]
- 35.Linton RG, Curnow DH, Riley WJ. The meibomian glands: an investigation into the secretion and some aspects of the physiology. Br J Ophthalmol. 1961;45:718–723. doi: 10.1136/bjo.45.11.718. [DOI] [PMC free article] [PubMed] [Google Scholar]
- 36.Terada O, Chiba K, Senoo T, Obara Y. Ocular surface temperature of meibomian gland dysfunction patients and the melting point of meibomian gland secretions. Nippon Ganka Gakkai Zasshi. 2004;108:690–693. [PubMed] [Google Scholar]
- 37.Ong BL, Larke JR. Meibomian gland dysfunction: some clinical, biochemical and physical observations. Ophthalmic Physiol Opt. 1990;10:144–148. doi: 10.1111/j.1475-1313.1990.tb00968.x. [DOI] [PubMed] [Google Scholar]
- 38.Tiffany JM. Refractive index of meibomian and other lipids. Curr Eye Res. 1986;5:887–889. doi: 10.3109/02713688609029242. [DOI] [PubMed] [Google Scholar]
- 39.Nagymihalyi A, Dikstein S, Tiffany JM. The influence of eyelid temperature on the delivery of meibomian oil. Exp Eye Res. 2004;78:367–370. doi: 10.1016/s0014-4835(03)00197-0. [DOI] [PubMed] [Google Scholar]
- 40.Holly FJ. Formation and rupture of the tear film. Exp Eye Res. 1973;15:515–525. doi: 10.1016/0014-4835(73)90064-x. [DOI] [PubMed] [Google Scholar]
- 41.Glasgow BJ, Abduragimov AR, Farahbakhsh ZT, Faull KF, Hubbell WL. Tear lipocalins bind a broad array of lipid ligands. Curr Eye Res. 1995;14:363–372. doi: 10.3109/02713689508999934. [DOI] [PubMed] [Google Scholar]
- 42.Gasymov OK, Abduragimov AR, Yusifov TN, Glasgow BJ. Binding studies of tear lipocalin: the role of the conserved tryptophan in maintaining structure, stability and ligand affinity. Biochim Biophys Acta. 1999;1433:307–320. doi: 10.1016/s0167-4838(99)00133-8. [DOI] [PubMed] [Google Scholar]
- 43.Nagyova B, Tiffany JM. Components responsible for the surface tension of human tears. Curr Eye Res. 1999;19:4–11. doi: 10.1076/ceyr.19.1.4.5341. [DOI] [PubMed] [Google Scholar]
- 44.Millar TJ, Mudgil P, Butovich IA, Palaniappan CK. Adsorption of human tear lipocalin to human meibomian lipid films. Invest Ophthalmol Vis Sci. 2009;50:140–151. doi: 10.1167/iovs.08-2097. [DOI] [PMC free article] [PubMed] [Google Scholar]


