Abstract
Human T-cell leukemia virus type 1 (HTLV-1) is a retrovirus associated with several serious diseases, such as adult T-cell leukemia and tropical spastic paraparesis/myelopathy. For a number of years, the protease (PR) encoded by HTLV-1 has been a target for designing antiviral drugs, but that effort was hampered by limited available structural information. We report here a high resolution crystal structure of HTLV-1 PR complexed with a statine-containing inhibitor, a significant improvement over the previously available moderate resolution structure. We also report crystal structures of the complexes of HTLV-1 PR with five different inhibitors that are more compact and more potent. A detailed structure-activity relationship study was performed to interpret in detail the influence of the polar and hydrophobic interactions between the inhibitors and the protease.
Introduction
Human T-cell leukemia virus type 1 (HTLV-1) is a retrovirus associated with several serious human diseases, such as mature CD3+ CD4+ T-cell type leukemia/lymphoma (ATL) and tropical spastic paraparesis/myelopathy1,2. At this time, there are no approved therapeutic agents targeting HTLV-1, although a number of approaches, including combination of interferon-α and zidovudine (AZT)3, proteasome inhibitors4, and Tax-targeted immunotherapy5 are under investigation. In view of the rapid and successful introduction of about a dozen drugs targeting the closely related HIV-1 protease (PR)6, the homologous HTLV-1 PR provides an obvious drug design target7,8, especially since inhibition of this enzyme has already been shown to prevent viral proliferation9.
HTLV-1 PR is a homodimer, with each chain containing 125 residues; its enzymatic properties, including substrate specificity, have been studied in considerable detail10,11. However, unlike HIV-1 PR for which hundreds of crystal structures have been solved12, only a single, medium-resolution (2.6 Å) structure of HTLV-1 PR has been reported to date13. This paucity of structural information creates a barrier to successful application of rational drug design to this target.
Although the design and synthesis of inhibitors specific for HTLV-1 PR have been carried out in the past, most of the compounds have only been found to be active in micromolar concentration14,15. A statine-containing inhibitor has been characterized with a Ki of 50 nM under high-salt conditions10, but only 2.3 μM in a low-salt buffer16. By comparison, a number of subpicomolar inhibitors of HIV-1 PR have been developed using the principles of rational drug design17. Most recently, inhibition properties of a series of HTLV-1 inhibitors that contain allophenylnorstatine [(2S,3S)-3-amino-2-hydroxy-4-phenylbutyric acid, Apns] isostere derived from a scissile amino acid sequence Leu-Pro found in an efficiently processed enzyme substrate have been characterized in detail and a qualitative structure-activity relationship (QSAR) equation has been derived18. However, that study lacked direct structural confirmation of the mode of binding of that series of inhibitors to the target enzyme.
The purpose of the work described here was two-fold. First, we aimed to obtain high-resolution structure of HTLV-1 PR that would be more reliable than the 2.6 Å-resolution structure described previously13. For that purpose, we expressed the previously used L40I mutant of HTLV-1 PR in a different bacterial strain, improved the purification procedures, and searched for new crystallization conditions. Second, in order to provide structural underpinnings to the rational synthesis of the inhibitors of HTLV-1 PR and to explain the QSAR results18, we cocrystallized the enzyme with a number of inhibitors that were previously characterized and analyzed in detail the structures of several such complexes.
Results and Discussion
Crystals of the inhibitor complexes
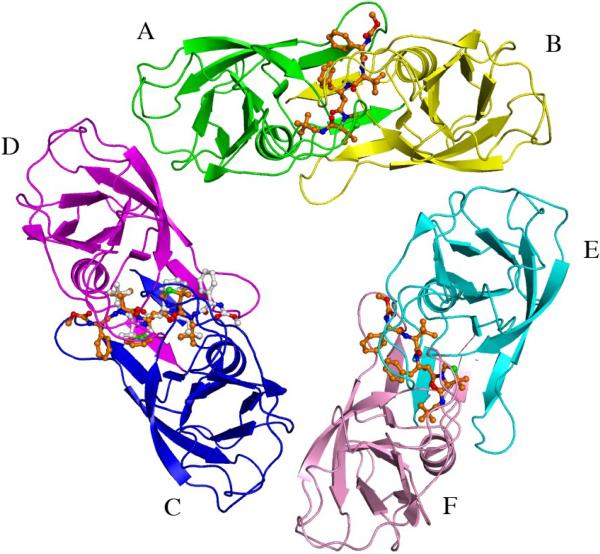
The inhibitors used in this study for cocrystallization with HTLV-1 PR included the statine-based inhibitor studied previously13,19, as well as a number of inhibitors that were specifically designed to inhibit this enzyme18,20,21. Although some of the inhibitor complexes did not crystallize, others did, yielding several different crystal forms (Table 1). Whereas the crystals exhibit either monoclinic or triclinic symmetry, all their lattices contain trimers of the dimeric molecules (Fig. 1). One such trimer occupies an asymmetric unit in the crystals of the statine-containing inhibitor; its packing into the monoclinic lattice that exhibits extensive pseudosymmetry has been discussed in detail before19. Two analogous trimers are present in the asymmetric unit of crystals of the complex with inhibitor KNI-10562, whereas the hexagonal crystals of the remaining inhibitor complexes contain only a dimer in the asymmetric unit. However, a virtually identical trimer is created in the latter case by application of the symmetry of the space group. Intermolecular contacts within a trimer involve residues 20–21, 48–50, 71–72, and 88 of molecule A (and, in the monoclinic crystals of the statine complex, C and E), interacting with residues 23–28, 43–46, and 94–96 of the symmetry mate of molecule B (also molecules D and F in the monoclinic crystals). In all crystals the trimers form flat layers, preserving most inter-layer interactions. Thus, despite the differences in the crystal symmetry, intermolecular interactions are generally similar in all the structures described here.
Table 1. Data collection and refinement statistics.
| Statine-containing | KNI-10562 | KNI-10673 | KNI-10681 | KNI-10683 | KNI-10729 | |
|---|---|---|---|---|---|---|
| Data collection | ||||||
| Space group | C2 | C2 | P6322 | P6322 | P6322 | P6322 |
| Molecules/a.u. | ||||||
| Unit cell a, b, c (Å); β (°) (C2) | 133.7, 77.4, 80.2; 99.7 | 134.4, 77.3, 159.2; 95.1 | 77.9, 77.9, 163.2 | 78.3, 78.3, 163.3 | 77.8, 77.8, 163.0 | 77.4, 77.4 159.3 |
| Resolution (Å)* | 50.0–1.86 (1.96–1.86) | 50.0–1.96 (2.03–1.96) | 50.0–2.30 (2.38–2.30) | 50.0–2.20 (2.28–2.20) | 50.0–2.60 (2.69–2.60) | 50.0–2.70 (2.80–2.70) |
| R merge † | 5.3 (44.9) | 8.7 (30.5) | 9.3 (22.1) | 13.0 (24.0) | 7.8 (21.9) | 10.1 (28.0) |
| No. of reflections (measured/unique) | 246,227/66,670 | 348,369/112,737 | 130,396/13,688 | 89,286/15,113 | 74,464/9072 | 39,618/7455 |
| <I / σI> | 22.1 (2.5) | 24.9 (3.1) | 21.9 (4.6) | 15.5 (2.7) | 25.4 (4.9) | 14.6 (2.7) |
| Completeness (%) | 98.5 (89.1) | 97.1 (79.3) | 99.1 (92.3) | 94.5 (64.7) | 94.0 (58.3) | 89.4 (59.4) |
| Redundancy | 3.7(3.1) | 3.1 (2.4) | 9.5 (3.9) | 5.9 (1.9) | 8.2 (2.1) | 5.3 (2.5) |
| Refinement | ||||||
| Resolution (Å) | 50.00–1.86 | 50.00–1.96 | 50.00–2.30 | 50,00–2.20 | 50.00–2.60 | 50.00–2.70 |
| No. of reflections (refinement/ Rfree) | 64,618/2021 | 109,343/3393 | 13,232/428 | 14,615/467 | 8782/268 | 7237/214 |
| R / Rfree‡ | 0.187/0.223 | 0.215/0.267 | 0.188/0.234 | 0.202/0.262 | 0.201/0.262 | 0.206/0.281 |
| No. atoms | ||||||
| Protein | 5279 | 10558 | 1766 | 1766 | 1766 | 1766 |
| Ligand/ion | 213 | 300 | 44 | 46 | 47 | 57 |
| Water | 281 | 799 | 83 | 66 | 78 | 55 |
| R.m.s. deviations from ideal | ||||||
| Bond lengths (Å) | 0.011 | 0.018 | 0.014 | 0.015 | 0.013 | 0.011 |
| Bond angles (°) | 1.356 | 1.920 | 1.605 | 1.651 | 1.694 | 1.548 |
| PDB code | 3LIY | 3LIN | 3LIQ | 3LIT | 3LIV | 3LIX |
The highest resolution shell is shown in parentheses.
Rmerge = ΣhΣi|Ii−〈I〉|/ΣhΣiIi, where Ii is the observed intensity of the i-th measurement of reflection h, and 〈I〉 is the average intensity of that reflection obtained from multiple observations.
R = Σ||Fo|−|Fc||/Σ|Fo|, where Fo and Fc are the observed and calculated structure factors, respectively, calculated for all data. Rfree was defined in ref.33.
Figure 1.
One of the two trimers in the asymmetric unit of HTLV-1 PR in complex with inhibitor KNI-10562. The trimer consists of three homodimers, with each monomer colored separately. The AB dimer is colored green and yellow the CD dimer, blue and magenta and the EF dimer, cyan and pink, respectively. The inhibitor molecules are shown in ball-and-stick representation and are colored orange for their principal orientation, whereas the alternative conformation of the inhibitor in the CD dimer is gray. The stands representing the β-hairpin called the flap are omitted, in order to visualize the inhibitors more clearly. Oxygen, nitrogen, and sulfur atoms are colored red, blue, and green, respectively.
All inhibitors used in this study are peptidic, although they contain several non-natural amino acid residues. To simplify description of the inhibitors, the terms “N terminus” and “C terminus” are used to identify the chain direction, although other capping terminal groups are sometimes present. This nomenclature also determines the identity of the unprimed and primed side chains of the inhibitors (defining, for example, the Apns group as P1), although this class of inhibitors was shown to bind in an opposite direction to plasmepsins, in which the two domains can be distinguished by their amino acid sequence22. Such a distinction is, however, irrelevant in the case of fully symmetric enzymes, such as HTLV-1 PR.
High-resolution structure of the statine-containing inhibitor complex
The crystals of a complex of HTLV-1 PR with the statine-containing inhibitor are almost isomorphous with the previously described crystals (PDB code 2B7F) that diffracted only to medium 2.6-Å resolution13. The changes in the unit cell parameters amount to less than 0.5%, yet the quality of diffraction was much superior. The reasons for the improved diffraction properties of the crystals are not completely clear, but may be related to the improvement in the methods of expression and purification that resulted in higher purity of the enzyme. Diffraction data were now collected to 1.86-Å resolution on the same synchrotron beamline (APS 22-ID) that was used previously13,19. The crystals belong to the monoclinic space group C2 with three protease dimers in the asymmetric unit. The three dimers are related by a non-crystallographic three-fold axis, parallel to the c* axis of the unit cell. Superposition with the program SSM23 of the coordinates of the dimer AB of the new structure onto the corresponding coordinates in the medium-resolution structure13 results in root mean square (rms) deviation of 0.24 Å for all 232 Cα coordinate pairs, whereas simultaneous superposition of all three dimers yields rms deviation of 0.41 Å for 696 Cα pairs. Deviations exceeding 1 Å are seen in only a handful of places, including residues 46 and 49–50 of molecule C, and 46–49, 60–62, 64, and 96–98 of molecule D. As indicated by their higher than average temperature factors, these residues are located in flexible regions of the structure and their positional shifts may simply reflect better accuracy inherent in the high-resolution structure, especially for the CD dimer, in which the two orientations of the inhibitor were reported even in the lower-resolution structure. Reinterpretation of the chain tracing near Trp98 of molecule D resulted in a significant shift in the position of the side chain of this residue that directly affects its interaction with the flap residue Ala59 of molecule C. Superposition of the dimer CD on AB results in rms deviation of 0.44 Å, whereas the dimer EF superimposes on AB with rms deviation of 0.31 Å. The larger deviation of the dimer CD is due mainly to the different path of the main chain of residues 96–98 of chain D, compared to its counterparts in the other two dimers (or, indeed, in molecules A, C, and E).
The changes in the orientation of the side chains in the medium- and high-resolution structures are also minor, although a few of them (for example LeuA57, SerA89, IleA101, ThrB19, GluB28, and ArgB77) were now modeled with double conformations. In the previously determined structure, the inhibitor was interpreted as binding in a unique orientation in dimers AB and EF, but was two-fold disordered in the dimer CD. In the new high-resolution structure the inhibitor molecules were modeled as fully ordered in a unique conformation in the dimer AB, were interpreted as two-fold disordered (with similar occupancy) in dimer CD, but 70%/30% occupancy was also assigned to the inhibitor molecules in the dimer EF. The direction of the inhibitor with higher occupancy was the same as in the dimer AB, with its C terminus pointing into the center of the trimer. The coordinates of the inhibitor molecules were also very similar, with significant deviations limited to the two C-terminal residues only, due to the 180° flip of the peptide bond between His9 and Pro10.
Improved resolution of the diffraction data allowed assignment of a much larger number of solvent molecules, modeled as water oxygens (281 rather than the previous 172). Additionally, three extended electron density peaks in the solvent region were interpreted as polyethylene glycol molecules derived from the crystallization media. All in all, extension of resolution of diffraction data that almost tripled the number of observed intensities has not led to significant reinterpretation of the original structure.
Structure of the KNI-10562 inhibitor complex
Crystals of the complex with KNI-10562 are different from those of the other complexes discussed here, reflecting a difference in the conditions under which they were grown. Although the space group, monoclinic C2, is the same as for the statine complex, the unit cell parameters c and β are significantly different. However, as mentioned above, the two trimers present in an asymmetric unit of this crystal form are very similar to the sole trimer present in the crystals of the statine-containing inhibitor complex.
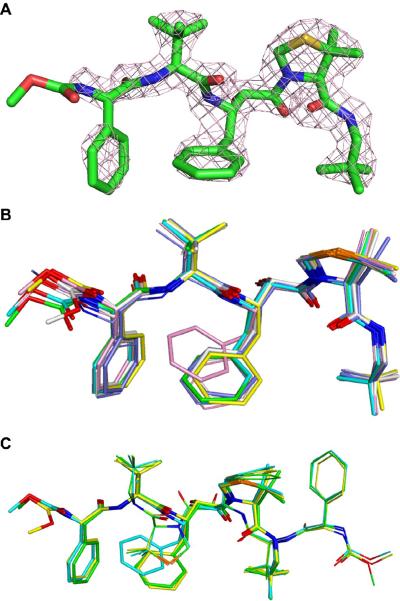
The presence of six independent enzyme dimers in an asymmetric unit, coupled with good quality of the electron density maps for this better than 2-Å resolution structure (Fig. 2A), provides a unique opportunity for analyzing the extent of crystal-related conformational variability of the inhibitor molecules. Such an analysis is of particular importance in this study of a series of inhibitors with very similar chemical structures. The inhibitors are well ordered in a single orientation in three of the complexes (AB, EF, and KL), whereas two orientations with similar occupancy are present in molecules CD, IJ, and GH. Dimers CD and IJ differ from the remaining four in making crystal contacts principally with their own symmetry mates, rather than with other molecules (a situation also seen in the crystals of the statine-containing inhibitor complex). However, whereas the orientation of the inhibitor with full or higher occupancy in molecules AB and EF of the statine inhibitor complex was the same, the well-ordered inhibitor molecules in the KNI-10562 complex point in two opposite directions, and are thus not related by the non-crystallographic 3-fold axis.
Figure 2.
The structure of inhibitor KNI-10562. A) A difference omit map of inhibitor KNI-10562 in dimer AB contoured at 3σ. Oxygen, nitrogen and sulfur atoms are colored in red, blue and yellow, respectively. B) Superposition of the KNI-10562 inhibitor bound to six crystallographically independent protease dimers, all oriented in the same way. Inhibitors bound to dimers AB (green), EF (yellow), and KL (cyan) are all in a single conformation and are shown in thick stick models. Inhibitors bound to dimer CD (slate), GH (gray) and IJ (pink) with alternative orientation are shown in thin stick models. C) Alternative conformation of the inhibitor bound in the CD, GH and IJ dimer. Inhibitors bound to dimer CD (green), GH (yellow) and IJ (cyan) are shown in thick and thin stick models for the principal and alternative orientations, respectively.
Superposition of the protein dimers results in rms deviations of 0.3–0.4 Å, indicating the lack of major rearrangements that could be ascribed to the influence of crystal contacts. However, although superposition of the inhibitor molecules resulted in the rms deviations of ~0.28 Å, the maximum deviation between individual atoms in the inhibitor molecules was as large as 3.6 Å for the terminal methyl groups of the KNI-10562 methyl carbamate cap at the N terminus, although the maximum deviation for the corresponding oxygen atoms was only 1.6 Å (Fig. 2B). Whereas oxygen OA1 forms hydrogen bonds with the main chain amide of Leu57, the other two atoms of the group are not making any clear contacts with the protein, whether hydrophobic or polar, and thus some spread in their positions is not surprising. These large deviations imply that functions beyond the N terminal amide may not greatly contribute to the inhibitory activity. The situation is quite different at the C-terminal end of the molecules, with the torsion angles for the t-pentyl group being virtually the same, resulting in the deviations between the corresponding atoms of less than 0.3 Å. That group is involved in a significant number of hydrophobic interactions with the side chains of several alanine, valine, leucine, and phenylalanine residues, and these interactions prevent any significant movements of the C terminus of the inhibitor. It must also be stressed that whereas the electron density for all inhibitors, even the disordered ones, is excellent at the C termini, the density at the N termini is much weaker, and this may be another reason for the local variation between the nine sets of coordinates shown in Fig. 2B. The only side chain of the inhibitor that shows some variation between the structures is the P1 phenyl group of the Apns. This residue makes hydrophobic contacts with Trp98 of the enzyme, with the latter side chain also exhibiting some variability due to variation in the Cα-Cβ torsion angles. Interestingly, Trp98 of the other molecule forming the protein dimer also assumes a range of conformations, although they do not seem to influence the adjacent (R)-5,5-dimethyl-1,3-thiazolidine-4-carboxylate (Dmt) group of the inhibitor, which is virtually identical in all structures. These observations suggest that Trp98 from the enzyme S1 pocket exhibits a somewhat strained hydrophobic interaction with the large P1 phenyl group from the inhibitor.
An observation that some well-ordered inhibitor molecules in the KNI-10562 complex are oriented in two opposite directions highlights the highly symmetric nature of the HTLV-1 PR homodimers (Fig. 1). Superposition of the inhibitor molecules with opposite orientations reveals much about the symmetrical nature of the S1/S1', S2/S2' and S3/S3' pockets (Fig. 2C). The critical hydrogen bond network formed by P1 Apns' hydroxymethylcarbonyl is symmetrically reflected around the core Asp32 and Asp32' of the dimer. The bulky P1 phenyl ring of Apns and P1' thiazolidine ring are ring-stacked in the S1/S1' pockets. The P2 and P1' carbonyls that form an important water-mediated hydrogen network with the Ala59/59' flap of the protease share the same space. The bulky t-butyl components of P2 t-leucine and P1'-cap t-pentyl both proximally occupy the S2/S2' pockets. From the P2 amide nitrogen to the P3-capping moiety, hydrogen bond interactions and occupancy of the S3/S3' pockets are alike regardless of inhibitor direction. These observations provide the foundation for new pseudo-symmetrical and symmetrical inhibitor designs that we are currently evaluating.
Structures of the KNI-10673, -10681, -10683 and -10729 inhibitor complexes
The crystals of the complexes of HTLV-1 PR with KNI-10673, -10681, -10683, and -10729 are different from those of the complexes with the statine inhibitor or with KNI-10562. All of these complexes crystallized in hexagonal space group P6322 with a single protease dimer in the asymmetric unit. It was initially not clear whether the assignment of the space group was correct, or if it resulted from the presence of quasi-merohedral twinning of the diffraction pattern, as is frequently the case for hexagonal crystals of HIV-1 PR24. Due to the presence of quasi-symmetry, such twinning cannot be determined from the distribution of diffraction intensities25. However, the assumption of the presence of lower-symmetry space group accompanied by twinning did not improve the refinement, and thus these four structures were refined in the high-symmetry space group.
With only a few exceptions, the protein coordinates in the four complexes are the same within the limits of the accuracy imposed by the resolution of diffraction data. When compared to KNI-10681, taken as a reference due to its resolution being the highest, the other structures exhibit rms deviations of 0.143 Å (KNI-10673), 0.285 Å (KNI-10683), and 0.478 Å (KNI-10729). These deviations are correlated with the resolution of the structures, leading to the conclusion that the presence of different inhibitors did not lead to significant changes in protein structure. The sole exception is the loop 96–98 of molecule A in KNI-10729, which adopts an alternative conformation. The relatively poor electron density in this region is indicative of a possibility of partial disorder, but forcing the coordinates to be more similar to their counterparts in other complexes resulted in very significant residual density that was in disagreement with such map interpretation. Similar variability in the Trp98 region was also observed in the aforementioned KNI-10562.
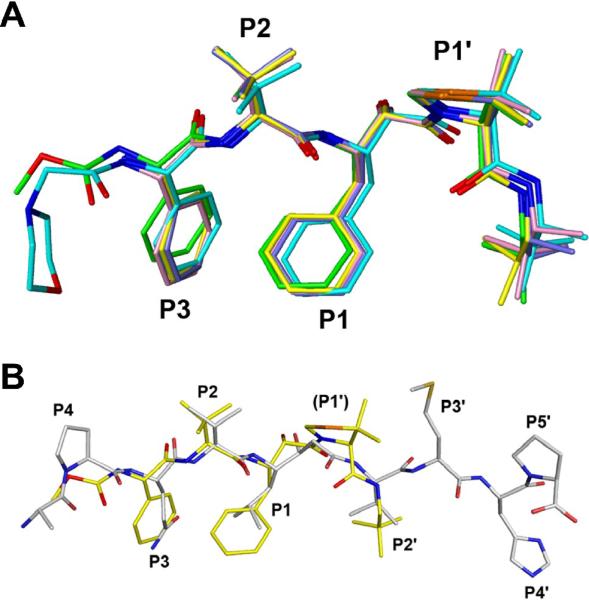
All four inhibitors are oriented in an identical manner in respect to the crystal axes, with their N termini pointing into the centers of the trimers. Since these trimers are created by crystallographic symmetry, the direction of the inhibitors is, by necessity, identical for each dimeric molecule that forms the trimers. Superposition of the four inhibitors from the hexagonal crystals, as well as the inhibitor molecule M complexed with the AB dimer of KNI-10562, is shown in Fig. 3A. The conformation of all five inhibitors is virtually identical, with the differences seen only at the termini, where their chemical structures differ. Two inhibitors with longer N termini, KNI-10562 and KNI-10729, make one more hydrogen bond (with the main chain amide of LeuB57) than the other three, thereby contributing to better inhibition of HTLV-1 PR. All inhibitors make hydrogen bonds through a preceding amide group (terminal in shorter inhibitors) and the side chain of AspB36. The capping groups on the C termini of the inhibitors are all hydrophobic and, despite their remarkably well preserved orientation, are engaged in only loose hydrophobic contacts with the protein. One significant exception is the (R)-methyl group on the C terminal α-carbon present in KNI-10681, -10683, and -10729, but absent in -10562 and -10673. This group is found ~3.5 Å from the Cγ1 methyl group of ValA56 in KNI-10683 and -10729, but only ~3 Å from the corresponding group in the KNI-10681 complex. It is possible that the latter close contact might be responsible for the lower percent inhibition of the latter compound compared with the other two. While the t-butyl β-carbon groups of KNI-10562, -10683 and -10729 are almost superimposable, the i-propyl β-carbon groups of KNI-10673 and -10681 are rotated by 60° in respect to each other. This observation, along with inhibitory data, suggest that the t-butyl β-carbon group provides a better fit in the enzyme pocket than the i-propyl β-carbon group.
Figure 3.
Superposition of the structures of the inhibitors from the KNI series and their comparison with the statine-based inhibitor. A) Superposition of the inhibitors. KNI-10562 is green, KNI-10673 yellow, KNI-10681 slate, KNI-10683 pink, and KNI-10729 pink. B) Superposition of the KNI-10562 inhibitor with the statine-based inhibitor. KNI-10562 is yellow and the statine inhibitor is gray.
Comparison of the inhibitors and their interactions with the enzyme
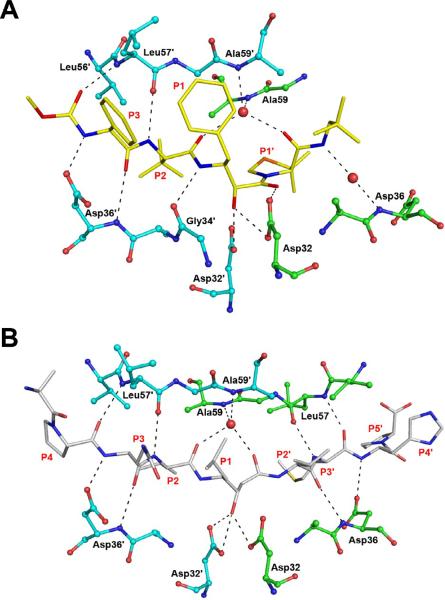
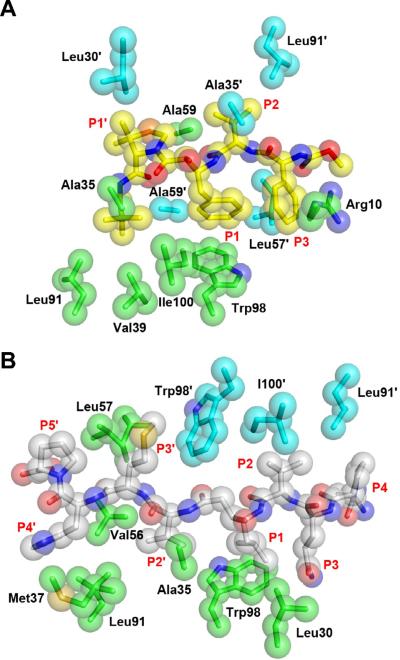
The inhibitors of the KNI series, although much shorter than the statine-based inhibitor, have similar conformation compared to the latter (Fig. 3B). They lack the P4 moiety (with the exception of KNI-10729) and the side chains at P2'–P5', although the capping C-terminal group of the shorter inhibitors occupies the same position as the P2' side chain of the statine-containing inhibitor. Despite the differences in the lengths of the inhibitors, the number of hydrogen bonds made with the protease molecules is similar (Fig. 4). All inhibitors contain a hydroxyl group in the central Apns-Dmt isostere that interacts directly with both catalytic aspartates of the protease dimers, and, in common with most peptidic inhibitors of retroviral proteases, bind a highly conserved tetrahedrally-coordinated water molecule that mediates interactions between the inhibitor and both flaps of the enzyme. Although the inhibitors from the KNI series are much shorter than the statine-containing inhibitor, the number of hydrophobic contacts made with the protease is comparable (Fig. 5), explaining their generally higher potency. Moroever, the KNI compounds offer an additional type of interaction that is absent in the statine-containing inhibitor: the P3 phenyl function forms a cation-π stacking interaction with Arg10. Considering that this interaction preferably occurs between proximal functional groups on parallel planes, strong van der Waals forces exist between these two flat surfaces. This aromatic interaction and other hydrogen bond forces essentially anchor the inhibitor in place within the active site of the protease. The active site's walls then snuggly wrap around the inhibitor, as exemplified by KNI-10562. Thus, considering that the shapes of the enzyme pockets are dynamic, KNI-10562 offers a more elaborated fit than the statine-containing inhibitor, thereby contributing to its higher potency against HTLV-1 PR.
Figure 4.
Hydrogen-bonded interactions between HTLV-1 PR and the inhibitors. A) The binding site of KNI-10562. The inhibitor is shown in yellow sticks, whereas the residues of the enzyme are shown in ball-and-stick representation (molecule A: green, molecule B: cyan). B) Statine-based inhibitor bound to HTLV-1 PR. The inhibitor is shown as gray sticks. Hydrogen bonds are shown in black dashes.
Figure 5.
Hydrophobic interactions between HTLV-1 PR and the inhibitors. A) Interactions of KNI-10562. The inhibitor is shown with yellow sticks representing the carbon atoms, and red and blue sticks corresponding to oxygen and nitrogen, respectively. The model is covered with transparent spheres in their respective colors. The residues of the enzyme are also shown as sticks covered with transparent spheres (molecule A: green, molecule B: cyan). B) Interactions of the statine-based inhibitor, with its carbons colored gray.
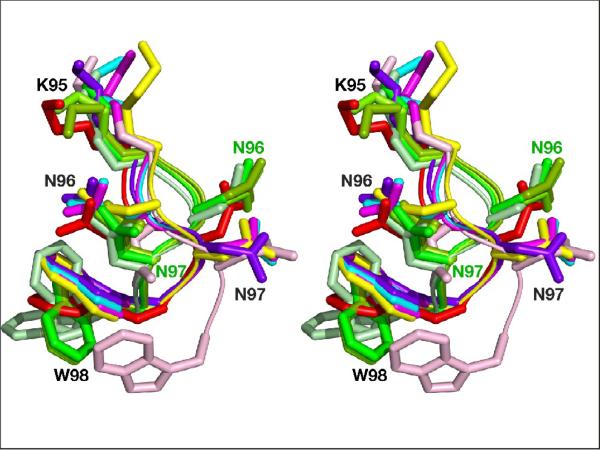
The most profound differences in the structures of the complexes of HTLV-1 PR with various inhibitors are found in the area of the loop 92–99. In this enzyme this loop adopts two distinctive conformations, unlike a single conformation assumed in the known structures of other retropepsins. In all monomers of the statine-based inhibitor complexes, with the exception of monomer D, the conformation of this loop (conformation 1) is such that the side chain of Asn97 is oriented towards the center of the dimer, whereas the side chain of Asn96 is oriented away from it (Fig. 6). In all other inhibitor complexes, as well as in monomer D of the complex with the statine-based inhibitor, loop 95–98 adopts a second conformation, in which the orientations of the two asparagines are switched, i.e. Asn97 points away from the center of the dimeric molecule, and Asn96 towards it (Fig. 6). As a result of this switch, the side chains of Asn97 from the loop with conformation 1 (a dominant conformation in the complexes with statine based inhibitors) and Asn96 from the loop with conformation 2 (in monomer D of the latter and in the complexes with all other inhibitors) occupies almost identical space within the protease structure. Although the position of Trp98 in monomer A of the complex with KNI-10729 is significantly shifted, the loop 92–99 still does not adopt conformation 1, following the directionality of conformation 2 (Fig. 6).
Figure 6.
Dual conformation of the loop 91–99 in HTLV-1 PR. The superimposed fragments of the loop comprising residues 94–98 are shown in ribbon representation. Five out of six loops with conformation 1 of the complex with the statine-based inhibitor are shown in green, whereas the sixth loop with conformation 2 is shown in red. Loops with conformation 2 in the complexes with other inhibitors are shown in pale pink, purple, yellow, magenta and cyan for KNI-10729, -10562, -10683, -10681 and -10673, respectively. The side chains of the residues of the loops are shown in stick representation.
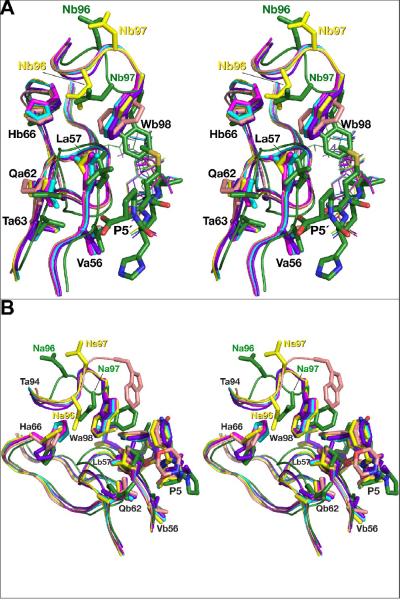
A comparative analysis of the complexes with different inhibitors indicates that the part of the active site which includes loops 92–99 and the flaps (residues 54–68) undergoes concerted conformational changes upon the binding of the inhibitors. The availability of the structures of the KNI compounds that are highly asymmetric in their length (long on the N-terminal end, short on the C-terminal end, Table 2) and the symmetrical long molecule of statine-based inhibitor allows rationalization of the significance of the inhibitor-enzyme interactions on the periphery of the inhibitor molecule. When the individual structures of the complexes with various inhibitors are superimposed in such a way that all inhibitors are oriented in the same direction, one half of all dimers will bare the consequences of the interactions with all the inhibitors, whereas in the second half the conformational changes due to the interactions with the inhibitor will be noticeable only in the complex with statine-based inhibitor. Fig. 7A clearly shows that the interactions with the flap of the P3' and P5' residues in the statine-based inhibitor, absent in the KNI inhibitor complexes, induce a significant shift of the flap towards the inhibitor. At the same time, the orientation of the side chain of Trp98 in the former complex has very distinctive conformation, when compared to that in the latter, where it adopts a closed conformation. Similar differences, although not as profound, can be seen for the orientation of His66 side chain.
Table 2. Chemical structures of the compounds used in this study and their inhibition of HTLV-1 protease.
Compounds that we were unable to crystallize are listed below the double line.
| Proprietary name | Chemical structure | Percent inhibition (%) at 50 nM |
|---|---|---|
| Statine Inhibitor |
|
19 |
| KNI-10562 |

|
78 |
| KNI-10673 |

|
29 |
| KNI-10681 |

|
40 |
| KNI-10683 |

|
76 |
| KNI-10729 |

|
79 |
| KNI-10516 |

|
86 |
| KNI-1595b |

|
5 |
| KNI-10220 |

|
61 |
| KNI-10296c |

|
28 |
Figure 7.
Concerted conformational changes in the flaps and loops 91–99 induced by the interactions with the inhibitors. The structures of all complexes are superimposed on the basis of their Cα coordinates. AB dimers are used for the complexes with the statine-based inhibitor and KNI-10562. The flaps are shown as ribbons, fragments of loop 91–99 comprising residues 94–98 and the side chains of the flaps are shown in stick representation. The color scheme is the same as in Fig. 6. A) A view of the active sites of the enzymes interacting with the C-terminal half of the statine-based inhibitor (shown as sticks), with the KNI inhibitors shown in thin lines. B) Superimposed fragments of the active sites of the all inhibitor complexes interacting with the N-terminal halves of the inhibitors (shown as sticks).
When we analyze the other half of the superimposed dimers (Fig. 7B), we can observe differences in several complexes between the structural elements described above. The shift of the flaps is most noticeable in two more complexes in addition to the statine-based one, namely KNI-10729 (shown in pale pink) and KNI-10562 (shown in purple). Similarly to what was previously described, the flaps shift towards the inhibitors. There is a significant shift in the position and orientation of Trp98 in KNI-10729, as well as of the loop 95–98 as a whole. The orientation of the side chain of His66 differs even much more dramatically, especially in the structures of the complexes with the statine-based inhibitor and KNI-10562 (purple), -10729 (pale pink), and -10683 (yellow). It should be noted that the latter three inhibitors exhibit higher percent inhibition compared to other ones (Table 2). In addition, KNI-10729 and -10562 are extended at their N termini and the extra atoms interact with the flaps, with the orientation corresponding to the placement of the P5 residue in the statine-based inhibitor complex.
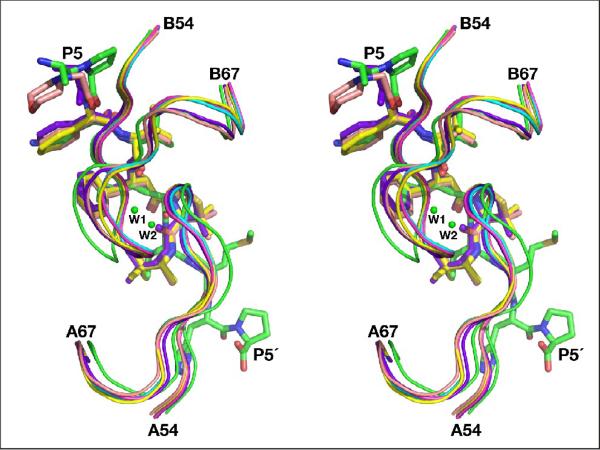
It appears that the presence of the peripheral interactions between the subsites P3 and P5 of the inhibitors and the flaps of the enzyme in the complexes with KNI-10729 and -10562 is in good agreement with the higher potency of these compounds. It is thus surprising that although similar interactions can be seen on both prime and unprimed sides of the statine-containing inhibitor, its inhibition is much weaker (Table 2). Indeed, the peripheral interactions between the statine-based inhibitor and both flaps shift the latter towards the inhibitor in both monomers, making the interactions stronger on both sides, but at the same time they pull the tips of the flaps apart to the extent that two water molecules are bound between them in one of the dimers in the structure of the complex (Fig. 8). The presence of equivalent water molecules has not been reported for any other structures of retropepsins with flaps in closed conformation. We can hypothesize that the asymmetry of the KNI inhibitors imparts a positive effect on their inhibitory properties. These compounds are still able to maintain strong interactions with the flap while the short P' side does not loosen the interactions between the tips of the flaps to the extent observed in the structure of the complex with the statine-based inhibitor, which demonstrates significantly weaker inhibitory activity when compared to KNIs.
Figure 8.
Two water molecules (shown as green balls) found between the tips of the flaps of monomers A and B in the complex with the statine-containing inhibitor. The superimposed flaps from all inhibitor complexes are shown as ribbons, whereas the inhibitors are shown as sticks. The color scheme is the same as in Fig. 6.
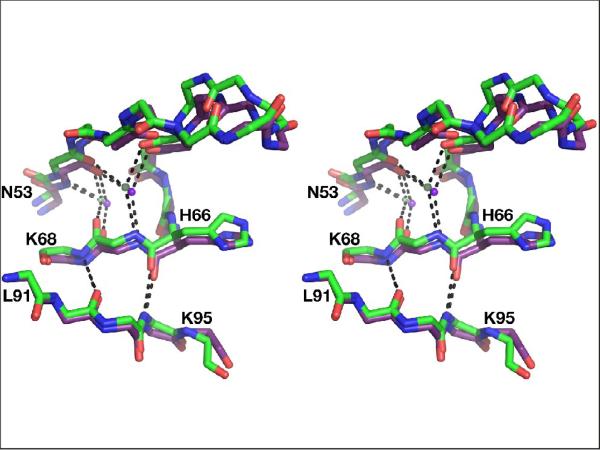
The cooperative character of the conformational changes observed in the flaps and in the loops 92–99 of various inhibitor complexes can be attributed to the hydrogen bonded network which connects these two secondary structure elements in the structure of HTLV-1 PR (Fig. 9). These interactions include two conserved water molecules, located next to each flap, near the unique insertion in HTLV-1 PR that includes His66. This insertion creates a zigzag structure in one strand of each flap that is otherwise present in an extended conformation in all other retroviral enzymes. Two water molecules maintain hydrogen bonding between the main chain atoms of both strands of the flaps in the vicinity of the zigzag, ensuring preservation of the beta structure of the flaps. As shown in Fig. 9, the same residues are involved in main chain-main chain interactions with residues 92 and 94 of the loop 91–99. Conformational changes of the latter region in the monomer D of the statine-containing complex prevent creation of similar interactions that are present in all other monomers of that complex.
Figure 9.
A hydrogen bonded network between the flaps and the fragment of the loop 91–99. Superimposed fragments of the complexes with the statine-based inhibitor (green) and KNI-10562 (cyan) are shown as sticks, whereas the two water molecules are shown as balls. Hydrogen bonds are shown as dashed lines.
The studies described here of the complexes of HTLV-1 PR with two types of inhibitors have highlighted the structural properties of this enzyme that differentiate it from other retropepsins. Such information should be helpful for the design of more specific and potent compounds that could be developed as drugs to combat human diseases caused by this virus.
Materials and Methods
Protein expression and purification
Expression and purification of HTLV-1 PR utilized procedures generally based on our previous work13, albeit with some significant modifications. The pHTLVΔ9PR plasmid (encoding residues 1–116) was transformed into Rosetta2(DE3)pLysS instead of BL21(DE3)pLysS. This strain change enabled much more significant overexpression of the enzyme. The inclusion bodies were solubilized by addition of 8 M urea, 10 mM Tris-HCl (pH 7.5), 5 mM EDTA and10 mM 2-mercaptoethanol, and were passed through a Q Sepharose Fast Flow column (GE Healthcare) equilibrated with 6 M urea, 20 mM Tris-HCl (pH 7.5), 5 mM EDTA, and 5 mM 2-mercaptoethanol. The eluate was adjusted to pH 3.0 by acetic acid and loaded onto a SP Sepharose Fast Flow column (GE Healthcare) equilibrated with buffer A (6 M urea, 20 mM sodium acetate (pH 3.0), 5 mM EDTA, and 5 mM 2-mercaptoethanol). The bound HTLV-1 PR protein was extensively washed with buffer A and eluted with 0.3 M NaCl in buffer A. The purified unfolded HTLV-1 PR was refolded by dialysis against 15 mM sodium acetate (pH 3.0), 5% polyethylene glycol 300, and 5 mM DTT. The refolding process at high protein concentration (~8 mg/mL) allowed us to obtain protein suitable for the crystallographic study. The HTLV-1 PR protein was ~90% pure, as judged by SDS/PAGE gels. The yield was approximately 40 mg protein per 1 L of bacterial culture. The expressed and purified HTLV-1 PR was enzymatically active and very stable: the protein could be stored and at 5 °C for at least 2 months while retaining its activity.
Synthesis of the inhibitors
The inhibitor Ac-Ala-Pro-Gln-Val-Sta-Val-Met-His-Pro (herafter referred to as the “Statine inhibitor”) was synthesized as previously described13. Details of the synthesis of a series of HTLV-1 PR-specific inhibitors, KNI-10220, -10516, -10673, -10681 and -10683, were also previously published18,20,21. Inhibitors KNI-1595b, -10296c, -10562, and -10729 were synthesized by standard BOP (benzotriazol-1-yl-oxy-tris-[dimethylamino]phosphonium hexafluorophosphate) liquid phase peptide synthesis in which sequential coupling to a corresponding Boc-protected amino acid was performed in DMF with BOP as coupling reagent in the presence of Et3N, and Boc-deprotection was achieved by treatment with 4 N HCl in dioxane. The N-terminus of KNI-10562 was protected by a reaction with methylchloroformate in DMF. The N-protective group of KNI-10729, morpholinoacetic acid, was synthesized from bromoacetic acid t-butyl ester and morpholine in THF at 65 °C in the presence of Et3N and followed by hydrolysis with HCl in the presence of anisole. After preparative HPLC purification, all target compounds were >98% pure by analytical HPLC. The identities of the compounds were confirmed by ESI-Q MS and/or TOF MS.
Evaluation of the inhibitory activities
The inhibitory properties of the compounds used in this study against an L40I mutant HTLV-1 PR were evaluated based on previously reported procedures21. The L40I mutation of the protease prevented autolysis, and enhanced enzyme stability13 and substrate cleavage, thus improving the reproducibility of the results21. Concentration of all test compounds was kept at 50 nM and the inhibition against the L40I mutant HTLV-1 PR (1 μg in 50 μL reaction mixture with OD595 ≈ 0.050, as a dimer) was expressed as inverse percentage of remaining activity, as a single determination (Table 2). As an improvement over our previous method, we used as substrate H-Lys([7-methoxycoumarin-4-yl]acetyl)–APQVL–(p-nitrophenylalanine)–VMHPL-OH, more chemically stable and fluorescent, instead of our previous non-fluorescent substrate H-Lys–APQVL–(p-nitrophenylalanine)–VMHPL-OH21. Both of these substrates can be used to determine the extent of hydrolysis between leucine and p-nitrophenylalanine.
Crystallization of the inhibitor complexes of HTLV-1 PR
All crystallization trials were conducted at the temperature of 20 °C. Since the concentration of HTLV-1 PR after purification was ~8 mg/mL, there was no need to concentrate the protein any further. Stock solutions of inhibitors were prepared by dissolving the compounds in 100% DMSO.
Crystals of a complex with the statine inhibitor were obtained by the vapor diffusion method in hanging drops mixed from 3 μL of protein/inhibitor mixture (molar ratio 1/4, protein monomer/inhibitor) and 3 μL reservoir solution consisting of 17% PEG8000, 16% PEG300, 0.1 M sodium acetate (pH 5.2) and 10 mM DTT, after equilibration at 20 °C for 3 weeks.
A number of inhibitors from the KNI series were used in attempts to obtain their cocrystals with HTLV-1 PR. The inhibitors used in crystallization trials included KNI-1595b, -10220, -10296c, -10516, -10562, -10673, -10681, -10683, and -10729. Significant precipitation was observed in the mixtures of HTLV-1 PR and KNI-10220, -10516, -10562, -1595b, or -10296c inhibitors; such precipitants were removed by centrifugation, so the final sample concentrations were not known. Crystals of HTLV-1 PR complexed with KNI-10562 were obtained by mixing 2 μl of the enzyme-inhibitor complex (~1/10 molar ratio) in 20 mM acetate buffer, 5 mM DTT and 5% PEG300, pH 4.5 with with 2 μL well solution containing 26% pentaerythritol ethoxylate, 0.2 M ZnSO4 in 0.1 M Bis-Tris buffer, pH 5.2. Crystals of the KNI-10683 complex were obtained by mixing an analogous sample with well solution containing 17% PEG8000, 16% PEG300, 10 mM DTT, 0.2 M KH2PO4 in 0.1 M Bis-Tris buffer at pH 5.2. In the case of KNI-10681, KNI-10673 and KNI-10729 complexes, the well solutions were same as the one used for crystallization of KNI-10683 complex, with an exception of that 0.01 M NaCl were added instead of 0.1 M KH2PO4. We are unable to grow crystals of the complexes of KNI-1595b, KNI-10220, KNI-10296c and KNI-10516 under the conditions listed above; extensive screening for other crystallization conditions also did not yield crystals.
X-ray data collection, structure determination, and refinement
X-ray diffraction data of HTLV-1 PR in complex with the statine inhibitor, as well as with all inhibitors from the KNI series, were collected at the Southeast Regional Collaborative Access Team beamline 22-ID (Advanced Photon Source, Argonne National Laboratory, IL) equipped a MAR 300CCD detector (MAR-Research, Hamburg). Each data frame corresponded to 1° rotation of the crystal and was measured in 5 sec. The diffraction data were integrated and scaled with HKL200026. The relevant parameters are shown in Table 1.
The crystal structures of HTLV-1 PR in complex with the inhibitors were solved by molecular replacement method using the program MOLREP27 with 2.6 Å resolution HTLV-1 PR dimer (PDB code: 2B7F) used as a search model. The resulting structures were initially refined using PHENIX28, whereas the final refinement was performed with REFMAC529. Model fitting to the electron density maps was performed manually using COOT30. The quality of the final models was assessed by PROCHECK31, showing that no amino acids were located in the disallowed regions of the Ramachandran plot, although the number of dihedral pairs in the additionally-allowed regions was substantial in the lower-resolution structures. The statistics of data collection and of final refinement are summarized in Table 1. The figures were prepared using the PyMOL software32.
Acknowledgements
We are grateful for Dr. T. Kimura and Dr. K. Hidaka, Kyoto Pharmaceutical University, for their advice and assistance. We acknowledge the use of beamline 22-ID of the Southeast Regional Collaborative Access Team (SER-CAT), located at the Advanced Photon Source, Argonne National Laboratory. Use of the APS was supported by the U.S. Department of Energy, Office of Science, Office of Basic Energy Sciences, under Contract No. W-31-109-Eng-38. This project has been funded in part by the Intramural Research Program of the NIH, National Cancer Institute, Center for Cancer Research, in part with federal funds from the National Cancer Institute, National Institutes of Health, under contract HHSN261200800001E, and in part by the Frontier Research Program from the Ministry of Education, Culture, Sports, Science and Technology (MEXT), Japan. The content of this publication does not necessarily reflect the views or policies of the Department of Health and Human Services, nor does mention of trade names, commercial products, or organizations imply endorsement by the U.S. Government.
Footnotes
Publisher's Disclaimer: This is a PDF file of an unedited manuscript that has been accepted for publication. As a service to our customers we are providing this early version of the manuscript. The manuscript will undergo copyediting, typesetting, and review of the resulting proof before it is published in its final citable form. Please note that during the production process errors may be discovered which could affect the content, and all legal disclaimers that apply to the journal pertain.
PDB accession codes Coordinates and structure factors have been deposited in the PDB with accession numbers 3LIY, 3LIN, 3LIQ, 3LIT, 3LIV, and 3LIX for the complexes with the statine-containing inhibitor, KNI-10562, -10673, -10681, -10683, and -10729, respectively.
References
- 1.Franchini G, Fukumoto R, Fullen JR. T-cell control by human T-cell leukemia/lymphoma virus type 1. Int. J. Hematol. 2003;78:280–296. doi: 10.1007/BF02983552. [DOI] [PubMed] [Google Scholar]
- 2.Uchiyama T. Human T cell leukemia virus type I (HTLV-I) and human diseases. Annu. Rev. Immunol. 1997;15:15–37. doi: 10.1146/annurev.immunol.15.1.15. [DOI] [PubMed] [Google Scholar]
- 3.Ishikawa T. Current status of therapeutic approaches to adult T-cell leukemia. Intl. J. Hematology. 2003;78:304–311. doi: 10.1007/BF02983554. [DOI] [PubMed] [Google Scholar]
- 4.Nasr R, El Sabban ME, Karam JA, Dbaibo G, Kfoury Y, Arnulf B, Lepelletier Y, Bex F, de The H, Hermine O, Bazarbachi A. Efficacy and mechanism of action of the proteasome inhibitor PS-341 in T-cell lymphomas and HTLV-I associated adult T-cell leukemia/lymphoma. Oncogene. 2005;24:419–430. doi: 10.1038/sj.onc.1208212. [DOI] [PubMed] [Google Scholar]
- 5.Kannagi M, Harashima N, Kurihara K, Utsunomiya A, Tanosaki R, Masuda M. Adult T-cell leukemia: future prophylaxis and immunotherapy. Expert. Rev. Anticancer Ther. 2004;4:369–376. doi: 10.1586/14737140.4.3.369. [DOI] [PubMed] [Google Scholar]
- 6.Wlodawer A. Rational approach to AIDS drug design through structural biology. Annu. Rev. Med. 2002;53:595–614. doi: 10.1146/annurev.med.53.052901.131947. [DOI] [PubMed] [Google Scholar]
- 7.Gustchina A, Jaskolski M, Wlodawer A. Lessons learned fighting HIV can be applied to anti-cancer drug design. Cell Cycle. 2006;5:463–464. doi: 10.4161/cc.5.5.2490. [DOI] [PubMed] [Google Scholar]
- 8.Tozser J, Weber IT. The protease of human T-cell leukemia virus type-1 is a potential therapeutic target. Curr. Pharm. Des. 2007;13:1285–1294. doi: 10.2174/138161207780618849. [DOI] [PubMed] [Google Scholar]
- 9.Shuker SB, Mariani VL, Herger BE, Dennison KJ. Understanding HTLV-I Protease. Chem. Biol. 2003;10:373–380. doi: 10.1016/s1074-5521(03)00104-2. [DOI] [PubMed] [Google Scholar]
- 10.Louis JM, Oroszlan S, Tozser J. Stabilization from autoproteolysis and kinetic characterization of the human T-cell leukemia virus type 1 proteinase. J. Biol. Chem. 1999;274:6660–6666. doi: 10.1074/jbc.274.10.6660. [DOI] [PubMed] [Google Scholar]
- 11.Tozser J, Zahuczky G, Bagossi P, Louis JM, Copeland TD, Oroszlan S, Harrison RW, Weber IT. Comparison of the substrate specificity of the human T-cell leukemia virus and human immunodeficiency virus proteinases. Eur. J. Biochem. 2000;267:6287–6295. doi: 10.1046/j.1432-1327.2000.01714.x. [DOI] [PubMed] [Google Scholar]
- 12.Vondrasek J, Wlodawer A. HIVdb: a database of the structures of human immunodeficiency virus protease. Proteins. 2002;49:429–431. doi: 10.1002/prot.10246. [DOI] [PubMed] [Google Scholar]
- 13.Li M, Laco GS, Jaskólski M, Rozycki J, Alexandratos J, Wlodawer A, Gustchina A. Crystal structure of human T-cell leukemia virus protease, a novel target for anti-cancer drug design. Proc. Natl. Acad. Sci. USA. 2005;102:18322–18337. doi: 10.1073/pnas.0509335102. [DOI] [PMC free article] [PubMed] [Google Scholar]
- 14.Abdel-Rahman HM, Kimura T, Hidaka K, Kiso A, Nezami A, Freire E, Hayashi Y, Kiso Y. Design of inhibitors against HIV, HTLV-I, and Plasmodium falciparum aspartic proteases. Biol. Chem. 2004;385:1035–1039. doi: 10.1515/BC.2004.134. [DOI] [PubMed] [Google Scholar]
- 15.Maegawa H, Kimura T, Arii Y, Matsui Y, Kasai S, Hayashi Y, Kiso Y. Identification of peptidomimetic HTLV-I protease inhibitors containing hydroxymethylcarbonyl (HMC) isostere as the transition-state mimic. Bioorg. Med. Chem. Lett. 2004;14:5925–5929. doi: 10.1016/j.bmcl.2004.09.034. [DOI] [PubMed] [Google Scholar]
- 16.Bagossi P, Kadas J, Miklossy G, Boross P, Weber IT, Tozser J. Development of a microtiter plate fluorescent assay for inhibition studies on the HTLV-1 and HIV-1 proteinases. J. Virol. Methods. 2004;119:87–93. doi: 10.1016/j.jviromet.2004.03.001. [DOI] [PubMed] [Google Scholar]
- 17.Wlodawer A, Vondrasek J. Inhibitors of HIV-1 protease: a major success of structure-assisted drug design. Annu. Rev. Biophys. Biomol. Struct. 1998;27:249–284. doi: 10.1146/annurev.biophys.27.1.249. [DOI] [PubMed] [Google Scholar]
- 18.Zhang M, Nguyen JT, Kumada HO, Kimura T, Cheng M, Hayashi Y, Kiso Y. Locking the two ends of tetrapeptidic HTLV-I protease inhibitors inside the enzyme. Bioorg. Med. Chem. 2008;16:6880–6890. doi: 10.1016/j.bmc.2008.05.052. [DOI] [PubMed] [Google Scholar]
- 19.Jaskolski M, Li M, Laco G, Gustchina A, Wlodawer A. Molecular replacement with pseudosymmetry and model dissimilarity: a case study. Acta Crystallogr. 2006;D62:208–215. doi: 10.1107/S0907444905040655. [DOI] [PubMed] [Google Scholar]
- 20.Zhang M, Nguyen JT, Kumada HO, Kimura T, Cheng M, Hayashi Y, Kiso Y. Synthesis and activity of tetrapeptidic HTLV-I protease inhibitors possessing different P3-cap moieties. Bioorg. Med. Chem. 2008;16:5795–5802. doi: 10.1016/j.bmc.2008.03.055. [DOI] [PubMed] [Google Scholar]
- 21.Nguyen JT, Zhang M, Kumada HO, Itami A, Nishiyama K, Kimura T, Cheng M, Hayashi Y, Kiso Y. Truncation and non-natural amino acid substitution studies on HTLV-I protease hexapeptidic inhibitors. Bioorg. Med. Chem. Lett. 2008;18:366–370. doi: 10.1016/j.bmcl.2007.10.066. [DOI] [PubMed] [Google Scholar]
- 22.Clemente JC, Govindasamy L, Madabushi A, Fisher SZ, Moose RE, Yowell CA, Hidaka K, Kimura T, Hayashi Y, Kiso Y, Agbandje-McKenna M, Dame JB, Dunn BM, McKenna R. Structure of the aspartic protease plasmepsin 4 from the malarial parasite Plasmodium malariae bound to an allophenylnorstatine-based inhibitor. Acta Crystallogr. 2006;D62:246–252. doi: 10.1107/S0907444905041260. [DOI] [PubMed] [Google Scholar]
- 23.Krissinel E, Henrick K. Secondary-structure matching (SSM), a new tool for fast protein structure alignment in three dimensions. Acta Crystallogr. 2004;D60:2256–2268. doi: 10.1107/S0907444904026460. [DOI] [PubMed] [Google Scholar]
- 24.Wlodawer A, Erickson JW. Structure-based inhibitors of HIV-1 protease. Annu. Rev. Biochem. 1993;62:543–585. doi: 10.1146/annurev.bi.62.070193.002551. [DOI] [PubMed] [Google Scholar]
- 25.Dauter Z, Botos I, LaRonde-LeBlanc N, Wlodawer A. Pathological crystallography - case studies of several unusual macromolecular crystals. Acta Crystallogr. 2005;D61:967–975. doi: 10.1107/S0907444905011285. [DOI] [PubMed] [Google Scholar]
- 26.Otwinowski Z, Minor W. Processing of X-ray diffraction data collected in oscillation mode. Methods Enzymol. 1997;276:307–326. doi: 10.1016/S0076-6879(97)76066-X. [DOI] [PubMed] [Google Scholar]
- 27.Vagin A, Teplyakov A. MOLREP: an automated program for molecular replacement. J. Appl. Cryst. 1997;30:1022–1025. [Google Scholar]
- 28.Adams PD, Grosse-Kunstleve RW, Hung LW, Ioerger TR, McCoy AJ, Moriarty NW, Read RJ, Sacchettini JC, Sauter NK, Terwilliger TC. PHENIX: building new software for automated crystallographic structure determination. Acta Crystallogr. 2002;D58:1948–1954. doi: 10.1107/s0907444902016657. [DOI] [PubMed] [Google Scholar]
- 29.Murshudov GN, Vagin AA, Dodson EJ. Refinement of macromolecular structures by the maximum-likelihood method. Acta Crystallogr. 1997;D53:240–255. doi: 10.1107/S0907444996012255. [DOI] [PubMed] [Google Scholar]
- 30.Emsley P, Cowtan K. Coot: model-building tools for molecular graphics. Acta Crystallogr. 2004;D60:2126–2132. doi: 10.1107/S0907444904019158. [DOI] [PubMed] [Google Scholar]
- 31.Laskowski RA, MacArthur MW, Moss DS, Thornton JM. PROCHECK: program to check the stereochemical quality of protein structures. J. Appl. Crystallogr. 1993;26:283–291. [Google Scholar]
- 32.DeLano WL. The PyMOL Molecular Graphics System. DeLano Scientific; San Carlos, CA: 2002. [Google Scholar]
- 33.Brünger AT. The free R value: a novel statistical quantity for assessing the accuracy of crystal structures. Nature. 1992;355:472–474. doi: 10.1038/355472a0. [DOI] [PubMed] [Google Scholar]


