Abstract
Characterization of the thermodynamic properties of multi-solute aqueous solutions is of critical importance for biological and biochemical research. For example, the phase diagrams of aqueous systems, containing salts, saccharides, and plasma membrane permeating solutes, are indispensible in the field of cryobiology and pharmacology. However, only a few ternary phase diagrams are currently available for these systems. In this study, an auto-sampler differential scanning calorimeter (DSC) was used to determine the quaternary phase diagram of the water-ethylene glycol-sucrose-NaCl system. To improve the accuracy of melting point measurement, a “mass redemption” method was also applied for the DSC technique. Base on the analyses of these experimental data, a comparison was made between the two practical approaches to generate phase diagrams of multi-solute solutions from those of single-solute solutions: the summation of cubic polynomial melting point equations versus the use of osmotic virial equations with cross coefficients. The calculated values of the model standard deviations suggested that both methods are satisfactory for characterizing this quaternary system.
Keywords: DSC, quaternary phase diagram, synthetic phase diagram, osmotic virial equation
Introduction
Thermodynamic properties of multiple-solute aqueous solutions, such as osmolality, activity, osmotic pressure and melting point, are among the most important parameters for the experimental and theoretical investigations of biologists and biochemists. Phase diagram measurement is a fundamental and critical approach to characterize these systems. However, determination of the phase diagram of a typical multiple-solute solution is time-consuming and laborious. For example, for a simple ternary system containing water, NaCl and one type of plasma membrane permeating solute, e.g. glycerol or ethylene glycol (EG), preparation of several hundred samples representing different compositions of these components is required and the measurement of their melting points will take more than 100 hrs. As a result, only a few such ternary phase diagrams have been determined: e.g. the phase diagram for the glycerol/NaCl/water system was studied by Shepard et al.[8]; Dimethyl sulphoxide/NaCl/water by Hildebrandt et al.[22]; sucrose/NaCl/water by Gayle et al.[6]; and EG/NaCl/water by Woods et al.[25]. Only part of a quaternary phase diagram of propane-1,2-diol/glycerol/NaCl/water was determined [18]. Currently, more and more bio-preservation solutions are supplemented with different types of saccharides, such as sucrose, raffinose, and trehalose [2,4,5,12,14,23], which function as plasma membrane stabilizers or ice blockers. However, there is a complete lack of quaternary phase diagrams to optimize the composition of these solutions. Accordingly, the determination of phase diagrams for these more complicated quaternary systems is needed for improving cryopreservation methods.
Auto-sampler differential scanning calorimeters (DSC) provide a practical approach to achieve this aim by reducing the required labor. For example, a typical auto-sampler DSC can automatically scan and analyze more than 40 samples in sequence. The measurement of the melting points of solutions using DSC, however, always suffers from the inaccuracy generated by the “thermal lag” phenomenon, which is a result of the limited thermal conduction ability of the frozen solutions and thermal resistance between the sample pan and DSC furnace. Accordingly, the direct use of the peak temperatures of the exothermic melting curves of solutions as their melting points may result in a difference as high as several °C, depending on warming rates, from the results measured using other methods [9]. To overcome this disadvantage, a redemption method based on the sample masses can be applied to minimize the influence of the “thermal lag” [10,15,19,21,26]. In this study, combining these two techniques, we determined the quaternary phase diagram of the water-ethylene glycol (EG)-sucrose-NaCl system, which is the first fully developed quaternary phase diagram of multi-solute solutions.
To avoid the laborious measurement of the phase diagrams of multiple-solute solutions, theoretical methods have been developed to generate them from single-solute solutions [3,11,16,17]. Two most representative methods among them are: 1) the direct summation of cubic polynomial equations that correlate the melting points with solute molalities [11] and 2) the use of osmotic virial equations with cross coefficients [3]. Both of these approaches have yielded accurate predictions for ternary systems [3,11]. It is of practical interest to compare the accuracy of the application of these two methods in the quaternary systems. In this study, that comparison was made using the results from our experiments.
Materials and methods
Medium
Sodium chloride and sucrose, EG were purchased from Sigma-Aldrich (the former two 99.5% pure, the latter 99% pure, St. Louis, MO, U.S.A.). The solutions were made in distilled and deionized water. The solute mass ratio R is defined as the ratio of the mass of EG over the summation of the mass of NaCl and sucrose, Rs as the mass ratio of sucrose over NaCl, and Wt as the weight fraction of all the solutes in the whole solutions. For a typical quaternary cryoprotecting solution, the values of R and Rs are larger than 1.0, and their values were chosen as the integers from 1 to 10 in this study. The values of Wt were increased from 0.05 to approximately 0.5~0.6, with 0.05 as each augment step. The maximum values of Wt depend on the values of R and Rs, considering the limitations to the solubility of sucrose and NaCl in water at room temperatures.
DSC and the mass redemption method
A volume of 8 μl of each solution was sealed in one 10μl aluminum crucible. Each sample was cooled from 1°C to −160°C at 100°C/min in a Pyris Diamond DSC (Perkin-Elmer Corp., Norwalk, CT, U.S.A.) using liquid nitrogen as its cooling fluid. After being held at −160°C for 1 minute, the sample was warmed to 20 °C at a rate of 10 °C/min. The peak temperature of the exothermic curve (TP) and its height from the baseline (Φ, unit: w) were calculated using the analytic software provided by Perkin-Elmer Corp. According to the relationship between the warming rate and peak temperature first derived by Illers [10], the melting point (Tm) is determined by:
| (1) |
where Δh is the transition enthalpy per unit mass, M is the mass of the sample, Rf is the thermal resistance between the sample pan and DSC furnace, and β is the warming rate. Since the value of is the same for all the samples, using a sample made by the same volume of water as the standard, the value of Tm can be obtained as:
| (2) |
where the subscript w is for the standard water sample, ΔS (unit: J) is the total area of the melting peak on the exothermic curve. For solutions with a relatively high concentration of solutes, determination of ΔS is technically difficult due to the low slope of the initial part of the melting peaks and devitrification of the solutions. Since the melting peaks have a similar geometric shape, the ratio of the square root of ΔS can be approximated by the ratio of . Therefore, Tm can be calculated by adjusting TP with the melting peak height as:
| (3) |
To validate this adjustment, three binary phase diagrams of EG-water, NaCl-water and sucrose-water systems were determined and the results were compared to previous publications [13].
Synthetic phase diagrams
For simplification, the subscript “a” is used to denote NaCl, “b” for sucrose, “c” for EG. W is the weight fraction of each solute in the solution, so R = Wc/(Wa + Wb), Rs= Wb/Wa, Wt = Wa + Wb + Wc, while water weight fraction is calculated as Ww = 100% − Wt. Wa, Wb and Wc can thus be expressed in terms of R, Rs and Wt as:
| (4) |
Assuming the water density is a constant, 1000kg/m3, the molality of each solute was then calculated by the equation mi = (Wi/MWi)/(Ww/1000), based on the definition of molality, where i denotes each solute species in the solution and MW is the molecular weight for each solute.
Using the cubic polynomial approach, the freezing points with different solute molalities for binary solute-water systems can be obtained as:
| (5) |
where TFP is the freezing point of the solution, C1, C2 and C3 are constant coefficients. The polynomial coefficients for NaCl, sucrose and EG from previous publication [11] are listed in Table 1. Those coefficients can then be used to calculate the freezing point depression of the quaternary system by the summation of freezing point depressions generated by each individual solute as:
| (6) |
Table 1.
Polynomial constant coefficients for binary systems used by the method developed by Kleinhans and Mazur [11]a.
| Solute | C1 | C2 | C3 | Max. Conc.(molal) |
|---|---|---|---|---|
| NaCl (a) | −3.34 | −0.0201 | −0.0231 | 5.2 |
| Sucrose (b) | −1.93 | −0.301 | 0.0221 | 5.4 |
| Ethylene Glycol (c) | −1.83 | −0.0531 | 0.0017 | 24.2 |
R2 > 0.9996 for each fit and coefficients are not valid above maximum concentration.
Using the osmotic virial equations, for most non-electrolytes, the relation between the osmolality and molality is:
| (7) |
where π is the osmolality of the solution, and B2 and C3 are the second and third osmotic virial coefficients, respectively. This polynomial expansion can be truncated to second-order terms for simple solutes such as sucrose and EG [3]. For NaCl, an apparent osmolality can be used to substitute ma [7]. The values of the B2 for these solutes can be found in previous study [3]. For a multi-solute solution, a simple mixing rule can be applied to obtain the overall osmolality of the system from existing data for the single solutes as:
| (8) |
Osmolality is also related to the freezing point depression of the aqueous solutions as deducted in previous investigations [1,20,24] as:
| (9) |
Therefore, the values of TFP in our system can be obtained by submitting:
| (10) |
into Eq.9. The calculated values of TFP using Eq.6 and Eq.9 were then compared with the measured values of Tm using the model standard deviation for each combination of R and Rs as:
| (11) |
where N is the total number of different values of Wt for a specific combination of R and Rs.
Results
The accuracy of the “mass redemption” method was demonstrated as shown in Fig. 1 for the binary phase diagrams of EG-water, sucrose-water and NaCl-water systems. The values of Tm for the quaternary system are listed in Appendix A as Supporting Information for different values of R, Rs and Wt. Several representative curves for R=1, 2, 3 and 7 are shown in Fig. 2. The values of σ̂ for two different methods are listed in Table 2. Figure 3 shows the comparisons between the two methods in several cases.
Fig. 1.
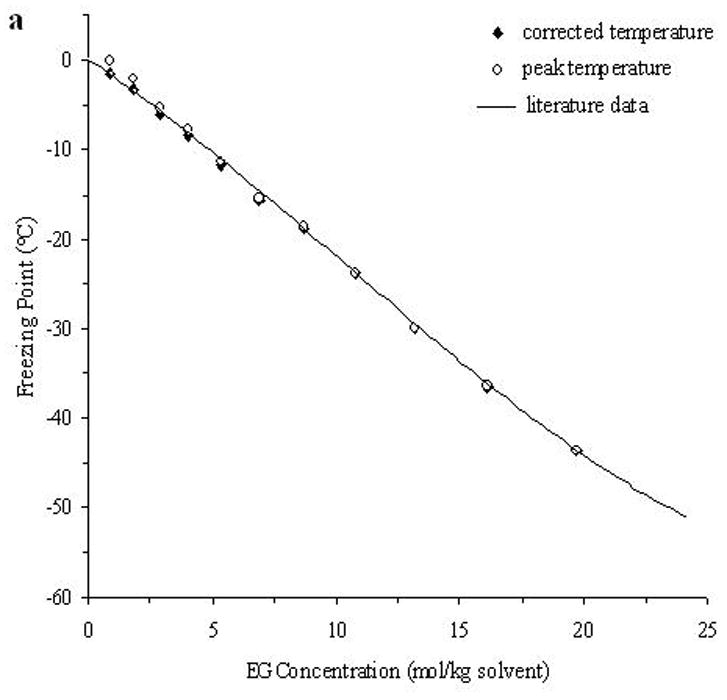
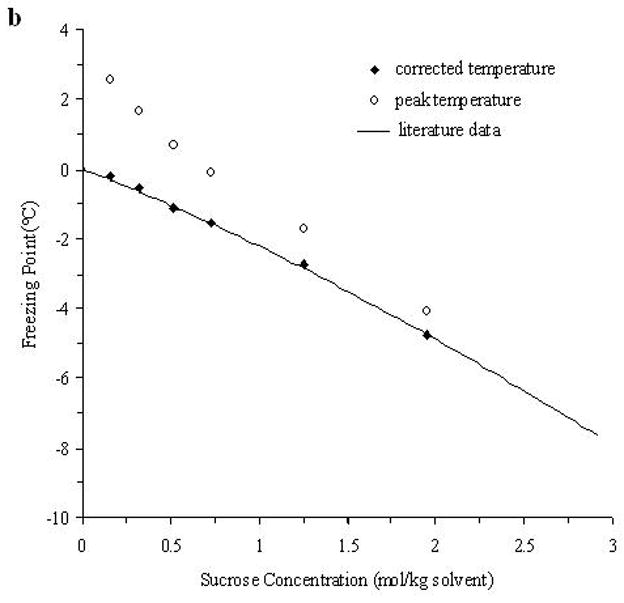
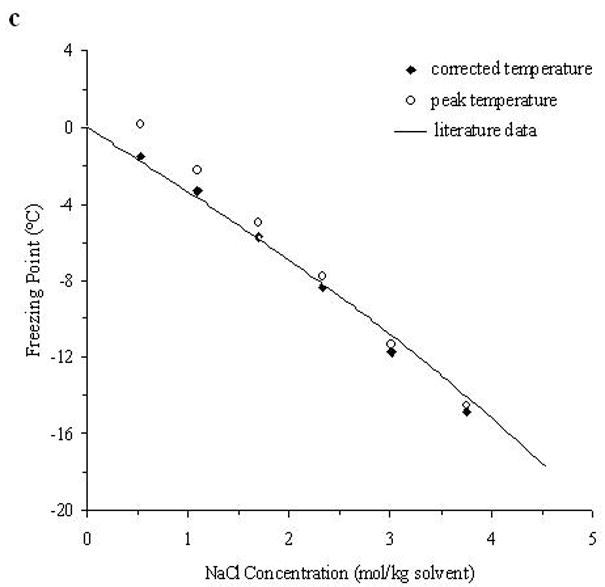
The demonstration of the improved measurement accuracy using the “mass-redemption” method for the binary phase diagrams of the binary systems of EG (a), sucrose (b) and NaCl (c) in water. The comparisons were made between the values of peak temperature (Tp in Eq.3), corrected melting points (Tm in Eq.3) and literature data [13].
Fig. 2.
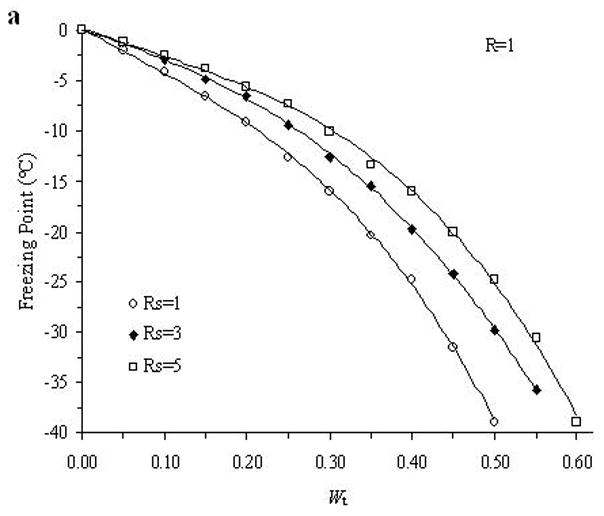
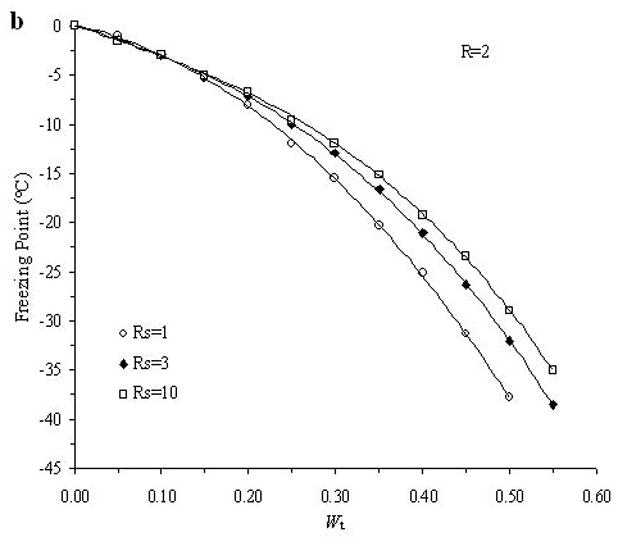
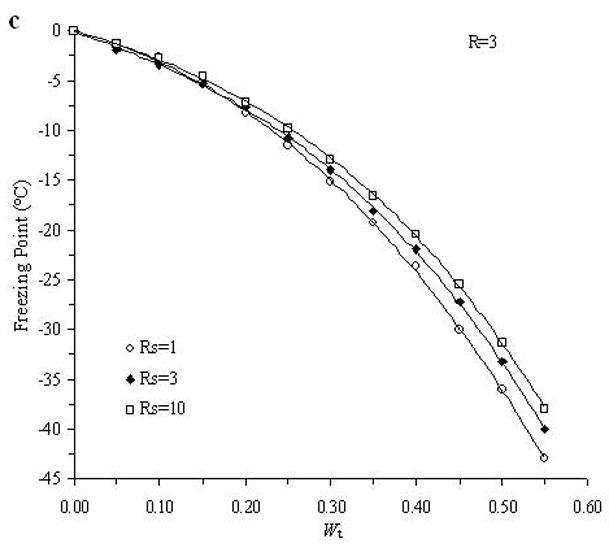
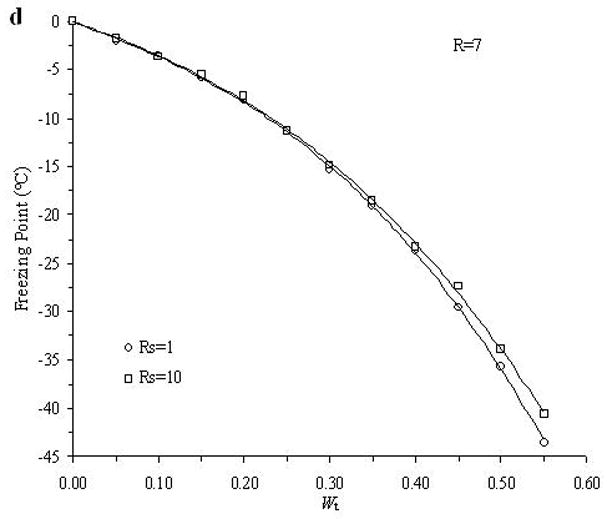
Examples of the experimentally derived isopleths of the water-ethylene glycol-sucrose-NaCl system for the cases where: A. R =1 and Rs=1, 3, 5; B. R =2 and Rs=1, 3, 10; C. R =3 and Rs=1, 3, 10; and D. R =7 and Rs=1, 10, where R is the ratio of the mass of EG to the summation over the mass of sucrose and NaCl, and Rs is the ratio of the mass of sucrose over the mass of NaCl, and with different total solute weight fractions (Wt).
Table 2.
The model standard deviations (σ̂) calculated from Eq.11 for different values of R and Rs using the two different synthetic methods: the summation of cubic polynomial equations for the binary systems (Eq.6) vs. the use of osmotic virial equations with cross coefficients (Eq.9 and 10).
| Method | R |
Rs |
|||||||||
|---|---|---|---|---|---|---|---|---|---|---|---|
| 1 | 2 | 3 | 4 | 5 | 6 | 7 | 8 | 9 | 10 | ||
| Summation of cubic polynomial equations (mean=0.96) | 1 | 2.35 | 2.06 | 0.97 | 1.30 | 0.74 | 1.03 | 0.56 | 0.67 | 1.07 | 0.96 |
| 2 | 0.92 | 1.48 | 0.84 | 1.06 | 1.04 | 0.66 | 0.75 | 0.60 | 0.79 | 0.61 | |
| 3 | 1.63 | 1.25 | 1.27 | 0.66 | 0.73 | 0.61 | 0.60 | 0.84 | 0.49 | 0.67 | |
| 4 | 1.32 | 1.09 | 1.40 | 1.65 | 0.56 | 0.96 | 0.84 | 1.20 | 1.04 | 0.52 | |
| 5 | 1.45 | 1.58 | 1.03 | 0.87 | 1.27 | 1.49 | 0.78 | 1.44 | 1.47 | 1.37 | |
| 6 | 1.13 | 0.87 | 0.73 | 1.01 | 1.09 | 0.95 | 0.31 | 0.88 | 0.69 | 0.95 | |
| 7 | 1.03 | 1.13 | 0.89 | 0.89 | 0.29 | 0.59 | 0.86 | 0.47 | 0.42 | 0.38 | |
| 8 | 1.33 | 0.81 | 0.68 | 0.93 | 1.29 | 0.88 | 0.52 | 0.52 | 0.45 | 0.48 | |
| 9 | 1.07 | 1.01 | 0.90 | 0.69 | 1.15 | 0.82 | 0.94 | 0.97 | 0.71 | 0.43 | |
| 10 | 1.52 | 1.14 | 1.18 | 0.97 | 1.15 | 1.03 | 1.16 | 0.89 | 1.06 | 0.99 | |
| Use of osmotic virial equations with cross coefficients (mean=1.46) | 1 | 1.59 | 1.01 | 1.54 | 1.56 | 1.71 | 1.63 | 1.78 | 1.59 | 1.52 | 1.61 |
| 2 | 1.12 | 1.11 | 1.49 | 1.47 | 1.58 | 1.61 | 1.77 | 1.76 | 1.64 | 1.76 | |
| 3 | 0.81 | 1.03 | 1.26 | 1.64 | 1.58 | 1.84 | 1.76 | 1.69 | 2.00 | 1.87 | |
| 4 | 0.82 | 1.07 | 0.81 | 1.10 | 1.51 | 1.41 | 1.40 | 1.20 | 1.43 | 1.78 | |
| 5 | 0.86 | 0.67 | 1.24 | 1.55 | 1.65 | 0.85 | 1.69 | 1.58 | 1.74 | 1.56 | |
| 6 | 1.66 | 1.29 | 1.33 | 1.24 | 1.33 | 1.57 | 1.79 | 1.48 | 1.92 | 1.32 | |
| 7 | 1.62 | 1.40 | 1.38 | 1.33 | 1.93 | 1.50 | 1.39 | 1.92 | 1.83 | 1.92 | |
| 8 | 1.27 | 1.17 | 1.45 | 1.39 | 1.27 | 1.45 | 1.82 | 1.78 | 1.67 | 1.92 | |
| 9 | 1.54 | 1.05 | 1.23 | 1.46 | 1.30 | 1.41 | 1.44 | 1.50 | 1.60 | 1.79 | |
| 10 | 0.95 | 2.44 | 1.02 | 1.51 | 0.94 | 1.28 | 1.66 | 1.18 | 1.14 | 1.44 | |
Fig. 3.
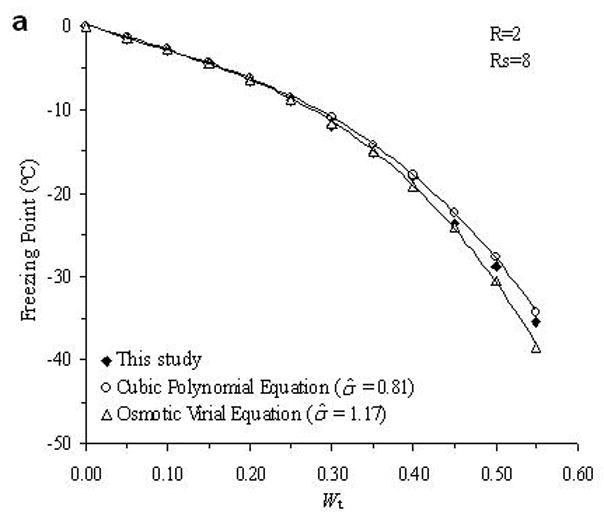
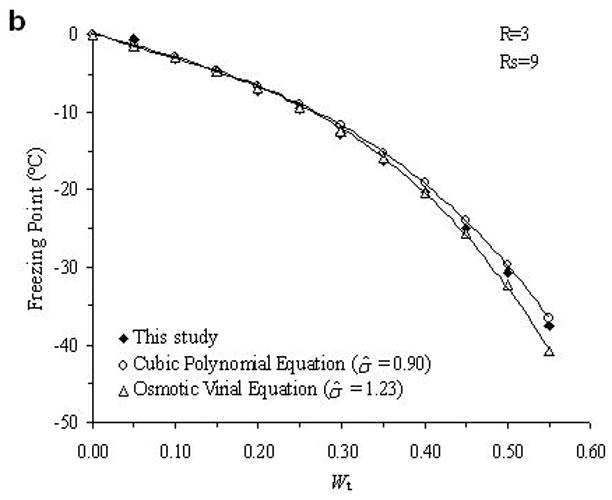
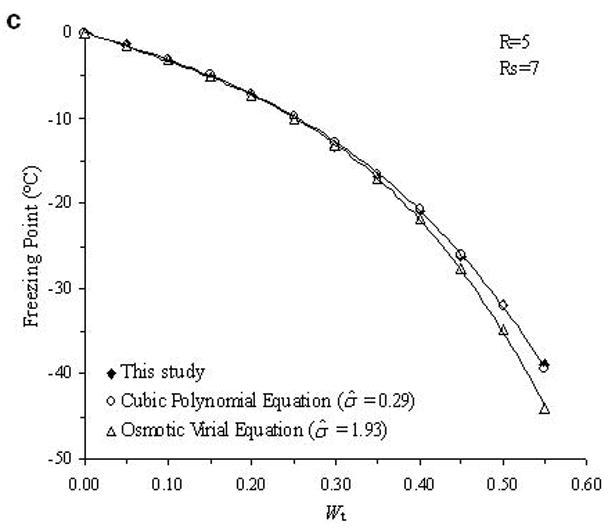
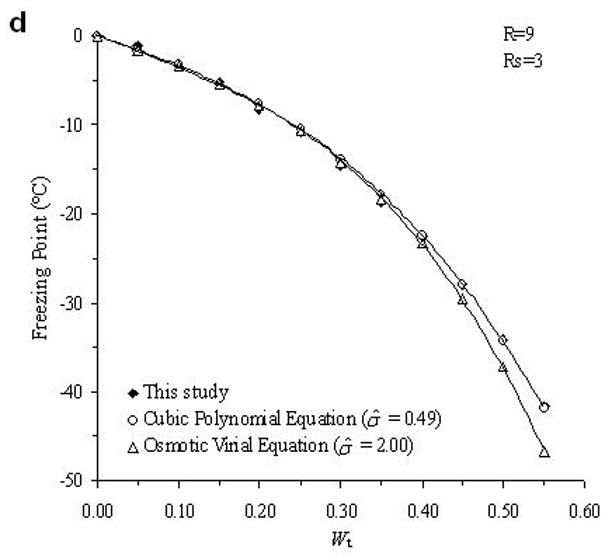
Examples of the comparison between the experimental data (black diamonds) of the determined phase diagram of the water-ethylene glycol-sucrose-NaCl system and the derived theoretical values from cubic polynomial equations (open circles) and osmotic virial equations (open triangles).
Discussion
As shown in Fig. 1, with the adjustment according to Eq.3, the results are nearly the same as those from published results [13] and the cubic polynomial equations obtained through curve fitting are almost the same as those listed in previous study [11], while the direct measurement of the peak temperatures results in a remarkable difference as high as approximately 5°C. The peak temperatures of the melting curve of the low concentration solutions (Wt<0.1) were even higher than 0°C due to thermal lags. Therefore, it is important to apply this “mass redemption” method to adjust the results to minimize the influence of thermal lags inherent in DSC measurement. However, for this quaternary system, when Wt=0.05 or 0.1, due to the very low concentration of sucrose or NaCl, the variation of Tm with different values of Rs can be as small as 0.1°C and it is still technically difficult to detect the differences of such small magnitude using DSC. Similar situations will be encountered in some cases when R>5 and Rs>5. Therefore, in Appendix A, the comparison between Tm with different values of Rs may be influenced by the measurement errors (<0.5°C) for the cases stated above.
From the comparison in Table 2, the direct summation of cubic polynomial equations developed by a previous study [11] demonstrated an accurate prediction (the mean value of σ̂ is 0.94) for our experimental data. In general, the method using osmotic virial equations with cross coefficients results in a higher deviation from the measured values (the mean value of σ̂ is 1.46), especially when the solute concentration is relatively high as shown in Fig. 3. There are two possible explanations for this disagreement. First, the binary system for water-EG system is not an ideal system for the application of the simple osmotic viral equations. As shown in Fig. 1.a, this binary phase diagram requires a cubic, or higher order polynomial equation to describe the relationship between the melting points and solute molality; while the virial parameters used in previous study [3] were obtained from a modified binomial equation, i.e. Eq.8. This defect may be improved by incorporating the third virial coefficient, C3, but the complexity of the items for solute interaction in Eq.10 would become significantly increased by appending the item and new errors might be generated. Second, the cross coefficients B2 in Eq.10 were obtained from the curve-fitting of each binary phase diagram, performed in previous study [3]. Although this approach for the use of the cross coefficients is well supported in ternary systems [3], the cross coefficients may be influenced by the concentrations of solutes in a more complicated quaternary systems. However, when the concentration of NaCl is relatively high (Rs=1 and R=1; Rs=2 and R=1), the use of virial equations achieves better results (σ̂ =1.59 and 1.01, respectively) than the use of cubic polynomial equations (σ̂ =2.35 and 2.06, respectively), which may suggest the importance of the adjustment of solute interaction in this special case. Further investigation of the improvement the efficiency of the application of the osmotic virial equations in a quaternary system is under development.
Conclusion
In this study, using an auto-sampler DSC and a mass redemption method, the quaternary phase diagram was developed for the water-ethylene glycol-sucrose-NaCl system. Based on our experimental data, two theoretical methods to generate phase diagrams of multi-solute solutions were tested and their accuracies were compared. This comparison demonstrated that the method using the summation of cubic polynomial melting point equations yields more accurate predictions for this quaternary system. The accuracy of the method using osmotic virial equations with cross coefficients may be improved by modifying its approach to represent the properties of binary solutions.
Supplementary Material
Footnotes
Supporting Information Available: The values of Tm for the quaternary system are listed in Appendix A as Supporting Information for different values of R, Rs and Wt.
Publisher's Disclaimer: This is a PDF file of an unedited manuscript that has been accepted for publication. As a service to our customers we are providing this early version of the manuscript. The manuscript will undergo copyediting, typesetting, and review of the resulting proof before it is published in its final citable form. Please note that during the production process errors may be discovered which could affect the content, and all legal disclaimers that apply to the journal pertain.
References
- 1.Cengel YA, Boles MA. In thermodynamics: An Engineering Approach. 3. WCB/McGraw-Hill; Boston, MA: 1998. [Google Scholar]
- 2.Cho HJ, et al. An improved protocol for dilution of cryoprotectants from vitrified human blastocysts. Hum Reprod. 2002;17:2419–2422. doi: 10.1093/humrep/17.9.2419. [DOI] [PubMed] [Google Scholar]
- 3.Elliott JAW, Prickett RC, Elmoazzen HY, Porter KR, McGann LEJ. A multisolute osmotic virial equation for solutions of interest in biology. Phys Chem B. 2007;111:1775–1785. doi: 10.1021/jp0680342. [DOI] [PubMed] [Google Scholar]
- 4.Erdag G, Eroglu A, Morgan JR, Toner M. Cryopreservation of fetal skin is improved by extracellular trehalose. Cryobiology. 2002;44:218–228. doi: 10.1016/s0011-2240(02)00023-8. [DOI] [PubMed] [Google Scholar]
- 5.Eroglu A, Bailey SE, Toner M, Toth TL. Successful cryopreservation of mouse oocytes by using low concentrations of trehalose and dimethylsulfoxide, biology of reproduction. 2009;80:70–78. doi: 10.1095/biolreprod.108.070383. [DOI] [PMC free article] [PubMed] [Google Scholar]
- 6.Gayle FW, Cocks FH, Shepard ML. The H2O–NaCl–sucrose phase diagram and applications to cryobiology. J Appl Chem Biotechnol. 1977;27:599–607. [Google Scholar]
- 7.Heyrovská RJ. Equation for densities and dissociation constant of NaCl (aq) at 25 °C from “zero to saturation” based on partial dissociation. Electrochem Soc. 1997;144:2380–2384. [Google Scholar]
- 8.Hildebrandt WH, Cocks FH, Shepard ML. The primary ice phase field in the H2O-NaCl-dimethyl sulphoxide ternary system. J Mater Sci. 1978;13:1104–1109. [Google Scholar]
- 9.Hohne WH, Hemminger WF, Flammersheim HJ. Differential scanning calorimetry. 2. Springer-Verlag Berlin; Herdelberg: 2003. [Google Scholar]
- 10.Illers KH. Die Ermittlung des Schmelzpunktes von kristallinen Polymeren mittels Wärmeflußkalorimetrie (DSC) Eur Polym J. 1974;10:911–916. [Google Scholar]
- 11.Kleinhans FW, Mazur P. Comparison of actual vs. synthesized ternary phase diagrams for solutes of cryobiological interest. Cryobiology. 2007;54:212–222. doi: 10.1016/j.cryobiol.2007.01.007. [DOI] [PMC free article] [PubMed] [Google Scholar]
- 12.Lee LQ, et al. Cryopreservation of adipose tissues: The role of trehalose. Aesthetic surgery journal. 2005;25:126–131. doi: 10.1016/j.asj.2005.01.003. [DOI] [PubMed] [Google Scholar]
- 13.Lide DR, editor. CRC handbook of chemistry and physics. 90. 2010. Internet Version. [Google Scholar]
- 14.Lucena E, et al. Successful ongoing pregnancies after vitrification of oocytes. Fertility and Sterility. 2006;85:108–111. doi: 10.1016/j.fertnstert.2005.09.013. [DOI] [PubMed] [Google Scholar]
- 15.Neuenfeld S, Schick C. Verifying the symmetry of differential scanning calorimetry concerning heating and cooling using liquid crystal secondary temperature standards. Thermochim Acta. 2006;446:55–65. [Google Scholar]
- 16.Pegg DE. Equations for obtaining melting points and eutectic temperatures for the ternary system dimethyl sulphoxide/sodium chloride/water. Cryo-Letters. 1986;7:387–394. [Google Scholar]
- 17.Pegg DE. Simple equations for obtaining melting points and eutectic temperatures for the ternary system glycerol/sodium chloride/water. Cryo-Letters. 1983;4:259–269. [Google Scholar]
- 18.Pegg DE, Arnaud FG. Equations for obtaining melting points in the quaternary system propane-1,2-diol/glycerol/sodium chloride/water. Cryo-Letters. 1988;9:404–417. [Google Scholar]
- 19.Poel GV, Mathot VBF. High-speed/high performance differential scanning calorimetry (HPer DSC): Temperature calibration in the heating and cooling mode and minimization of thermal lag. Thermochim Acta. 2006;446:41–54. [Google Scholar]
- 20.Prausnitz JM, Lichtenhaler RN, Azevedo EGD. Molecular thermodynamics of fluid-phase equilibria. Prentice-Hall, Eaglewood cliffs; New Jersey: 1999. [Google Scholar]
- 21.Sarge SM, Höhne GWH, Cammenga HK, Eysel W, Gmelin E. Temperature, heat and heat flow calibration of scanning calorimeters in the cooling mode. Thermochim Acta. 2000;361:1–20. [Google Scholar]
- 22.Shepard ML, Goldston CS, Cocks FH. The H2O-NaCl-glycerol phase diagram and its application in cryobiology. Cryobiology. 1976;13:9–23. doi: 10.1016/0011-2240(76)90154-1. [DOI] [PubMed] [Google Scholar]
- 23.Toshiaki H, Miho T, Rika S, Minesuke Y. Cryoprotective effects of various saccharides on cryopreserved mouse sperm from various strains. Reproductive medicine and biology. 2007;6:229–233. doi: 10.1111/j.1447-0578.2007.00190.x. [DOI] [PMC free article] [PubMed] [Google Scholar]
- 24.Winzor DJ. Reappraisal of disparities between osmolality estimates by freezing point depression and vapor pressure deficit methods. Biophys Chem. 2004;107:317–323. doi: 10.1016/j.bpc.2003.11.010. [DOI] [PubMed] [Google Scholar]
- 25.Woods EJ, Zieger MAJ, Gao DY, Critser JK. Equations for obtaining melting points for the ternary system ethylene glycol/sodium chloride/water and their application to cryopreservation. Cryobiology. 1999;38:403–407. doi: 10.1006/cryo.1999.2174. [DOI] [PubMed] [Google Scholar]
- 26.Yen KC, Woo EM. Thermodynamic and kinetic thermal analyses on dual crystal forms in polymorphic polyheptamethylene terephthalate. J Polym Sci Part B: Polym Phys. 2009;47:1839–1851. [Google Scholar]
Associated Data
This section collects any data citations, data availability statements, or supplementary materials included in this article.


