

Abstract
The opening and closing of voltage-gated potassium (Kv) channels are controlled by several conserved Arg residues in the S4 helix of the voltage-sensing domain. The interaction of these positively charged Arg’s with the lipid membrane has been of intense interest for understanding how membrane proteins fold to allow charged residues to insert into lipid bilayers against free energy barriers. We have now determined the orientation and insertion depth of the S4 peptide of the KvAP channel in lipid bilayers using solid-state NMR. 2D 15N correlation experiments of macroscopically oriented S4 peptide in phospholipid bilayers revealed a tilt angle of 40°, and two possible rotation angles differing by 180° around the helix axis. Remarkably, the tilt angle and one of the two rotation angles are identical to those of the S4 helix in the intact voltage-sensing domain, suggesting that interactions between the S4 segment and other helices of the voltage-sensing domain is not essential for the membrane topology of the S4 helix. 13C-31P distances between the S4 backbone and the lipid 31P indicate a ~9 Å local thinning and 2 Å average thinning of the DMPC/DMPG bilayer, consistent with neutron diffraction data. Moreover, a short distance of 4.6 Å from the guanidinium Cζ of the second Arg to 31P indicates the existence of guanidinium-phosphate hydrogen bonding and salt bridge. These data suggest that the structure of the Kv gating helix is mainly determined by protein-lipid interactions instead of inter-helical protein-protein interactions, and the S4 amino acid sequence encodes sufficient information for the membrane topology of this crucial gating helix.
Keywords: Membrane proteins, potassium channel voltage sensor, solid-state NMR, arginine-lipid interaction, helix orientation
Introduction
Voltage-activated potassium (Kv) channels are important for electrical signaling by neurons and muscle cells. The Kv voltage-sensing domain, which contains four helices designated S1 to S4, drives the opening and closing of the potassium-conducting pore in response to changes in the membrane potential 1; 2. Most of the gating charges are located on the S4 helix, which contains several conserved arginine residues (Arg) at every third position 3. High-resolution crystal structures 4-6 and avidin accessibility measurements 7 suggested that the S3b-S4 segment, which forms a helix-turn-helix motif called the voltage-sensing paddle, moves by as much as 15 Å during channel activation under depolarizing membrane voltages. Since positively charged Arg residues incur a high free energy cost to insert into the low-dielectric hydrophobic core of lipid bilayers 8, there has been intense interest in understanding how the Arg-rich S4 helix is structured in the lipid bilayer in the resting and activated states of the protein. The paddle model proposes that the gating Arg’s interact directly with the lipids 5, while the canaliculi model proposes that the Arg’s are shielded by acidic residues in other transmembrane (TM) helices 9. Molecular dynamics (MD) simulations of the S4 helix alone 10 and of the entire voltage-sensing domain 11; 12 suggested that Arg-phosphate salt bridges, water clusters near the guanidinium moieties deep in the membrane, and membrane thinning, contribute to the stabilization of the S4 Arg’s in the lipid membrane. Conductivity measurements showed that voltage sensing requires phosphate groups in lipid membranes 13; 14, also supporting the notion that the voltage-sensing domain interacts strongly with the lipid headgroups. Neutron diffraction of the KvAP S1-S4 domain in POPC/POPG bilayers showed that the voltage sensor is fully embedded in the lipid bilayer and does not cause strong perturbations of the membrane structure 15. Despite this increasing body of evidence, atomic-level structural information of the Kv voltage-sensing paddle and the Arg residues therein, measured directly in phospholipid bilayers, remains scarce.
Solid-state NMR spectroscopy has contributed significantly to the understanding of the structural basis for the function of Arg-rich membrane peptides such as antimicrobial peptides 16; 17 and cell-penetrating peptides 18; 19. These studies demonstrated the feasibility of measuring inter-atomic distances between Arg residues and lipid phosphates in multilamellar lipid membranes. In addition, due to the intrinsic orientation dependence of NMR frequencies, solid-state NMR spectroscopy is a sensitive probe of the orientation of membrane proteins in lipid bilayers. Here, we combine static oriented-membrane solid-state NMR techniques with magic-angle spinning experiments to determine the orientation, depth of insertion, and Arg-phosphate interaction of the Kv S4 peptide in phospholipid bilayers. We compare these results with the structure of the S4 helix in the intact voltage sensor to infer the importance of lipid-protein versus protein-protein interactions for channel gating.
Results
S4 backbone conformation in the lipid bilayer
Before determining the S4 peptide orientation, we first measured the backbone conformation of the KvAP S4 peptide (residues 113-130) to confirm if this segment is α-helical in the lipid membrane in the absence of the other helices of the voltage-sensing domain. For this purpose we measured the 13C isotropic chemical shifts of six labeled residues distributed throughout the segment: Gly2, Leu6, Val7, Arg8, Leu9 and Ile15. A representative 2D 13C-13C DARR 20 correlation spectrum is shown in Fig. 1a. The difference of the Cα, Cβ, and CO isotropic chemical shifts from the random coil values gives information about the protein secondary structure 21. Fig. 1b shows that most residues exhibit positive CO and Cα secondary shifts and negative Cβ secondary shifts, which are characteristic of the α-helical conformation. The only exception is the N-terminal Gly2, which is consistent with the fact that the corresponding Gly114 in the intact KvAP voltage sensor is part of the turn between the S3b and S4 helices 4.
Figure 1.
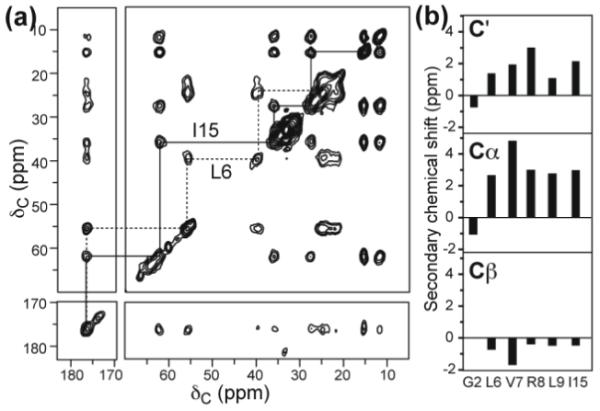
13C isotropic chemical shifts of the KvAP S4 peptide in DMPC/DMPG bilayers. (a) 2D 13C-13C correlation spectrum of Leu6, Ile15 labeled S4 at 263 K, with a spin diffusion mixing time of 30 ms. (b) Secondary chemical shifts of CO, Cα and Cβ of labeled residues, using random coil chemical shifts of reference 21 (Table S1).
S4 helix orientation in the lipid bilayer
The S4 helix orientation was determined using a 2D 15N NMR experiment that correlates the 15N-1H dipolar coupling with the 15N CSA of uniaxially aligned peptides 22. Due to the periodic orientation distribution of the backbone N-H bonds with respect to the helix axis and the relative orientation of the 15N chemical shift tensor to the N-H bond, these 2D spectra exhibit wheel-like patterns 23; 24 whose position and size indicate the tilt angle of the helix from the bilayer normal. The position of individual resonances on these “PISA” wheel indicates the directions of the sidechains around the helical axis.
We oriented the S4 peptide using magnetically aligned DMPC/6-O-PC bicelles. Static 31P spectra show sharp peaks at frequencies consistent with well-aligned bicelles whose bilayer normal is perpendicular to the magnetic field (Fig. 2a). No isotropic 31P peak was observed in the bicelle spectrum, and the unoriented spectrum of S4-containing DMPC/DMPG bilayers also shows a uniaxial powder pattern except for a phosphate buffer peak, indicating that the peptide does not perturb the bilayer integrity. The absence of strong membrane perturbation is consistent with neutron diffraction data of the S1-S4 domain in POPC/POPG membranes 15. Fig. 2b, c show the 2D 15N correlation spectra of the oriented S4 peptide: the Val7, Leu9-labeled sample shows an N-H dipolar splitting of 1.2 kHz (read as twice the value from the zero-frequency axis) for one residue and nearly vanishing coupling for the other (b), while the triply Gly2, Leu6, Ile15-labeled sample shows a maximum N-H splitting of 2.8 kHz (c). The latter spectrum can be partially assigned on the basis of the 15N-labeled positions: Leu6 and Ile15 should differ in their ρ angles by 180° since every consecutive residue in an α-helix increments the ρ angle by 100°. Thus Leu6 and Ile15 peaks should appear on opposite sides of the PISA wheel. As a result, the 120 ppm and 95 ppm peaks in Fig. 2c must be assigned to Leu6 and Ile15, while the weak signal at 106 ppm can be assigned to Gly2. Its nearly vanishing coupling is consistent with the unstructured nature of Gly2 obtained from the 13C isotropic chemical shifts. Since Gly2 is not part of the α-helix, we do not consider its 15N frequencies in the following orientation analysis.
Figure 2.

Static orientation-dependent spectra of KvAP S4. (a) 31P spectra of S4-containing unoriented DMPC/DMPG membranes (top) and magnetically aligned DMPC/6-O-PC bicelles (bottom). The minor peak at 0 ppm (top) is the phosphate buffer signal. (b-c) 2D N-H dipolar and 15N CSA correlation spectra of bicelle aligned S4 peptide. (b) Val7, Leu9 15N-labeled S4 peptide. (c) Gly2, Leu6 and Ile15 15N-labeled S4 peptide.
Fig. 3a compares the sum of the two experimental spectra with simulated 2D PISA wheel spectra for an ideal α-helix with tilt angles of 0° to 90°. The best-fit τ is found at 40°, where the position and size of the wheel are in excellent agreement with the experimental spectrum. The observed linewidths are 4 – 5 ppm for the 15N anisotropic chemical shift dimension and 0.4 – 0.5 kHz for the dipolar dimension. These linewidths allow the tilt angle to be determined with a precision better than 5°, as shown in Fig. S1. A survey of published oriented membrane protein spectra shows that the 15N anisotropic chemical shift linewidths range from 2.5 ppm to 9 ppm, while the N-H dipolar coupling dimension has linewidths of 0.3 - 1.2 kHz. This linewidth variation reflects the intrinsic conformational distribution and dynamic disorder of the different membrane proteins 25-30.
Figure 3.
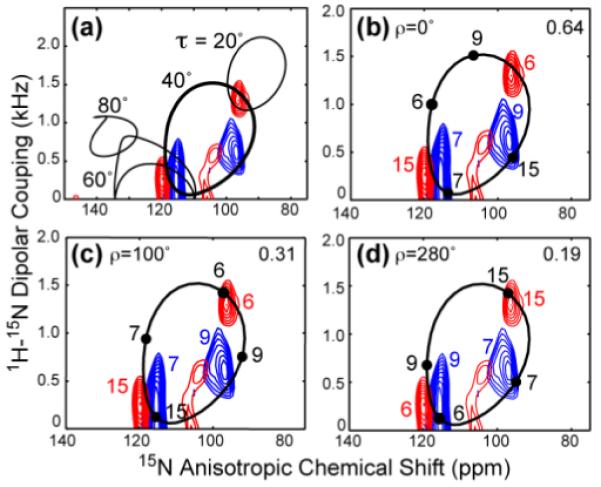
Simulated orientation-dependent spectra of the KvAP S4 peptide. (a) Simulated 2D 15N-1H dipolar and 15N CSA correlation spectra (black lines) overlaid with the sum of the two experimental spectra of Fig. 2b, c. Best fit is τ=40° ± 5°. Simulated spectra used a general order parameter of 0.8, estimated from Fig. S4 57. (b-d) Simulated 2D spectra for τ = 40° and different ρ angles. (b) ρ = 0°. (c) ρ = 100°. (d) ρ = 280°. The assignment in the simulated spectra is annotated in black, while the assignment for the experimental spectrum is shown in color. The RMSD between the calculated and measured spectra is indicated in the upper right corner of each panel.
To extract the ρ angle, we require that not only should the individual resonance positions on the τ=40° wheel have minimal deviations from the measured frequencies, but also the order of peaks around the PISA wheel should follow the intrinsic orientation relationships of the N-H bonds. Excluding Gly2, the order of the four residues in the clockwise direction should be Leu6, Leu9, Ile15, and Val7. Fig. 3b-d show simulated spectra for several ρ angles, where the RMSD between the simulated and experimental spectra is indicated. The ρ=0° spectrum is an example of poor fit with large RMSD, while ρ=100°±20° and 280°±20° show good agreement with the experimental spectra and correspond to the two RMSD minima in the full 360° range (Fig. S2). Moreover, the peak assignments are consistent with the known 15N-labeled positions in the two samples. The difference of 180° in the two ρ solutions is not coincidental, since Leu6 and Ile15 differ in ρ by 180° while Val7 and Leu9 differ in ρ by 200°, thus the two ρ angles are nearly degenerate. Although the RMSD values indicate that ρ=280° agrees better with the experimental spectra, due to the near degeneracy we consider both orientations in the subsequent structural analysis that combines the insertion depth and the peptide orientation.
Depth of insertion of S4 residues and Arg - phosphate interaction
We probed the insertion depth of the S4 helix through 13C-31P distances between the peptide and the lipid. Cα-P distances indicate the backbone immersion depths while the Arg Cζ distance to 31P identify possible salt bridges and snorkeling 31. The 31P atoms lie in lamellar planes in our membrane samples based on the lack of isotropic peaks in the static 31P spectra of both oriented bicelles and unoriented liposomes (Fig. 2). Fig. 4 shows representative 13C-31P REDOR data. Arg8 guanidinium Cζ shows the shortest 13C-31P distance of 5.5 Å when fit with a single distance. When the slower dephasing at long mixing times were taken into account, then a 1:1 combination of a 4.6 Å distance and a 7.8 Å distance was found to best reproduce the data. Thus, at least 50% of the Arg8 guanidinium lies within hydrogen-bonding distance to the lipid phosphate headgroups.
Figure 4.
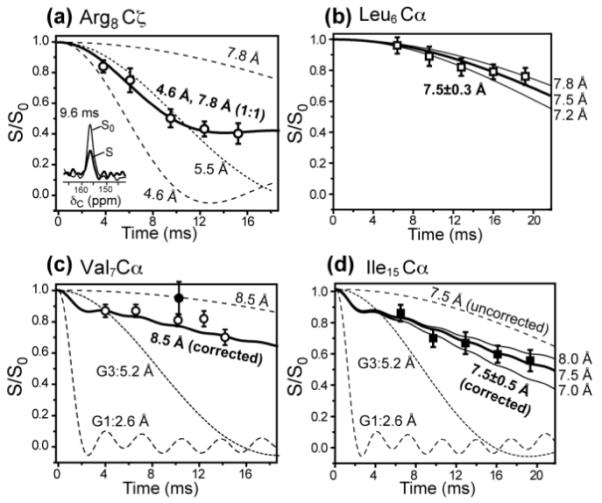
Representative 13C-31P REDOR data of the S4 peptide bound to DMPC/DMPG membranes. (a) Arg8Cζ data. Best fit involves a 1:1 combination of a short distance of 4.6 ± 0.2 Å and a long distance of 7.8 Å with an error bar of −0.6 Å and +1.2 Å (Figure S6). The single-distance best fit is 5.5 Å. Representative control (S0, thin line) and dephased spectra (S, thick line) are shown in the inset. (b) Leu6Cα, with a best-fit distance of 7.5 ± 0.3 Å. (c) Val7Cα, with a best-fit distance of 8.5 ± 1.0 Å. (d) Ile15 Cα, with a best-fit distance of 7.5 ± 0.5 Å. For (c) and (d), the simulated REDOR decay curves (solid lines) were corrected for lipid G1 and G3 intensities, whose distances to 31P are fixed (dashed lines). In (c), a double-quantum REDOR data point (filled circle) falls on the uncorrected REDOR curve for 8.5 Å, confirming the single-quantum corrected REDOR distance simulation. All simulated REDOR curves are two-spin distances, which reflect the vertical distance of the 13C to the 31P-containing membrane plane for distances within 7 – 9 Å 16.
Compared to Arg8, the hydrophobic residues all exhibit longer distances to 31P. Leu6 and Ile15 Cα are 7.5 Å from the 31P plane, while Val7 has an even longer Cα-P distance of 8.5±1.0 Å. These distances were obtained using two-spin REDOR simulations. For fast REDOR dephasing such as that of Arg8 Cζ, only one 31P atom can approach the peptide 13C closely due to the average 10 Å 31P-31P separation in the membrane plane. For slower REDOR dephasing that corresponds to a nominal two-spin distance of 7 Å or longer, multiple 31P atoms can interact with each 13C spin. In this case, we have previously shown by multi-spin REDOR simulations 16 that although the individual 13C-31P distances are longer than the nominal value obtained from two-spin simulations, the vertical distance between the 13C atom and the 31P plane, which is the relevant parameter for reporting membrane protein depths, approaches the nominal two-spin distance. Thus, the two-spin simulated distances here can be used to reflect the depth of the 13C spins to the membrane plane.
Val7 and Ile15 Cα signals overlap with the lipid glycerol G3 and G1 carbons, which have short distances to 31P. Thus, in the REDOR simulation, we corrected for the lipid intensity contribution using the equation (S/S0)observed = 0.76(S/S0)peptide + 0.12(S/S0)G1+ 0.12(S/S0)G3, where the coefficients were obtained from the lipid/peptide molar ratio, This natural-abundance correction was confirmed by a double-quantum filtered REDOR experiment 19 on the Val7 labeled S4 peptide, which removed the lipid 13C signals (Fig. S5). The resulting REDOR S/S0 value supports the natural-abundance corrected REDOR distance of 8.5 Å (Fig. 4c).
Discussion
The 13C isotropic chemical shifts indicate that most labeled residues in the S4 peptide exhibit the α-helical conformation in lipid bilayers 21, consistent with the conformation of this domain in the intact protein 4; 6. The only non-helical residue is the N-terminus Gly2, which is also consistent with the turn conformation of the corresponding Gly114 between S3b and S4 helices in the intact KvAP voltage sensor.
The 2D 15N anisotropic correlation spectra indicate that the S4 helix deviates significantly from the limiting cases of a fully TM orientation (τ = 0°) or a fully in-plane orientation (τ = 90°). Spectral simulations yielded a tilt angle of 40±5° and two ρ angles differing by 180° around the helix axis (Fig. 5). The data does not allow unambiguous determination of which ρ is adopted by the peptide, and it is possible that both are populated in the absence of other TM helices of the voltage sensor. Although not all residues of the peptide were 15N-labeled, the inclusion of residues 6 and 15 among the labeled sites suggests that the tilt angle is valid for the central majority of the helix. Additional simulations show that the best-fit spectrum agrees with the experimental spectra to within ±5° for the tilt angle (Fig. S1). It has been shown that PISA wheels are sensitive not only to helix orientation but also to backbone (ϕ, ψ) angles 32. Non-idealities greater than ±4° in the (ϕ, ψ) angles produce significant distortions in the PISA wheel pattern. For the orientation simulations, we used α-helical (ϕ, ψ) angles of (−64°, −40°), which are within the angular ranges predicted by TALOS for residues Val7 and Arg8 (Table S2). The good agreement between the best-fit and experimental spectra of the S4 peptide suggests that the conformation of the C-terminal half of the peptide, although only labeled at Ile15 in this study, does not differ significantly from the α-helical structure.
Figure 5.

Orientation of the S4 helix of Kv channels from NMR and crystal structures. (a, b) Solid-state NMR determined orientation of the isolated S4 helix in lipid bilayers. (a) τ = 40° and ρ = 280°. (b) τ = 40° and ρ = 100°. The four Arg sidechains and the Leu13 sidechain are shown as sticks. Cα atoms whose distances to lipid 31P were measured are shown as balls. (c, d) X-ray crystal structure of the voltage-sensing domain of the Kv2.1-Kv1.2 paddle-chimaera channel 6. (c) Side view with the pore axis oriented vertically. (d) Top view of the tetramer. The S4 helix is highlighted in red, and the S4-S5 linker is in orange. The three Arg residues corresponding to the second to fourth Arg’s in the NMR samples, and Leu298 (pink), corresponding to Leu13 of the NMR samples, are shown as sticks.
Interestingly, the crystal structure of the paddle-chimaera channel showed residues 297 to 306 to be a 310 helix. However, detailed examination of the conformation of membrane proteins in available crystal and solid-state NMR structures by Cross and coworkers suggests that the low dielectric and anhydrous environment of the lipid bilayer disfavors the formation of 310 helices, since 310 helices increase the exposure of the partial negative charge of the carbonyl oxygens to the lipid membrane compared to α-helices 32. Moreover, due to their significantly different (ϕ, ψ) angles, 310 helices have clearly different 2D 15N spectral patterns than the PISA wheels for α-helices 33 (Fig. S1). Additional 15N-labeling of the C-terminal residues will be useful for verifying the exact conformation of the C-terminal portion of the S4 peptide in the lipid bilayer.
To compare the NMR-determined orientation of the isolated S4 peptide with that in the intact voltage sensor, we show the 2.4 Å crystal structure of the voltage-sensing domain of the paddle-chimaera channel in Fig. 5c, d. The tetramer structure was taken from PDB (accession code: 2R9R) 6: the S4 helix and the S4-S5 linker helix were colored to guide the eye, and the pore helices S5 and S6 were removed from view for clarity. The crystal structure was solved using crystals grown in a mixture of detergents and phospholipids 6, where the S4 helix was that of the Kv2.1 potassium channel with a different amino acid sequence from the KvAP S4 sequence. However, the S3b-S4 voltage-sensor paddle has been shown to be transferrable among voltage sensors of different origins 34, and three of the four Arg residues are conserved between KvAP and Kv2.1, thus the S4 helix is expected to be comparable between the crystal structure construct and the NMR sample studied here. We extracted the tilt angle of the S4 helix by comparing the average N-H bond orientation of each helix with the orientation of the four-fold symmetry axis of the tetramer, and found the tilt angle to be 43° for all four helices.
Within experimental uncertainty, the NMR-determined 40±5° tilt angle of the isolated S4 peptide is identical to the 43° tilt of the S4 helix in the intact voltage sensor. Even more strikingly, Fig. 5 shows that one of the two NMR rotation angle solutions, ρ=100°, agrees very well with the sidechain directions of the S4 in the intact voltage sensor 6. Using the hydrophobic Leu13 between the third and fourth Arg (Arg11 and Arg14) as a point of reference, since the Leu rotameric state is relatively well defined 35, we found that the Leu13 sidechain in the isolated peptide has a similar orientation to the corresponding Leu298 in the intact voltage sensor. The remarkable similarities in τ and ρ angles indicate that the isolated S4 helix, bound to the lipid bilayer, already adopts its final orientation in the intact S1-S4 domain. This in turn suggests that the S4 structure in the membrane is mainly dictated by the lipid-protein interaction and the S4 amino acid sequence, and is only minimally affected by interactions with the other helices in the voltage sensor. In the crystal structure, the two C-terminal Arg’s of the S4 helix interact with glutamate residues in the S1 and S2 helices while the two N-terminal Arg’s interact mainly with lipid phosphates and water 6. The preservation of the S4 orientation in the absence of the acidic residues suggests that the two lipid-interacting Arg residues may be largely sufficient for determining the global topology of the membrane-bound S4 helix.
Since the S4 peptide is mostly hydrophobic, the non-Arg residues are not expected to interact significantly with the polar lipid headgroups. If the Arg residues were not present, we suspect that the peptide orientation will be less tilted, like the WALP peptides 36, to better match the thickness of the lipid bilayer. We speculate that the tendency of Arg residues to interact with the lipid phosphates and snorkel their sidechains to the membrane surface may be an important driving force for the observed tilted orientation of the S4 helix.
The short 4.6 Å distance between the Cζ of the second Arg and the lipid 31P provides the first direct distance constraint for Arg-phosphate interactions in the Kv voltage sensor. Since the guanidinium Cζ is surrounded by N-H groups while the 31P is surrounded by oxygen atoms, the 4.6 Å Cζ-P distance suggests N-H to O-P hydrogen bonding. This Arg-phosphate interaction is fully consistent with biochemical data that voltage gating is inhibited when the phosphate groups of lipids are enzymatically removed 13; 14. In either orientation of Fig. 5a, b, all four Arg residues can adopt well-populated rotamers to bring their sidechains towards the membrane surface 31P. For example, in the ρ=280° orientation, excellent Arg-headgroup contacts are established if Arg5, Arg8, Arg11 and Arg14 adopt the mtm-85, ttp180, tpt85 and tpt85 rotamers, respectively, where t, p, and m represent 180°, +60°, and −60° (Fig. 5a). For ρ=100°, guanidinium contacts with the membrane surfaces can be established if all four Arg’s adopt the mtt180 state, which is the second most populated Arg rotamer in α-helices 35 (Fig. 5b). Modeling shows that more than one rotameric state can allow guanidinium snorkeling to the bilayer surface. Indeed, the thermal disorder of the lipids and interactions with other helices of the voltage sensor may induce multiple rotamers for each Arg while still maintaining the salt bridge with the lipid phosphates.
The measured Cα - P distances confirm the implicit assumption of Fig. 5 that the S4 peptide is fully immersed in the lipid bilayer. Specifically, Ile15 has a similar Cα-P distance (7.5 Å) to Leu6 and Val7 Cα (7.5 and 8.5 Å), which are 8 and 9 residues apart. These distances rule out a half inserted model (Fig. S3), since the vertical separation between Ile15 and Leu6 Cα or between Ile15 and Val7 Cα is too short compared to the combined Cα-P distances of ~16 Å: the separation is 8-10 Å for ρ=100° and 12–13 Å for ρ=280°, which is 2-8 Å shorter than the sum of the Cα-P distances. Thus the S4 peptide must be fully inserted into the bilayer, in agreement with neutron diffraction data of deuterated S1-S4 domain in POPC/POPG bilayers 15. For the fully inserted helix, combining the Val7-Ile15 Cα-Cα vertical distance of 10 Å, the Val7 Cα-P distance of 8.5 Å, and the Ile15 Cα-P distance of 7.5 Å, we obtain a P-P separation of 26 Å between the two membrane planes (Fig. 6a). This distance is 9 Å shorter than the unperturbed DMPC/DMPG bilayer thickness of 35 Å 37. Thus, the distance and orientation data suggest that the DMPC/DMPG bilayer is thinned by about 9 Å at the site of S4 insertion. If residues Phe12 to Ile15 adopt the more extended 310 conformation rather than the α-helical conformation, then the vertical separation between Val7 and Ile15 Cα would increase to about 13 Å, which would still indicate membrane thinning, but by about 6 Å.
Figure 6.

Proposed membrane topology of the KvAP S4 peptide in lipid bilayers. (a) Orientation and depth of insertion of the peptide. S4 is fully inserted and causes a 9 Å thinning of the membrane at the site of peptide binding. (b) Helical wheel diagram of the S4 peptide, with hydrophobic residues in red and Arg’s in blue. The peptide has little amphiphilicity, supporting a TM motif.
Local thinning of phospholipid bilayers has been frequently observed before 38-41, and is often associated with the function of membrane-active peptides 42. Membrane thinning has also been seen in MD simulations of the S4 helix 10; 11. A thinning of 9 Å appears large at first. However, at the 1: 5 peptide/lipid mass ratio used in the NMR samples, the 9 Å local thinning translates to a modest ~2 Å thinning averaged over the entire membrane, which is in excellent agreement with neutron diffraction data of the S1-S4 domain 15. This membrane thinning is almost certainly driven by the Arg-phosphate attraction, similar to what has been reported for Arg-rich antimicrobial peptides and cell-penetrating peptides 16; 19. The membrane thinning would better allow the central two Arg’s, Arg8 and Arg11, to reach the membrane surfaces to establish guanidinium-phosphate contacts, further reducing the free energy of insertion.
How does the S4 amino acid sequence dictate the membrane-bound topology of the S4 helix? The helical wheel diagram (Fig. 6b) shows that the S4 peptide is actually quite hydrophobic despite the presence of four Arg residues, and lacks a clear polar/non-polar separation. The calculated hydrophobic moment (μH) of the peptide is only 2.0 43, which is comparable to the μH of hydrophobic membrane peptides such as the influenza A M2 TM domain 44. In contrast, surface-bound membrane peptides such as magainin-2 and melittin have much higher μH values of 5-7. Thus, a TM topology of the S4 helix is actually not so surprising. Its significant tilt angle allows the four Arg residues to reach the membrane surface more readily than a helix that is completely parallel to the bilayer normal, since the latter backbone may cause steric conflicts with the Arg sidechains.
The fact that the isolated S4 peptide adopts the same orientation as in the intact voltage-sensing domain suggests that S4 interactions with acidic residues in the rest of the voltage-sensing domain may not affect the global structural topology of this domain in the membrane, even though they may influence local structural features such as the sidechain conformations. Phospholipids and the intrinsic amino acid sequence appear to be sufficient for determining the membrane-bound orientation and depth of this important gating helix. The NMR data here thus supports the model that the paddle directly interacts with the lipid bilayer during channel activation and deactivation. Perhaps it is not so surprising that the helix carrying the gating residues of the Kv channels has an intrinsic orientation that is not easily perturbed by the rest of the protein. The Kv voltage-sensing domain may have evolved to preserve the core structure and function of the S4 helix, making it dependent on the ubiquitous and less variable phospholipids of the cell membrane rather than the easily mutated protein residues.
Materials and Methods
Peptide and lipids
The segment corresponding to residues 113–130 of the voltage-sensing domain of KvAP, which is an archaebacterial Kv channel from Aeropyrum pernix, was synthesized and purified using Fmoc chemistry (PrimmBiotech, Cambridge, MA). The amino acid sequence is LGLFRLVRLL RFLRILLI. The corresponding amino acid sequence of the Kv2.1 segment in the paddle-chimaera crystal structure is residues 286-303 --VVQIFRIM RILIRFKL 6, where the first two residues of the KvAP S4 peptide does not match any residues in the chimaera sequence. Except for the first Arg, the second to fourth Arg residues were conserved between the two sequences. Four KvAP S4 peptides were synthesized, incorporating a total of six 13C, 15N-labeled residues: Gly2, Leu6, Val7, Arg8, Leu9 and Ile15. The four samples were Gly2, Leu6, Ile15-labeled S4, Val7, Leu9-labeled S4, Val7, Arg8-labeled S4, and Leu6, Ile15-labeled S4.
DMPC (1,2-dimyristoyl-sn-glycero-3-phosphochloline), DMPG (1,2-dimyristoyl-sn-glycero-3-phosphatidylglycerol), and 6-O-PC (1,2-di-O-hexyl-sn-glycero-3-phosphocholine) were purchased from Avanti Polar Lipids.
Unoriented and oriented membrane samples
Unoriented hydrated proteoliposomes were prepared by mixing the peptide and lipids in organic solvents (3 : 1 chloroform : methanol) or in aqueous solution. A DMPC: DMPG (3 : 1) lipid mixture and a peptide/lipid molar ratio of 1:16 were used for all unoriented samples for magic-angle-spinning (MAS) experiments. For organic-solvent mixed samples, the peptide-lipid mixture were lyophilized and rehydrated to 35 wt% using a 10 mM pH 7 phosphate buffer. For the aqueous-phase mixed samples, the peptide was dissolved in 2 mL of 30-60 mg/mL octyl-β-glucoside (OG) solution, mixed with the lipid vesicle solution at pH 7, then dialyzed against the buffer for 3 days to remove the detergent 45. The proteoliposome solution was centrifuged at 150,000 g at 6 °C to yield a homogeneous pellet. Excess water was removed by vacuum drying and the powder was then rehydrated to 35% water for MAS experiments.
Oriented DMPC/6-O-PC bicelles containing the peptide were prepared as described before 46-49. The lipid mixture was suspended in a 25 mM pH 7 HEPES buffer to make a 35% (w/v) solution. The mixture was thermocycled between 0 and 42°C three times and incubated at 4°C overnight. The resulting homogenous solution was viscous at 42°C but fluid at 0°C, characteristic of bicelles. The degree of alignment of the bicelle in the magnetic field was examined by 31P NMR. 2.5 mg of KvAP S4 was mixed with 75 μL of the bicelle solution, subjected to several thermocycles, and incubated at 4°C until a homogenous solution was obtained.
Solid-State NMR experiments
Magic-angle-spinning experiments were carried out on a Bruker DSX-400 (9.4 Tesla) spectrometer at Larmor frequencies of 100.70 MHz for 13C and 162.1 MHz for 31P, using a triple-resonance 4 mm MAS probe. 13C and 31P chemical shifts were referenced to the α-glycine CO resonance at 176.49 ppm on the TMS scale and the hydroxyapatite 31P signal at 2.73 ppm on the phosphoric acid scale. Conformation-dependent 13C chemical shifts were measured using 2D 13C-13C DARR correlation experiments and a double-quantum (DQ) filtered experiment 50 that removed the lipid 13C signals. The 2D experiments were conducted at 233-263 K under moderate spinning rates of 5.0 and 5.5 kHz. Low temperatures were achieved using a Kinetics Thermal Systems XR air-jet sample cooler (Stone Ridge, NY). Thermocouple-indicated temperatures were reported here. The actual sample temperature for both the moderate spinning MAS experiments and the static bicelle experiments is expected to be within 1-2°C of the reported value.
A frequency-selective REDOR experiment 51; 52 was used to measure peptide-lipid 13C-31P distances. A selective 13C Gaussian pulse (0.8 – 1.0 ms) in the center of the REDOR period removed 13C-13C J couplings in the uniformly 13C-labeled residues, thus allowing 13C-31P REDOR effects to be observed at long mixing times. The experiments were carried out at 228 K, well below the phase transition temperature of the DMPC/DMPG membrane, to freeze lipid and peptide motions. Spinning speeds of 4.0 to 5.5 kHz were used for the REDOR experiments.
Static 31P and 15N NMR spectra for orientation determination were measured on a 600 MHz spectrometer (14.1 Tesla). The static probe contained a solenoid coil whose axis is perpendicular to the magnetic field. 15N chemical shifts were externally referenced to the N-acetylvaline signal at 122 ppm on the NH3 scale, and 31P chemical shifts were referenced to 85% H3PO4 at 0 ppm. The sample temperature was carefully chosen between 302 and 310 K to optimize bicelle alignment. For the 2D 1H-15N dipolar-chemical-shift correlation (DIPSHIFT) experiment 22, the N-H evolution period followed the 1H-15N cross polarization (CP), and 1H-1H homonuclear decoupling was achieved using the FSLG sequence 53, whose scaling factor was directly measured on model compounds to be 0.54. During 15N detection, 13C decoupling at 5 kHz removed the one-bond 15N-13C dipolar coupling. This 2D experiment differs from the PISEMA experiment in the way the 15N magnetization evolves during t1, but produces the same 2D spectral patterns as the PISEMA experiment 54. Similar to PISEMA spectra, the static 2D DIPSHIFT spectra were plotted to show only half of the symmetric dipolar dimension, and simulated PISA wheels that cross over to the other half of the dipolar dimension were reflected back to the unique half.
Orientation calculation
Orientation-dependent 2D N-H/15N correlation spectra were calculated for an ideal α-helix with (ϕ, ψ) = (−64°, −40°) as described before 22. Briefly, we defined a molecule-fixed frame whose z-axis was the helix axis, which was calculated as the average N-H vector orientation of 18 residues of the peptide. The y-z plane was defined as the common plane containing the helix axis and the CO-N vector between residues Leu3 and Phe4. The tilt angle τ was the angle between the helix axis and the bilayer normal, while the rotation angle ρ was the angle between the bilayer normal and the y-z plane of the molecular frame. ρ = 0° corresponds to the case when the bilayer normal lies in the y-z plane. In the Rose convention of Euler angles Ω(α, β, γ), the rotation angle, which is uniquely determined by the protein sequence, corresponds to the azimuthal angle α 55; 56 of the bilayer normal in the molecule-fixed frame. It differs from the azimuthal angle γ of the helix axis in a bilayer-fixed frame. The angle γ generally assumes all values, but for oriented samples whose alignment axis is parallel to the magnetic field, the NMR frequency is independent of γ. For oriented samples whose alignment axis is not coincident with the magnetic field, the different γ angles will lead to different anisotropic frequencies. However, bicelles undergo fast uniaxial rotation around the bicelle normal, thus averaging the γ angle and making the frequency only dependent on the tilt angle τ (=β) and the rotation angle ρ (=α).
We simulated 2D spectra for τ between 0° and 90° in 5° steps and ρ between 0° and 360° in 20° steps. To obtain the best-fit orientation angles, we minimized the root-mean-square deviation (RMSD) between the calculated and experimental 2D spectra using 22:
| (1) |
where the maximum N-H coupling and 15N chemical shift anisotropy (CSA) are:
| (2) |
| (3) |
In the above equations, we used a rigid-limit N-H coupling of 10.0 kHz, 15N z-principal value of 227 ppm, and an 15N isotropic shift δiso of 122 ppm. The factor of −0.5 is due to the 90° orientation of the bicelle axis from the magnetic field. The factor of 0.8 accounts for the wobble of the bicelle axis, and was estimated from the 31P CSA of the bicelles, which was 82-88% of the 31P CSA of lipid bilayers (Table S3) 47; 57; 58. This value was confirmed by simulations of the measured 2D 15N spectra (Fig. S4). The scaling factor of 0.54 accounts for the homonuclear decoupling sequence of FSLG.
To visualize the peptide orientation, we affixed the best-fit bilayer normal to the molecule-fixed coordinate system defined above. The assembly of the peptide and the Cartesian system was then rotated such that the bilayer normal is vertical on the screen. The bilayer normal coordinates were inputted as (x = rsinθcosϕ, y = rsinθsinϕ,z = rcosθ), where θ = τ and ϕ = ρ+90°.
To extract the orientation of the S4 helix in the crystal structure of the paddle-chimaera channel, we calculated the S4 helix axis as the average N-H bond orientation for eleven consecutive residues from 286 to 296. The choice of eleven residues was to complete three turns of the α-helix while not involving residues in the 310 helix (from residue 297). Since the tetramer is symmetric, the channel axis orientation was the average orientation of the four S4 helix axes. The scalar product between the channel axis and each S4 helix axis gives the tilt angle.
Supplementary Material
Acknowledgement
T. D. is the grateful recipient of a Roy J. Carver Trust pre-doctoral training fellowship. This work is supported by NIH grant GM-066976.
Footnotes
Publisher's Disclaimer: This is a PDF file of an unedited manuscript that has been accepted for publication. As a service to our customers we are providing this early version of the manuscript. The manuscript will undergo copyediting, typesetting, and review of the resulting proof before it is published in its final citable form. Please note that during the production process errors may be discovered which could affect the content, and all legal disclaimers that apply to the journal pertain.
Supplementary Material
Additional simulated 2D 15N spectra, 13C isotropic chemical shifts of the peptide, 31P chemical shifts of the bicelles, and additional REDOR spectra are provided.
References
- 1.Borjesson SI, Elinder F. Structure, Function, and Modification of the Voltage Sensor in Voltage-Gated Ion Channels. Cell Biochem. Biophys. 2008;52:149–174. doi: 10.1007/s12013-008-9032-5. [DOI] [PubMed] [Google Scholar]
- 2.Swartz KJ. Sensing voltage across lipid membranes. Nature. 2008;456:891–897. doi: 10.1038/nature07620. [DOI] [PMC free article] [PubMed] [Google Scholar]
- 3.Seoh SA, Sigg D, Papazian DM, Bezanilla F. Voltage-sensing residues in the S2 and S4 segments of the Shaker K+ channel. Neuron. 1996;16:1159–1167. doi: 10.1016/s0896-6273(00)80142-7. [DOI] [PubMed] [Google Scholar]
- 4.Jiang Y, Lee A, Chen J, Ruta V, Cadene M, Chait BT, MacKinnon R. X-ray Structure of a Voltage Dependent K+ Channel. Nature. 2003;423:33–41. doi: 10.1038/nature01580. [DOI] [PubMed] [Google Scholar]
- 5.Jiang Y, Ruta V, Chen J, Lee A, MacKinnon R. The Principle of Gating Charge Movement in a Voltage-Dependent K+ Channel. Nature. 2003;423:42–48. doi: 10.1038/nature01581. [DOI] [PubMed] [Google Scholar]
- 6.Long SB, Tao X, Campbell EB, MacKinnon R. Atomic Structure of a Voltage-Dependent K+ Channel in a Lipid Membrane-Like Environment. Nature. 2007;450:376–383. doi: 10.1038/nature06265. [DOI] [PubMed] [Google Scholar]
- 7.Ruta V, Chen J, MacKinnon R. Calibrated measurement of gating-charge arginine displacement in the KvAP voltage-dependent K+ channel. Cell. 2005;123:463–475. doi: 10.1016/j.cell.2005.08.041. [DOI] [PubMed] [Google Scholar]
- 8.Hessa T, Kim H, Bihlmaier K, Lundin C, Boekel J, Andersson H, Nilsson I, White SH, von Heijne G. Recognition of transmembrane helices by the endoplasmic reticulum translocon. Nature. 2005;433:377–81. doi: 10.1038/nature03216. [DOI] [PubMed] [Google Scholar]
- 9.Cuello LG, Cortes DM, Perozo E. Molecular Architecture of the KvAP Voltage-Dependent K+ Channel in a Lipid Bilayer. Science. 2004;306:491–495. doi: 10.1126/science.1101373. [DOI] [PubMed] [Google Scholar]
- 10.Freites JA, Tobias DJ, von Heijne G, White SH. Interface Connections of a Transmembrane Voltage Sensor. Proc. Natl. Acad. Sci. U. S. A. 2005;102:15059–15064. doi: 10.1073/pnas.0507618102. [DOI] [PMC free article] [PubMed] [Google Scholar]
- 11.Sands ZA, Sansom MSP. How Does a Voltage Sensor Interact with a Lipid Bilayer? Simulations of a Potassium Channel Domain. Structure. 2007;15:235–244. doi: 10.1016/j.str.2007.01.004. [DOI] [PMC free article] [PubMed] [Google Scholar]
- 12.Jogini V, Roux B. Dynamics of the Kv1.2 voltage-gated K+ channel in a membrane environment. Biophys. J. 2007;93:3070–3082. doi: 10.1529/biophysj.107.112540. [DOI] [PMC free article] [PubMed] [Google Scholar]
- 13.Schmidt D, Jiang Q, MacKinnon R. Phospholipids and the Origin of Cationic Gating Charges in Voltage Sensors. Nature. 2006;444:775–779. doi: 10.1038/nature05416. [DOI] [PubMed] [Google Scholar]
- 14.Xu Y, Ramu Y, Lu Z. Removal of phospho-head groups of membrane lipids immobilizes voltage sensors of K+ channels. Nature. 2008;451:826–829. doi: 10.1038/nature06618. [DOI] [PMC free article] [PubMed] [Google Scholar]
- 15.Krepkiy D, Mihailescu M, Freites JA, Schow EV, Worcester DL, Gawrisch K, Tobias DJ, White SH, Swartz KJ. Structure and hydration of membranes embedded with voltage-sensing domains. Nature. 2009;462:473–479. doi: 10.1038/nature08542. [DOI] [PMC free article] [PubMed] [Google Scholar]
- 16.Tang M, Waring AJ, Hong M. Phosphate-Mediated Arginine Insertion Into Lipid Membranes and Pore Formation by a Cationic Membrane Peptide from Solid-State NMR. J. Am. Chem. Soc. 2007;129:11438–11446. doi: 10.1021/ja072511s. [DOI] [PubMed] [Google Scholar]
- 17.Tang M, Waring AJ, Lehrer RI, Hong M. Effects of Guanidinium-Phosphate Hydrogen Bonding on the Membrane-Bound Structure and Activity of an Arginine-Rich Membrane Peptide from Solid-State NMR. Angew. Chem. Int. Ed. Engl. 2008;47:3202–3205. doi: 10.1002/anie.200705993. [DOI] [PubMed] [Google Scholar]
- 18.Su Y, Mani R, Hong M. Asymmetric Insertion of Membrane Proteins in Lipid Bilayers by Solid-State NMR Paramagnetic Relaxation Enhancement: a Cell-Penetrating Peptide Example. J. Am. Chem. Soc. 2008;130:8856–8864. doi: 10.1021/ja802383t. [DOI] [PMC free article] [PubMed] [Google Scholar]
- 19.Su Y, Doherty T, Waring AJ, Ruchala P, Hong M. Roles of arginine and lysine residues in the translocation of a cell-penetrating peptide from (13)C, (31)P, and (19)F solid-state NMR. Biochemistry. 2009;48:4587–4595. doi: 10.1021/bi900080d. [DOI] [PMC free article] [PubMed] [Google Scholar]
- 20.Takegoshi K, Nakamura S, Terao T. C-13-H-1 dipolar-assisted rotational resonance in magic-angle spinning NMR. Chem. Phys. Lett. 2001;344:631–637. [Google Scholar]
- 21.Wang Y, Jardetzky O. Probability-based protein secondary structure identification using combined NMR chemical-shift data. Protein Sci. 2002;11:852–861. doi: 10.1110/ps.3180102. [DOI] [PMC free article] [PubMed] [Google Scholar]
- 22.Tang M, Waring A, Lehrer R, Hong M. Orientation of a Beta-Hairpin Antimicrobial Peptide in Lipid Bilayers from Two-Dimensional Dipolar Chemical-Shift Correlation NMR. Biophys. J. 2006;90:3616–3624. doi: 10.1529/biophysj.105.062075. [DOI] [PMC free article] [PubMed] [Google Scholar]
- 23.Marassi FM, Opella SJ. A Solid-State NMR Index of Helical Membrane Protein Structure and Topology. J. Magn. Reson. 2000;144:150–155. doi: 10.1006/jmre.2000.2035. [DOI] [PMC free article] [PubMed] [Google Scholar]
- 24.Wang J, Denny J, Tian C, Kim S, Mo Y, Kovacs F, Song Z, Nishimura K, Gan Z, Fu R, Quine JR, Cross TA. Imaging membrane protein helical wheels. J. Magn. Reson. 2000;144:162–167. doi: 10.1006/jmre.2000.2037. [DOI] [PubMed] [Google Scholar]
- 25.Hu J, Asbury T, Achuthan S, Li C, Bertram R, Quine JR, Fu R, Cross TA. Backbone structure of the amantadine-blocked trans-membrane domain M2 proton channel from Influenza A virus. Biophys. J. 2007;92:4335–4343. doi: 10.1529/biophysj.106.090183. [DOI] [PMC free article] [PubMed] [Google Scholar]
- 26.Li C, Qin H, Gao FP, Cross TA. Solid-state NMR characterization of conformational plasticity within the transmembrane domain of the influenza A M2 proton channel. Biochim. Biophys. Acta. 2007;1768:3162–3170. doi: 10.1016/j.bbamem.2007.08.025. [DOI] [PMC free article] [PubMed] [Google Scholar]
- 27.Wang J, Kim S, Kovacs F, Cross TA. Structure of the the transmembrane region of the M2 protein H+ channel. Prot. Sci. 2001;10:2241–2250. doi: 10.1110/ps.17901. [DOI] [PMC free article] [PubMed] [Google Scholar]
- 28.Park SH, Mrse AA, Nevzorov AA, Mesleh MF, Oblatt-Montal M, Montal M, Opella SJ. Three-dimensional structure of the channel-forming trans-membrane domain of virus protein “u” (Vpu) from HIV-1. J. Mol. Biol. 2003;333:409–424. doi: 10.1016/j.jmb.2003.08.048. [DOI] [PubMed] [Google Scholar]
- 29.Thiriot DS, Nevzorov AA, Zagyanskiy L, Wu CH, Opella SJ. Structure of the coat protein in Pf1 bacteriophage determined by solid-state NMR spectroscopy. J. Mol. Biol. 2004;341:869–879. doi: 10.1016/j.jmb.2004.06.038. [DOI] [PubMed] [Google Scholar]
- 30.Zeri AC, Mesleh MF, Nevzorov AA, Opella SJ. Structure of the coat protein in fd filamentous bacteriophage particles determined by solid-state NMR spectroscopy. Proc. Natl. Acad. Sci. U. S. A. 2003;100:6458–6463. doi: 10.1073/pnas.1132059100. [DOI] [PMC free article] [PubMed] [Google Scholar]
- 31.Segrest JP, De Loof H, Dohlman JG, Brouillette CG, Anantharamaiah GM. Amphipathic helix motif: classes and properties. Proteins. 1990;8:103–17. doi: 10.1002/prot.340080202. [DOI] [PubMed] [Google Scholar]
- 32.Page RC, Kim S, Cross TA. Transmembrane helix uniformity examined by spectral mapping of torsion angles. Structure. 2008;16:787–797. doi: 10.1016/j.str.2008.02.018. [DOI] [PMC free article] [PubMed] [Google Scholar]
- 33.Kim S, Cross TA. 2D Solid-State NMR Spectral Simulation of 310, a, and p-helices. J. Magn. Reson. 2004;168:187–193. doi: 10.1016/j.jmr.2004.02.009. [DOI] [PubMed] [Google Scholar]
- 34.Alabi AA, Bahamonde MI, Jung HJ, Kim JI, Swartz KJ. Portability of paddle motif function and pharmacology in voltage sensors. Nature. 2007;450:370–375. doi: 10.1038/nature06266. [DOI] [PMC free article] [PubMed] [Google Scholar]
- 35.Lovell SC, Word JM, Richardson JS, Richardson DC. The Penultimate Rotomer Library. Proteins: Struct., Funct., Genet. 2000;40:389–408. [PubMed] [Google Scholar]
- 36.Strandberg E, Morein S, Rijkers DTS, Liskamp RMJ, vanderWel PCA, Killian JA. Lipid dependence of membrane anchoring properties and snorkeling behavior of aromatic and charged residues in transmembrane peptides. Biochemistry. 2002;41:7190–7198. doi: 10.1021/bi012047i. [DOI] [PubMed] [Google Scholar]
- 37.Kucerka N, Liu Y, Chu N, Petrache HI, Tristram-Nagle S, Nagle JF. Structure of fully hydrated fluid phase DMPC and DLPC lipid bilayers using X-ray scattering from oriented multilamellar arrays and from unilamellar vesicles. Biophys. J. 2005;88:2626–2637. doi: 10.1529/biophysj.104.056606. [DOI] [PMC free article] [PubMed] [Google Scholar]
- 38.Heller WT, Waring AJ, Lehrer RI, Harroun TA, Weiss TM, Yang L, Huang HW. Membrane-thinning effect of the b-sheet antimicrobial protegrin. Biochemistry. 2000;39:139–145. doi: 10.1021/bi991892m. [DOI] [PubMed] [Google Scholar]
- 39.Yamaguchi S, Huster D, Waring A, Lehrer RI, Tack BF, Kearney W, Hong M. Orientation and Dynamics of an Antimicrobial Peptide in the Lipid Bilayer by Solid-State NMR. Biophys. J. 2001;81:2203–2214. doi: 10.1016/S0006-3495(01)75868-7. [DOI] [PMC free article] [PubMed] [Google Scholar]
- 40.Buffy J, Hong T, Yamaguchi S, Waring A, Lehrer R, Hong M. Solid-State NMR Investigation of the Depth of Insertion of Protegrin-1 in Lipid Bilayers Using Paramagnetic Mn2+ Biophys. J. 2003;85:2363–2373. doi: 10.1016/s0006-3495(03)74660-8. [DOI] [PMC free article] [PubMed] [Google Scholar]
- 41.Mecke A, Lee DK, Ramamoorthy A, Orr BG, Banaszak Holl MM. Membrane thinning due to antimicrobial peptide binding: an atomic force microscopy study of MSI-78 in lipid bilayers. Biophys. J. 2005;89:4043–4050. doi: 10.1529/biophysj.105.062596. [DOI] [PMC free article] [PubMed] [Google Scholar]
- 42.Huang HW. Molecular mechanism of antimicrobial peptides: the origin of cooperativity. Biochim. Biophys. Acta. 2006;1758:1292–1302. doi: 10.1016/j.bbamem.2006.02.001. [DOI] [PubMed] [Google Scholar]
- 43.Jaysinghe S, Hristova K, Wimley W, Snider C, White SH. 2008 http://blanco.biomol.uci.edu/mpex.
- 44.Cady SD, Luo WB, Hu F, Hong M. Structure and function of the influenza M2 proton channel. Biochemistry. 2009;48:7356–7364. doi: 10.1021/bi9008837. [DOI] [PMC free article] [PubMed] [Google Scholar]
- 45.Luo W, Mani R, Hong M. Side-Chain Conformation of the M2 Transmembrane Peptide Proton Channel of Influenza A Virus from 19F Solid-State NMR. 2007. [DOI] [PubMed] [Google Scholar]
- 46.DeAngelis A, Opella S. Bicelle samples for solid-state NMR of membrane proteins. Nature Protocols. 2007;2:2332–2338. doi: 10.1038/nprot.2007.329. [DOI] [PubMed] [Google Scholar]
- 47.Marcotte I, Auger M. Bicelles as Model Membranes for Solid-State and Solution-State NMR Studies of Membrane Peptides and Proteins. Concept Magn. Reson. A. 2005;24a:17–37. [Google Scholar]
- 48.Prosser RS, Evanics F, Kitevski JL, Al-Abdul-Wahid MS. Current applications of bicelles in NMR studies of membrane-associated amphiphiles and proteins. Biochemistry. 2006;45:8453–8465. doi: 10.1021/bi060615u. [DOI] [PubMed] [Google Scholar]
- 49.Aussenac F, Lavigne B, Dufourc E. Toward bicelle stability with ether-linked phospholipids: temperature, composition, and hydration diagrams by 2H and 31P solid-state NMR. Langmuir. 2005;21:7129–7135. doi: 10.1021/la050243a. [DOI] [PubMed] [Google Scholar]
- 50.Hohwy M, Jakobsen HJ, Eden M, Levitt MH, Nielsen NC. Broadband dipolar recoupling in the nuclear magnetic resonance of rotating solids: a compensated C7 pulse sequence. J. Chem. Phys. 1998;108:2686–2694. [Google Scholar]
- 51.Gullion T, Schaefer J. Rotational Echo Double Resonance NMR. J. Magn. Reson. 1989;81:196–200. doi: 10.1016/j.jmr.2011.09.003. [DOI] [PubMed] [Google Scholar]
- 52.Jaroniec CM, Tounge BA, Rienstra CM, Herzfeld J, Griffin RG. Measurement of C-13-N-15 Distances in Uniformly C-13 Labeled Biomolecules: J-Decoupled REDOR. J. Am. Chem. Soc. 1999;121:10237–10238. [Google Scholar]
- 53.Bielecki A, Kolbert AC, de Groot HJM, Griffin RG, Levitt MH. Frequency-switched Lee-Goldberg sequences in solids. Advances in Magnetic Resonance. 1990;14:111–124. [Google Scholar]
- 54.Wu CH, Ramamoorthy A, Opella SJ. High-resolution heteronuclear dipolar solid-state NMR spectroscopy. J. Magn. Reson. 1994;109:270–272. [Google Scholar]
- 55.Schmidt-Rohr K, Spiess HW. Multidimensional Solid-State NMR and Polymers. 1st edit Academic Press; San Diego: 1994. [Google Scholar]
- 56.Rose ME. Elementary Theory of Angular Momentum. Wiley; New York: 1957. [Google Scholar]
- 57.Park S, DeAngelis A, Nevzorov A, Wu C, Opella S. Three-Dimensional Structure of the Transmembrane Domain of Vpu from HIV-1 in Aligned Phospholipid Bicelles. Biophys. J. 2006;91:3032–3042. doi: 10.1529/biophysj.106.087106. [DOI] [PMC free article] [PubMed] [Google Scholar]
- 58.DeAngelis A, Howell S, Nevzorov A, Opella S. Structure Determination of a Membrane Protein with Two Trans-membrane Helicies in Aligned Phospholipid Bicelles by Solid-State NMR Spectroscopy. J. Am. Chem. Soc. 2006;128:12256–12267. doi: 10.1021/ja063640w. [DOI] [PMC free article] [PubMed] [Google Scholar]
Associated Data
This section collects any data citations, data availability statements, or supplementary materials included in this article.