

Summary
Background
Receptors that couple to Gi and Gq often interact synergistically in cells to elicit cytosolic Ca2+ transients that are several-fold higher than the sum of those driven by each receptor alone. Such synergism is commonly assumed to be complex, requiring regulatory interaction between components, multiple pathways, or multiple states of the target protein.
Results
We show that cellular Gi-Gq synergism derives from direct supra-additive stimulation of phospholipase C-β3 (PLC-β3) by G protein subunits Gβγ and Gαq, the relevant components of the Gi and Gq signaling pathways. No additional pathway or proteins are required. Synergism is quantitatively explained by the classical and simple two-state (inactive↔active) allosteric mechanism. We show generally that synergistic activation of a two-state enzyme reflects enhanced conversion to the active state when both ligands are bound, not merely the enhancement of ligand affinity predicted by positive cooperativity. The two-state mechanism also explains why synergism is unique to PLC-β3 among the four PLC-β isoforms and, in general, why one enzyme may respond synergistically to two activators while another does not. Expression of synergism demands that an enzyme display low basal activity in the absence of ligand and becomes significant only when basal activity is ≤ 0.1% of maximal.
Conclusions
Synergism can be explained by a simple and general mechanism, and such a mechanism sets parameters for its occurrence. Any two-state enzyme is predicted to respond synergistically to multiple activating ligands if, but only if, its basal activity is strongly suppressed.
Introduction
Cells integrate multiple incoming signals, and a response to one signal can depend upon the presence or intensity of others. Most often, acute responses to multiple signals are simply additive, either positively or negatively. Occasionally, however, the response to simultaneous stimuli is markedly greater than the sum of the responses to each stimulus alone. Such superadditive responses may be quantitatively modest, but marked synergism can essentially create a Boolean AND gate, or coincidence detector, with which a cell responds significantly only when two signals are present simultaneously. Superadditive responses are not frequent. In a recent large-scale screen for signaling interactions in macrophages, only about 1.5% of the ligand pairs that were tested displayed significant synergism [1]. In some cases, mechanisms of cellular synergism are well understood. These include multiple phosphorylation events, coactivation by transcription factors, induction of synthesis of subsequently regulated proteins, etc. Positively cooperative binding of activating ligands can also create apparent synergism over a narrow range of concentrations as each ligand increases the affinity of the other [2-4]. Scaffolding proteins and membrane surfaces potentiate signals essentially by this mechanism [5-7]. For many acute superadditive cellular responses, however, mechanisms of synergism involve multiple signaling pathways, are otherwise complex [8, 9], or are unknown.
Here we use phospholipase C-β3 (PLC-β3) to elucidate general mechanisms for creating synergism through allosteric regulation, and we show that PLC-β3 regulation accounts for a well-known set of superadditive responses in diverse cells. It has been known for about 15 years that many animal cells and primary cell lines display synergistic Ca2+ responses to simultaneous inputs from different G protein-coupled receptors [10-19]. In these cells, synergism serves as a coincidence detector, such that a robust Ca2+ response and downstream physiological regulation are only observed when both G protein pathways are activated. Such synergism is physiologically important in platelets, neurons, and macrophages [10, 13, 14, 16] and is suggested to play a role in stimulation of mitogenesis in multiple cell types [20]. In most of these cases, one of the two receptors activates Gq and the other activates Gi, and synergism does not depend on which Gi- or Gq-coupled receptor initiates the signals. Gq and Gi both activate PLC-β isoforms, and the PLC reaction product, inositol-trisphosphate (IP3), triggers Ca2+ release from the endoplasmic reticulum to the cytosol [21]. Gq stimulates PLC-β via its Gαq subunit, and Gi acts via its Gβγ subunit [21]. Several studies suggested that the mechanism of synergistic Ca2+ signaling directly involves PLC activation [10, 12, 16-19, 22-24], and recent studies in macrophages and a macrophage-like cell line argue that synergistic stimulation of Ca2+ signaling primarily requires the PLC-β3 isoform [10]. However, other work suggested that cellular Gi-Gq synergism involves interaction between the G proteins [25] or the IP3 receptor [26], and its biochemical mechanism remained unknown.
We show here that purified PLC-β3 responds synergistically to stimulation by Gαq and Gβγ. Synergistic activation of PLC-β3 can exceed ten times the sum of the responses to the individual G protein subunits. Gβγ-Gαq synergism on PLC-β3 can thus quantitatively account for synergistic Ca2+ responses to Gi and Gq in cells, and its biochemical behavior is qualitatively consistent with cellular events. Additional proteins or pathways are not required.
We also show that the synergistic response of PLC-β3 to Gαq and Gβγ can be explained quantitatively by a simple and classical two-state allosteric model. Synergism does not merely reflect positively cooperative effects of each subunit on the binding affinity of the other, but results from increased accumulation of the active form of PLC-β3. Synergism occur seven when both Gαq and Gβγ are tested at saturating concentrations.
The other PLC-β isoforms do not mediate synergistic Ca2+ responses in cells [10] or display synergism in vitro, even though they are structurally homologous to PLC-β3 and respond similarly to individual G proteins [21].
In general, why does one enzyme respond synergistically to two activators while another does not? We show by modeling and by analysis of PLC-β regulation that a superadditive response by a single enzyme primarily depends on its having very low activity in the absence of stimulating ligand. Maximal attainable synergism by a simple two-state enzyme is approximately proportional to its intrinsic bias for the inactive state. A two-state enzyme whose intrinsic activation is ≥ 1% of maximal cannot display more than two-fold synergism, and it can do so only with ligands that are fortuitously matched in their efficacies and that are at near perfect concentrations. In contrast, an enzyme with intrinsic activity ≤ 0.1% will display synergism to most activators and will do so over a broad range of activator concentrations. Thus any allosteric enzyme with a large dynamic range of regulation will display a synergistic response to two or more activating ligands. Synergism, which is widely assumed to be a complex phenomenon requiring ligand-ligand interactions or multiple activity states, can be described by a simple two-state allosteric equilibrium.
Results
Gαq and Gβγ Stimulate PLC-β3 Superadditively
In many cells, simultaneous stimulation of receptors coupled to Gi and Gq produces a cytosolic Ca2+ transient that is much larger than the sum of the those elicited by the individual receptors. The Ca2+ signal presumably results from Ca2+ release from endoplasmic reticulum, which is triggered by IP3 that is produced by the activity of PLC-β. To see whether the synergistic Ca2+ response in cells reflects direct synergistic activation of PLC-β3 by Gβγ and Gαq, we measured the activity of purified PLC-β3 at increasing concentrations of GTPγS-activated Gαq and in the presence or absence of Gβ1γ2 (Figure 1A). Together, Gαq and Gβγ stimulated PLC-β3 to an activity nearly ten times the sum of the activities elicited by the two subunits added separately. We define “synergism” generally by this ratio: the activity of an enzyme or signaling pathway in the presence of two regulatory ligands (a and b) divided by the sum of the activities elicited by each ligand (a or b) alone (Equation 1).
| (1) |
Figure 1.

Synergistic Activation of PLC-β3 by Gαq and Gβγ
(A) PLC-β3 activity was assayed at 60 nM [Ca2+] with increasing concentrations of Gαq in the absence (open circles) or presence of 6 nM Gβγ (closed circles). The synergism ratio, the ratio of activities in the presence of both Gαq and Gβγ to the sum of the activities in the presence of each subunit alone, is given at each Gαq concentration.
(B) Gαq-Gβγ synergism is independent of [Ca2+]. Lower panel: PLC-β3 activity was assayed at various Ca2+ concentrations in the presence of 30 nM Gβγ (black triangles), 0.2 nM Gαq (white circles), or both 0.2 nM Gαq and 30 nM Gβγ (black circles). Basal activity in the absence of G protein subunits was also assayed, and is shown multiplied by 10 to distinguish it from baseline (open triangles). Zero Ca2+ represents 5 mM EGTA with no added Ca2+. Upper panel: synergism ratios at each Ca2+ concentration. The ratio at zero Ca2+ is not accurate because of relative errors in assaying such low activities. The range of activities in this experiment is greater than 2000-fold. The maximum activity shown for the combination of Gαq and Gβγ (both) is about one-third that in the presence of an optimal concentration of Gβγ. Error bars show standard deviation (SD).
If two activities are merely additive, the ratio will be 1.0. Synergism is described by a ratio substantially above 1, and ratios above 10 approach an intuitive definition of coincidence detection.
By this definition, synergism between Gαq and Gβγ occurred over a wide range of Gαq concentrations, from 0.03 nM to 9 nM, which approaches saturation. The extent of direct Gαq-Gβγ synergism on PLC-β3 can thus readily account for the 2- to 6-fold synergistic responses of cellular IP3-Ca2+ pathways that have been described for simultaneous stimulation by Gq- and Gi-coupled receptors.
Superadditive stimulation of PLC-β3 by Gβγ and Gαq also resembles cellular Gi-Gq synergism qualitatively. Gβγ mediates PLC-β stimulation in cells, and cellular Gαi-GDP sequesters Gβγ to terminate signaling after GTP hydrolysis [21, 27]. Similarly, Gαi-GDP blocked both stimulation of PLC-β3 by Gβγ and its potentiation of Gαq (Table 1). Multiple Gβγ dimers yield superadditive stimulation when added with Gαq (see Table S1, available online), consistent with the occurrence of synergistic responses in diverse cell types. Other experiments used only Gβ1γ2. Gβγ-Gαq synergism also requires activation of Gαq by GTP or a nonhydrolyzable analog (GTPγS); Gαq-GDP neither stimulates PLC-β3 nor potentiates stimulation by Gβγ at the highest concentrations tested (Table S2). Hence, all other experiments shown here use Gαq that has been activated by GTPγS. Because Gαq activated by GTPγS or GTP binds Gβγ with relatively low affinity [28], Gβγ does not block its stimulation of PLC-βs.
Table 1.
Gαi1-GDP Blocks Gβγ-Gαq Synergism
| [Gαq-GTPγS] (nM) | [ Gβγ ] (nM) | [ Gαi1-GDP ] (nM) | Synergism Ratio |
|---|---|---|---|
| 0.2 | 10 | 0 | 4.6 |
| 0.2 | 10 | 30 | 0.59 |
| 0.2 | 10 | 30; heated | 4.6 |
| 0.2 | 5 | 0 | 4.7 |
| 0.2 | 5 | 15 | 0.91 |
| 0.2 | 5 | 15; heated | 4.4 |
Synergism ratios were determined at 0.2 nM GTPγS-activated Gαq and two concentrations of Gβγ, with or without a 3-fold molar excess of GDP-bound Gαi1. Controls contained Gαi1 that had been heated at 50°C for 60 min. Results show means from two experiments, each with triplicate determinations, and are representative of two additional experiments that did not contain the heated Gαi control. Gαi1-GDP also blocked stimulation by Gβγ alone (not shown).
Gαq-Gβγ synergism was independent of Ca2+ concentration from well below that of resting cytosol (30 pM) to higher than usually reported for stimulated cells (10 μM) (Figure 1B). Responses to Gαq and Gβγ should therefore be potentiative continuously during a cytosolic Ca2+ transient. Ca2+ also had a negligible effect on the EC50 or Hill coefficient for either G protein subunit. Because PLC activity with either or both G protein subunits extrapolates to zero at low Ca2+, Ca2+ appears not to alter the G protein-driven activation↔deactivation equilibrium but simply to act as an amplifier of PLC activity. We therefore used 60 nM Ca2+ for all PLC-β3 experiments as a reasonable value for resting cytosolic concentration.
Gαq-Gβγ synergism is insensitive to multiple other variations in assay conditions (mole fraction of PIP2, PLC concentration, temperature, detergent, ionic strength, and lipid surface composition; data not shown). Gq-Gi synergism can therefore reasonably be expected in any cell that expresses PLC-β3. Taken together, these data indicate that direct synergistic activation of PLC-β3 by Gαq and Gβγ can account for superadditive IP3-Ca2+ signaling in cells; no other component or pathway is required.
General Allosteric Mechanism for Synergistic Enzyme Activation
Because activated Gαq and Gβγ both stimulate PLC-β3 noncovalently, we asked whether a simple two-state allosteric model for PLC-β3 activation can account for the markedly superadditive responses to these ligands. Such a mechanism, described in Figure 2, demands only that (1) PLC-β3 exists in two conformational states, active (P*) and inactive (P), in equilibrium described by the constant J; (2) that both Gαq and Gβγ bind reversibly and independently to PLC-β3 in either conformational state; and (3) that both G protein subunits bind more tightly to the P* conformation, as described by the bias constants F and G. This model is classically used to describe allosteric activation by individual ligands [2, 3]. Note that this two-state allosteric mechanism is quite general: it neither requires nor suggests any particular property of the P* state that makes it more active than P, nor any biochemical mechanism for the P↔P* transition. Activation may represent substantial subunit rearrangement, minor movement of residues at or near the active site, movement of an autoinhibitory structure, altered interaction with the membrane surface, some other event, or a combination of such changes.
Figure 2.
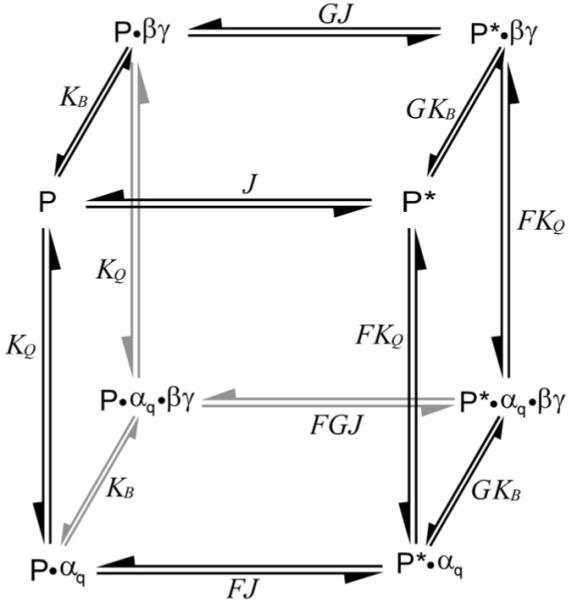
A Two-State Allosteric Model for Synergistic Activation of PLC-β3
PLC can exist in one of two states, either relatively inactive (P) or highly active (P*), with the intrinsic conformational equilibrium described by the isomerization constant J. Gαq and Gβγ can bind to either state at nonoverlapping sites, with association constants Kq and Kb defined for the inactive (P) conformer. Gαq and Gβγ, both allosteric activators, bind relatively more tightly to the active state, with their preference for P* over P described by the bias constants F and G.
We used a combination of fitting to experimental data and numerical simulation to ask whether the allosteric mechanism can quantitatively account for both the individual and the synergistic activation of PLC-β3 by Gαq and Gβγ. The activity of PLC-β3 was measured over a wide range of concentrations of activated Gαq and Gβγ, covering almost a 600-fold range of activities (Figure 3). These data were fit to an equilibrium equation (Equation 2) that describes the model of Figure 2. It defines PLC activity as the product of its maximal intrinsic-specific activity, Z, and the fraction of PLC in the four active species shown in Figure 2. The numerator sums each active species and the denominator sums all species. Although this equation is long, it contains few free parameters: binding constants for Gαq and Gβγ (defined for the less active state); an equilibrium constant J that describes the inactive-active conformational equilibrium in the absence of ligand; and two bias constants, F and G, that describe the preference of Gαq and Gβγ for binding to the more active conformer. Equation 2 assumes that the less active P state has zero activity, which is approximately correct because maximal activity is more than 500-fold above basal:
| (2) |
Figure 3.

Coordinate Regulation of PLC-β3 by Gαq and Gβγ
PLC-β3 activity was assayed at 60 nM Ca2+ over a range of concentrations of Gαq and Gβγ chosen to optimize fitting the data to the scheme shown in Figure 2. Activities are plotted against the concentration of Gαq (A) and Gβγ (B) at various fixed concentrations of the other subunit. One hundred data points, averages of duplicates, with ranges, are shown out of a total of 115. Solid lines are simulations based on the scheme in Figure 2 and the parameter values in Table 2.
The response of PLC-β3 to a matrix of concentrations of Gαq and Gβγ was well fit by the allosteric model. Values of constants displayed tolerable statistical errors (Table 2), and overlay of the model-based simulation on the experimental data was clear throughout the ranges of Gαq and Gβγ concentration (Figures 3 and 4). Values of maximum activities, EC50, and Hill coefficient were all approximated well (Figure 3). Qualitatively similar fits were obtained for two additional similar experiments (not shown). Experimental data are thus consistent with the simple two-state model. To corroborate the values for J, F, and G, we also estimated them from activities measured in the presence of a single high concentration of Gαq, Gβγ, or both (Table 2). This method is independent of Kb, Kq, and Z. Values for J and G were similar to those derived from fitting the complete matrix of activities; the value of F was somewhat higher but does not change maximal predicted activation by Gαq because even the lower value predicts substantial activation.
Table 2.
Allosteric Model Parameters for PLC-b3
| Matrix Fit | 4-Point Fit | |
|---|---|---|
| Z | 5300 ± 130 min−1 | |
| J | 0.00150 ± 0.00047 | 0.00094 ± 0.00002 |
| Kq | 0.220 ± 0.042 nM−1 | |
| F | 434 ± 154 | 1700 ± 300 |
| Kb | 0.0307 ± 0.0056 nM−1 | |
| G | 45.9 ± 9.0 | 41 ± 1.1 |
Values for the parameters of the allosteric model (Figure 2) were estimated in two ways. Matrix fit parameters (± standard error) were obtained by fitting data from the experiment shown in Figure 3, which was performed at 60 nM Ca2+. The complete experiment contained additional data points that were included to improve the quality of the fit based on the results of pilot experiments. Z is the maximum specific activity of the PLC under these assay conditions and varies among assays according to the preparation of phos-pholipid substrate vesicles. 4-point fit parameters (average of three experiments, ± SD) were calculated from activities obtained at saturating values of Gαq, Gβγ, both, or neither. The 4-point fit is independent of Z, Kq, and Kb. Details are in the Supplemental Information.
Figure 4.

Gαq-Gβγ Synergism Is Maximal at Intermediate G Protein Concentrations
(A) The data from the experiment shown in Figure 2, PLC-β3 activities assayed over a range of concentrations of Gαq and Gβγ, are replotted as synergism ratios, calculated as described in the legend to Figure 1. Each vertex on the surface represents a ratio calculated from the three assays (PLC-β3 plus Gαq, Gβγ, or both), each performed in duplicate. This plot is similar to those derived from two other similar experiments.
(B) Synergism ratios for the experiment in Figure 4A were simulated according to the allosteric model and the parameters shown in Table 2.
The data of Figure 3 and Table 2 indicate that PLC-β3 resides ~99.9% in the inactive state in the absence of G protein under these assay conditions. (Fractional basal activity = J / (1 + J).) Saturating Gαq stimulates ~250-fold and saturating Gβγ stimulates about 50-fold. Combination of saturating Gαq and Gβγ together produced about 80% of theoretical total activation (~600-fold) (Table 2). Each subunit thus markedly potentiated PLC-β3 activation by the other. Gβγ and Gαq also each decreased the EC50 of the other (Figure S1), indicating that each G protein subunit reciprocally increases the other’s affinity for PLC-β3. Based on the parameters of Table 2, each subunit increases the affinity of the other about 19-fold, representing ΔΔG ~ 1.8 Kcal for the binding interaction. Such positively cooperative binding is also predicted by the basic allosteric model, which was developed to describe effects on ligand affinity [2, 3]. Note, however, that synergism does not merely reflect the reciprocal increase in the affinity of each subunit by the other. Synergism is above 7-fold at saturating concentrations of Gβγ and remains above 2-fold at the highest concentrations of both subunits.
The extent and concentration dependence of Gαq-Gβγ synergism also agree well with simulation based on the allosteric model (Figure 4), and comparison of data and simulation point out general aspects of allosteric synergism. The synergism ratio displays a pronounced peak at intermediate concentrations of both Gβγ and Gαq, with a peak value of 10. The ratio falls off at high Gαq concentrations but is significantly greater than 2.0 even at saturating concentrations of Gαq and Gβγ and remains above 1.0 at very low concentrations where activation is minimal. The Gβγ concentration did not have a marked effect on the maximally synergistic concentration of Gαq, nor did Gαq alter the maximally synergistic concentration of Gβγ. In all of these aspects, the model-based simulation quantitatively mirrored the experimental data. The two-state allosteric model can thus account for both independent and synergistic regulation of PLC-β3 at steady-state.
Other PLC-β Isoforms Do Not Display Gαq-Gβγ Synergism
Seaman and coworkers [10] reported that only the PLC-β3 isoform produces synergistic responses to Gi- and Gq-coupled receptors in macrophages, even though the four PLC-β isoforms are structurally homologous and PLC-β1, -β2, and -β3 are all individually stimulated by both Gαq and Gβγ. We surveyed activation of PLC-β1, PLC-β2, and PLC-β4 over a wide range of concentrations of both subunits and under diverse assay conditions but found that stimulation by Gβγ and Gαq was always additive or less than additive for these three isoforms (examples in Figures S2 and S3). The synergism ratio never significantly exceeded 1.0. This negative finding is thus consistent with the cellular behavior reported for the other isoforms.
What Determines Synergism for a Two-State, Multiactivator Allosteric Enzyme?
If the simple model of Figure 2 quantitatively explains synergistic stimulation of PLC-β3 by Gαq and Gβγ, why do the closely related PLC-β1 and PLC-β2 isoforms not give a synergistic response? More generally, when will an enzyme that is stimulated by noncovalent binding of two or more activating ligands display a synergistic response? How is synergism determined by the parameters of the model?
The simulations in Figure 5 show that the intrinsic isomerization constant J determines both the maximal synergism that can be attained by a two-state allosteric protein and the sensitivity of synergism to the two bias constants F and G. Decreasing J increases synergism, and maximum attainable synergism is approximately inversely proportional to J (Figure 5E). For an enzyme with more than 1% intrinsic activity without ligand (J ≥ 0.01), maximal synergism is at most 2.4-fold (Figure 5B). Sensitivity to the values of F and G is also very sharp, such that only perfectly matched F and G can yield even slight synergism. J = 0.01 is thus the practical upper limit for synergism.
Figure 5.

Predicted Effect of the Spontaneous Activation Constant J on Synergistic Activation by two allosteric regulators
The activity of an enzyme that is activated by two ligands according to the two-state model (Figure 2) was simulated over a range of values of the bias constants F and G. For reference, J ~ 0.001 for PLC-β3 (Table 2). The graphs show calculated synergism ratios at four values of J: 0.1, 0.01, 0.001, and 0.0001. Note the scale differences among the synergism axes in each panel; the maximal synergism ratio for J = 0.1 is less than 1.0. The graph at the bottom shows the nearly inverse relationship between the maximal synergism ratio and J, with a straight line of best fit drawn for reference. For the simulations, the concentrations of the two activators were set equal to 1/Kq and 1/Kb. Changing the concentrations alters the location of the maximum synergism ratio in the F-G plane but has no effect on its value over a wide range of concentrations (see Figures S4 and S5).
At J = 0.001, about that of PLC-β3, maximal synergism is increased to 10-fold, and the dependences on F and G are far less strict (Figure 5C). Further, synergism is at least 3-fold for almost all reasonable F-G combinations, similar to the behavior of PLC-β3. Thus enzymes that respond to two ligands will display significant potentiative responses if J < 0.001. For lower values of J, maximal synergism increases and dependence on F and G broadens, such that J = 0.0001 can produce > 25-fold synergism over a wide range of F and G (Figure 5D).
Within the limiting maximal synergism that is determined by J, superadditive responses by a given enzyme also depend on the bias constants (Figure 5) and on the concentrations of the ligands relative to their intrinsic affinities for the target enzyme (Figure 4). These two parameters are linked: the dependence of synergism on ligand concentration varies with the bias constants F and G at any fixed value of J (Figure 4 and Figure S4). When F and G are both high, the synergism ratio displays a sharp dependence on ligand concentrations. When both F and G are decreased, synergism is displayed over a broad concentration range. Thus, for a given enzyme with a suitable value of J, synergism is more likely for two ligands that stimulate with bias constants on the order of 1/J. Further, when the bias constant for only one ligand is high, its optimum concentration is tightly defined but a wide range of concentrations of the weaker activator can promote synergism.
Similarly, the synergism depends less on the precise values of F and G if the concentrations of the two activating ligands are both low (Figure S5). Lower concentrations allow synergism over a wide range of F and G, but saturating concentrations of both ligands will produce superadditive responses only for a limited range of F and G values. This is the situation for PLC-β3 (Figure 4). In all cases, however, J is the primary determinant of whether synergism will be observed, its maximal extent, and the range of ligand concentrations over which it occurs.
Why PLC-β1, -β2, and -β4 Do Not Respond Synergistically to Gαq and Gβγ
The two-state allosteric model also allows us to explain why only PLC-β3 of the four PLC-β isoforms responds synergistically to inputs from Gi and Gq. PLC-β2 responds well to both Gβγ and Gαq. Its behavior was well fit by Equation 2 (Figure S3), consistent with the two-state model, but the values for the constants were strikingly different than those for PLC-β3 (Table S3). Most important, the value of J was 0.15, which precludes synergism (Figure 5E). The basal activity of PLC-β2 is 140 ± 45 min−1 under our assay conditions (six duplicate assays), almost 20 times that of PLC-β3. Thus, PLC-β2 fails to display synergism because its basal activity is too high, placing a lid on any possible synergism. In the case of PLC-β1, basal activity is low enough to permit synergism, with J ≤ 0.003, but PLC-β1 is not sufficiently sensitive to activation by Gβγ. PLC-β1 is stimulated less than 4-fold by Gβγ over a wide range of Ca2+ concentrations, and it is known to be less sensitive to Gβγ than are the -β2 and -β3 isoforms [21]. For G ≤ 4, simulations do not predict any synergism regardless of Gβγ and Gαq concentrations, even for J ~ 0.001 (Figure 5, Figure S5). We saw no response of PLC-β4 to Gβγ, as reported previously [29]. Therefore, G < 2 for PLC-β4, similarly disallowing Gαq-Gβγ synergism. The unique ability of PLC-β3 to respond synergistically to Gαq and Gβγ, even though the other PLC-β isoforms do not, is thus explained by the two-state model and the values of the isomerization and bias constants for each enzyme.
Discussion
Synergistic responses to multiple stimuli are relatively rare in biology, but they are important because they allow cells to respond distinctively to two simultaneous signals with novel behaviors. Depending on the dynamics of the signaling pathway, these novel behaviors can take several forms. If each input elicits a minimal response alone and only simultaneous stimulation generates an intracellular signal, then synergism creates a coincidence detector, or logical “AND” gate. Each signal is permissive for the other. Alternatively, each input may be strong enough to initiate signaling on its own, and synergism conveys information on context; each signal is amplified if the other input is present. Such mutual potentiation can be quantitative, more of the same cellular signal, but such amplification can initiate qualitatively new outputs depending on the response thresholds of downstream proteins.
Gi-Gq Synergism
This study shows that synergistic signaling by Gi- and Gq-coupled receptors can be explained by the superadditive response of PLC-β3 to stimulation by Gβγ and Gαq. Gi-Gq synergism has been recognized for over 15 years and is a physiologically important coincidence detector in diverse cells [10, 13, 14, 16, 20]. In cells, Gi provides the Gβγ because a relatively high Gβγ concentration is required (Figures 3 and 4) and only the Gi family heterotrimers are expressed at high enough levels and release their Gβγ adequately [21, 30]. Gis are the primary source of Gβγ for all signaling events, apparently for this reason [30].
The 10-fold superadditive response of PLC-β3 to Gβγ and Gαq is quantitatively more than adequate to account for cellular Gi-Gq synergism over the range of cytosolic Ca2+ concentrations. Only PLC-β3 among the PLC-β isoforms displays this behavior, which agrees with the finding that only PLC-β3 permits Gi-Gq synergism in cells [10]. PLC-β3 is thus a sensitive cellular coincidence detector, one of few allosteric proteins that can act in this way. Gi-Gq synergism requires no other cellular proteins or pathways. By expression of this isoform, cells can switch between an additive response to Gi and Gq inputs and a coincidence detection mode.
Synergism demands that both Gαq and Gβγ bind simultaneously to nonoverlapping sites on PLC-β, as suggested previously [31]. Because the relative spatial orientation of the two binding sites is unknown [32, 33], it is unclear whether Gαq and Gβγ are in contact with each other when bound to PLC-β3. When Gαq and Gβγ bind to the RGS domain of GRK2, the two subunits make no contact and lie on essentially opposite sides of the central GRK2 molecule [34]. The absolute affinity of Gβγ for GTPγS-activated Gαq is low enough that it should not significantly sequester activated Gαq at the concentrations used here [28]. Does simultaneous binding of Gαq and Gβγ to PLC-β3 alter the conformation of either G protein subunit? The ability of Gβγ to inhibit the Gq GAP activity of PLC-β [28, 35] might involve such contact, but synergism between Gβγ and GTPγS-activated Gαq shows that synergism as such does not involve GAP inhibition.
General Mechanism for Synergistic Response by a Single Enzyme
The synergistic response of PLC-β3 can be described quantitatively by a simple two-state allosteric model that requires only that PLC-β3 exist in two interconvertible states with low and high intrinsic activities (Figure 2). It neither requires nor predicts any particular physical property of the two states or of the transition between them. Activation may reflect gross domain rearrangement, movement of an autoinhibitory structure, minor motion of an active site residue, or, as suggested for the PLCs [32], reorientation with respect to the membrane bilayer. More broadly, a general two-state model can account for synergism regardless of whether regulation is allosteric or covalent. Noncovalent allosteric regulation of a protein that is also stimulated by phosphorylation, for example, can be described by the same conformational equilibria shown in Figure 2. Similarly, the model is applicable to signaling proteins that are not enzymes: transcription factors, channels, scaffolds, etc. Although any two-state model is a simplification of a protein’s dynamic structure, this model shows that synergism can be attained without supposing distinct conformations favored by each ligand or their combination.
The two-state model predicts synergism without demanding any direct interaction between the two ligands or any direct effect of one ligand upon the binding of the other. In terms of Figure 2, Gβγ does not change F and Gαq does not change G. Synergism occurs simply because the binding of both ligands favors the active state. There is no “higher-order coupling.” The two-state model was developed to deal with cooperative ligand binding [2, 3] and obviously predicts positive cooperativity of binding of the two ligands (Figure S1). Enhanced binding can result in physiologic synergism as one ligand allows another to act at a lower concentration than it would otherwise (e.g., [4, 36, 37]). However, the synergism described here results from an increased population of the active state of the enzyme rather than just increased affinity for activating ligands.
Synergistic activation in a two-state system demands that the enzyme strongly favor the inactive state in the absence of ligand. J must be low, and this makes intuitive sense. Binding of each ligand drives the enzyme to its more active form with the free energy associated with its bias constant, F or G. This is true regardless of J. However, a low value of J provides a large enough dynamic range of activation that the addition of these free energies can be expressed as a synergistic response in net activity. Synergism therefore does not require any effect of one ligand upon the other ligand’s intrinsic bias for the active state. Each ligand contributes its own ΔΔG to the conformational equilibrium, but synergistic activation does not require a “ΔΔΔG” for ligand-ligand interaction. Such complex interactions surely occur for some enzymes, glycogen phosphorylase for example [38, 39], but they demand the explicit assumption of more and different stable conformational states, which in general is unnecessary.
Why is synergism observed so rarely if the simplest and most common model for allostery predicts it? Again, the answer lies with the demand for a low value of J. Maximum synergism and J are approximately inversely proportional (Figure 5E). If an enzyme is even 1% active without ligands, its capacity for a synergistic response will be slight, and it will display no synergism at all unless the bias constants for the activators and their concentrations are fortuitously well matched. Most allosteric enzymes are stimulated less than 100-fold by their regulatory ligands, and far smaller stimulation can be important for cellular regulation. Yet, these proteins will not show detectable synergistic responses.
In contrast, decreasing intrinsic activation to 0.1% allows an enzyme to respond with robust synergism, as is the case for PLC-β3. Maximum synergism will exceed 8-fold and will be observed for ligands that display a relatively broad range of bias constants. The concentration optima for synergism will depend on the bias constants, but high synergism will be observed over a > 10-fold range of activator concentrations and will be more than 2-fold for all relevant activator concentrations. This is the case for PLC-β3 (Figure 4). Values of J < 0.001 further broaden both the extent of synergism and the tolerance for divergent bias constants (Figure 5).
For the PLC-βs, this analysis explains why PLC-β3 responds synergistically to Gαq and Gβγ but PLC-β1 and PLC-β2 do not. Although PLC-β2 responds well to both G protein subunits, its intrinsic activity is too high, J = 0.15, and no combination of concentrations or bias constants will allow synergism. For PLC-β1, synergism is limited because its intrinsic response to Gβγ is too low, even though it responds to Gβγ significantly both in cells and after purification.
Using the basal activation set point to determine whether an enzyme functions as a coincidence detector or merely as a dual responder offers distinct evolutionary advantages. Synergism can be acquired or lost by changing J only 10-fold, while retaining the same fractional (“-fold”) responses to each regulatory input. An enzyme with J = 0.01 can respond to two ligands with almost a 100-fold dynamic range but display essentially no synergism. Alternatively, for J = 0.001, the protein will act as a sensitive coincidence detector in addition to providing a response to each ligand. An enzyme can evolve between these two regimes without sacrificing underlying allosteric regulation. Even absolute signaling activity can be retained with only minor changes in either catalytic activity (kcat/Km for the active state) or level of expression. In terms of cellular signaling, changing J in the range below 0.01 will have negligible practical effect on basal activity.
The general inverse dependence of synergism on an enzyme’s basal level of activity suggests that any enzyme that can be activated more than 500-fold (J < 0.002) is likely to display synergism among its activators. Examples include adenylyl cyclases [40], some protein kinase C isoforms [41], and the Rac exchange factor P-Rex1 [42]. Novel synergisms should be detectable by identifying other highly regulated enzymes. Evaluating the behavior of these enzymes in cells should drive discovery of new synergisms, coincidence detectors, and biological AND gates.
Last, even though our data do not speak to the regulation of synergism by additional inputs, the allosteric model argues that synergism can be modulated best by controlling the value of J, perhaps with an added benefit of reducing basal activity. Modulation of J by other signaling mechanisms can thus convert an enzyme that responds independently to stimuli into a coincidence detector.
Experimental Procedures
Detailed experimental procedures are in the Supplemental Information
All proteins were purified essentially as described [43]. Gαq and Gβγ were finally concentrated by adsorption to Q-Sepharose and elution in 5 mg/ml 3-[(cholamidopropyl)dimethylammonio]-1-propanesulfonate (CHAPS) to minimize detergent in the PLC assay. Gαq was activated with GTPγS [44], but incubation was extended to 5 hr such that Gαq that did not bind GTPγS would be denatured and would not bind Gβγ. Gβ1γ2 was used throughout except in Table SI, where other Gβγ isoforms were tested.
PLC activity was measured at 37°C by monitoring hydrolysis of [3H]PIP2 on the surface of large unilamellar vesicles composed of PE:PS:PIP2 (20:4:1 molar ratio), roughly similar to the inner monolayer of the plasma membrane [43]. Activities are reported as moles of IP3 produced per min per mole of PLC. The concentration of free Ca2+ was adjusted with an EGTA buffer and the program Bound and Determined [45] and was 60 nM unless indicated otherwise. Because PLC-β3 can be activated more than 104-fold by combination of Ca2+, Gβγ, and Gαq (see Figure 1), assay time (2–40 min) and PLC-β3 concentration (10–4000 pM) were adjusted for each assay to maintain linearity of activity with enzyme concentration, obtain accurately measurable PIP2 hydrolysis, prevent substrate depletion, and control free concentrations of G protein subunits. CHAPS inhibits stimulation of PLC-β3 with IC50 = 100 μM. CHAPS was less than 20 μM in all assays and was equalized among all samples in each assay.
Supplementary Material
Acknowledgments
We thank multiple colleagues at University of Texas Southwestern for valuable discussion; William Seaman, Robert Rebres, and Tamara Roach (University of California San Francisco) for sharing unpublished results; Paul Sternweis (UT Southwestern) for the PLC-β2 baculovirus and PLC-β3 cDNA; and Iain Frasier (National Institute of Allergy and Infectious Diseases) for the PLC-β4 cDNA. This work was supported by National Institutes of Health (NIH) grant R01GM030355 and an American Recovery and Reinvestment Act competing supplement, and by Welch Foundation grant I-0982.
Footnotes
Supplemental Information
Supplemental Information includes five figures, three tables, and Supplemental Experimental Procedures and can be found with this article online at doi:10.1016/j.cub.2010.06.013.
References
- 1.Natarajan M, Lin K-M, Hsueh RC, Sternweis PC, Ranganathan R. A global analysis of cross-talk in a mammalian cellular signalling network. Nat. Cell Biol. 2006;8:571–580. doi: 10.1038/ncb1418. [DOI] [PubMed] [Google Scholar]
- 2.Weber G. Protein Interactions. Chapman & Hall; New York, NY: 1992. [Google Scholar]
- 3.Wyman J, Gill SJ. Binding and Linkage. Functional Chemistry of Biological Macromolecules. University Science Books; Mill Valley, CA: 1990. [Google Scholar]
- 4.Prehoda KE, Lim WA. How signaling proteins integrate multiple inputs: A comparison of N-WASP and Cdk2. Curr. Opin. Cell Biol. 2002;14:149–154. doi: 10.1016/s0955-0674(02)00307-1. [DOI] [PubMed] [Google Scholar]
- 5.Pawson T. Dynamic control of signaling by modular adaptor proteins. Curr. Opin. Cell Biol. 2007;19:112–116. doi: 10.1016/j.ceb.2007.02.013. [DOI] [PubMed] [Google Scholar]
- 6.Winters MJ, Lamson RE, Nakanishi H, Neiman AM, Pryciak PM. A membrane binding domain in the Ste5 scaffold synergizes with Gβγ binding to control localization and signaling in pheromone response. Mol. Cell. 2005;20:21–32. doi: 10.1016/j.molcel.2005.08.020. [DOI] [PubMed] [Google Scholar]
- 7.Pu M, Roberts MF, Gershenson A. Fluorescence correlation spectroscopy of phosphatidylinositol-specific phospholipase C monitors the interplay of substrate and activator lipid binding. Biochemistry. 2009;48:6835–6845. doi: 10.1021/bi900633p. [DOI] [PMC free article] [PubMed] [Google Scholar]
- 8.Barrera NP, Morales B, Torres S, Villalón M. Principles: Mechanisms and modeling of synergism in cellular responses. Trends Pharmacol. Sci. 2005;26:526–532. doi: 10.1016/j.tips.2005.08.003. [DOI] [PubMed] [Google Scholar]
- 9.Hlavacek WS, Faeder JR, Blinov ML, Perelson AS, Goldstein B. The complexity of complexes in signal transduction. Biotechnol. Bioeng. 2003;84:783–794. doi: 10.1002/bit.10842. [DOI] [PubMed] [Google Scholar]
- 10.Roach TIA, Rebres RA, Fraser IDC, Decamp DL, Lin KM, Sternweis PC, Simon MI, Seaman WE. Signaling and cross-talk by C5a and UDP in macrophages selectively use PLCbeta3 to regulate intracellular free calcium. J. Biol. Chem. 2008;283:17351–17361. doi: 10.1074/jbc.M800907200. [DOI] [PMC free article] [PubMed] [Google Scholar]
- 11.Toms NJ, Roberts PJ. Group 1 mGlu receptors elevate [Ca2+]i in rat cultured cortical type 2 astrocytes: [Ca2+]i synergy with adenosine A1 receptors. Neuropharmacology. 1999;38:1511–1517. doi: 10.1016/s0028-3908(99)00090-8. [DOI] [PubMed] [Google Scholar]
- 12.Okajima F, Sato K, Sho K, Kondo Y. Stimulation of adenosine receptor enhances α 1-adrenergic receptor-mediated activation of phospholipase C and Ca2+ mobilization in a pertussis toxin-sensitive manner in FRTL-5 thyroid cells. FEBS Lett. 1989;248:145–149. doi: 10.1016/0014-5793(89)80450-8. [DOI] [PubMed] [Google Scholar]
- 13.Werry TD, Wilkinson GF, Willars GB. Mechanisms of cross-talk between G-protein-coupled receptors resulting in enhanced release of intracellular Ca2+ Biochem. J. 2003;374:281–296. doi: 10.1042/BJ20030312. [DOI] [PMC free article] [PubMed] [Google Scholar]
- 14.Abrams CS. Intracellular signaling in platelets. Curr. Opin. Hematol. 2005;12:401–405. doi: 10.1097/01.moh.0000176681.18710.e3. [DOI] [PubMed] [Google Scholar]
- 15.Dickenson JM, Hill SJ. Coupling of histamine H1 and adenosine A1 receptors to phospholipase C in DDT1MF-2 cells: Synergistic interactions and regulation by cyclic AMP. Biochem. Soc. Trans. 1993;21:1124–1129. doi: 10.1042/bst0211124. [DOI] [PubMed] [Google Scholar]
- 16.Shah BH, Siddiqui A, Qureshi KA, Khan M, Rafi S, Ujan VA, Yakoob MY, Yaqub Y, Rasheed H, Saeed SA. Co-activation of Gi and Gq proteins exerts synergistic effect on human platelet aggregation through activation of phospholipase C and Ca2+ signalling pathways. Exp. Mol. Med. 1999;31:42–46. doi: 10.1038/emm.1999.7. [DOI] [PubMed] [Google Scholar]
- 17.Cilluffo MC, Esqueda E, Farahbakhsh NA. Multiple receptor activation elicits synergistic IP formation in nonpigmented ciliary body epithelial cells. Am. J. Physiol. Cell Physiol. 2000;279:C734–C743. doi: 10.1152/ajpcell.2000.279.3.C734. [DOI] [PubMed] [Google Scholar]
- 18.Okajima F, Tomura H, Kondo Y. Enkephalin activates the phospholipase C/Ca2+ system through cross-talk between opioid receptors and P2-purinergic or bradykinin receptors in NG 108-15 cells. A permissive role for pertussis toxin-sensitive G-proteins. Biochem. J. 1993;290:241–247. doi: 10.1042/bj2900241. [DOI] [PMC free article] [PubMed] [Google Scholar]
- 19.Werry TD, Wilkinson GF, Willars GB. Cross talk between P2Y2 nucleotide receptors and CXC chemokine receptor 2 resulting in enhanced Ca2+ signaling involves enhancement of phospholipase C activity and is enabled by incremental Ca2+ release in human embryonic kidney cells. J. Pharmacol. Exp. Ther. 2003;307:661–669. doi: 10.1124/jpet.103.055632. [DOI] [PubMed] [Google Scholar]
- 20.Rozengurt E. Mitogenic signaling pathways induced by G protein-coupled receptors. J. Cell. Physiol. 2007;213:589–602. doi: 10.1002/jcp.21246. [DOI] [PubMed] [Google Scholar]
- 21.Rebecchi MJ, Pentyala SN. Structure, function, and control of phosphoinositide-specific phospholipase C. Physiol. Rev. 2000;80:1291–1335. doi: 10.1152/physrev.2000.80.4.1291. [DOI] [PubMed] [Google Scholar]
- 22.Carroll RC, Morielli AD, Peralta EG. Coincidence detection at the level of phospholipase C activation mediated by the m4 muscarinic acetylcholine receptor. Curr. Biol. 1995;5:536–544. doi: 10.1016/s0960-9822(95)00106-0. [DOI] [PubMed] [Google Scholar]
- 23.Chan JSC, Lee JWM, Ho MKC, Wong YH. Preactivation permits subsequent stimulation of phospholipase C by Gi-coupled receptors. Mol. Pharmacol. 2000;57:700–708. doi: 10.1124/mol.57.4.700. [DOI] [PubMed] [Google Scholar]
- 24.Zhu X, Birnbaumer L. G protein subunits and the stimulation of phospholipase C by Gs-and Gi-coupled receptors: Lack of receptor selectivity of Gα16 and evidence for a synergic interaction between Gβγ and the α subunit of a receptor activated G protein. Proc. Natl. Acad. Sci. USA. 1996;93:2827–2831. doi: 10.1073/pnas.93.7.2827. [DOI] [PMC free article] [PubMed] [Google Scholar]
- 25.Quitterer U, Lohse MJ. Crosstalk between Gαi- and Gαq-coupled receptors is mediated by Gβγ exchange. Proc. Natl. Acad. Sci. USA. 1999;96:10626–10631. doi: 10.1073/pnas.96.19.10626. [DOI] [PMC free article] [PubMed] [Google Scholar]
- 26.Ogasawara H. The calcium kinetics and inositol trisphosphate receptor properties shape the asymmetric timing window of coincidence detection. J. Neurosci. 2008;28:4293–4294. doi: 10.1523/JNEUROSCI.0644-08.2008. [DOI] [PMC free article] [PubMed] [Google Scholar]
- 27.Camps M, Carozzi A, Schnabel P, Scheer A, Parker PJ, Gierschik P. Isozyme-selective stimulation of phospholipase C-β2 by G protein βγ-subunits. Nature. 1992;360:684–686. doi: 10.1038/360684a0. [DOI] [PubMed] [Google Scholar]
- 28.Tang W, Tu Y, Nayak SK, Woodson J, Jehl M, Ross EM. Gβγ inhibits Gα GTPase-activating proteins by inhibition of Gα-GTP binding during stimulation by receptor. J. Biol. Chem. 2006;281:4746–4753. doi: 10.1074/jbc.M510573200. [DOI] [PubMed] [Google Scholar]
- 29.Lee C-W, Lee K-H, Lee SB, Park D, Rhee SG. Regulation of phospholipase C-β4 by ribonucleotides and the α subunit of Gq. J. Biol. Chem. 1994;269:25335–25338. [PubMed] [Google Scholar]
- 30.Clapham DE, Neer EJ. G protein βγ subunits. Annu. Rev. Pharmacol. Toxicol. 1997;37:167–203. doi: 10.1146/annurev.pharmtox.37.1.167. [DOI] [PubMed] [Google Scholar]
- 31.Smrcka AV, Sternweis PC. Regulation of purified subtypes of phosphatidylinositol-specific phospholipase Cβ by G protein α and βγ subunits. J. Biol. Chem. 1993;268:9667–9674. [PubMed] [Google Scholar]
- 32.Hicks SN, Jezyk MR, Gershburg S, Seifert JP, Harden TK, Sondek J. General and versatile autoinhibition of PLC isozymes. Mol. Cell. 2008;31:383–394. doi: 10.1016/j.molcel.2008.06.018. [DOI] [PMC free article] [PubMed] [Google Scholar]
- 33.Singer AU, Waldo GL, Harden TK, Sondek J. A unique fold of phospholipase C-β mediates dimerization and interaction with Gαq. Nat. Struct. Biol. 2002;9:32–36. doi: 10.1038/nsb731. [DOI] [PubMed] [Google Scholar]
- 34.Tesmer VM, Kawano T, Shankaranarayanan A, Kozasa T, Tesmer JJG. Snapshot of activated G proteins at the membrane: The Gαq-GRK2-Gβγ complex. Science. 2005;310:1686–1690. doi: 10.1126/science.1118890. [DOI] [PubMed] [Google Scholar]
- 35.Chidiac P, Ross EM. PLC-β1 directly accelerates GTP hydrolysis by Gαq and acceleration is inhibited by Gβγ subunits. J. Biol. Chem. 1999;274:19639–19643. doi: 10.1074/jbc.274.28.19639. [DOI] [PubMed] [Google Scholar]
- 36.Buck M, Xu W, Rosen MK. A two-state allosteric model for autoinhibition rationalizes WASP signal integration and targeting. J. Mol. Biol. 2004;338:271–285. doi: 10.1016/j.jmb.2004.02.036. [DOI] [PubMed] [Google Scholar]
- 37.Prehoda KE, Scott JA, Mullins RD, Lim WA. Integration of multiple signals through cooperative regulation of the N-WASP-Arp2/3 complex. Science. 2000;290:801–806. doi: 10.1126/science.290.5492.801. [DOI] [PubMed] [Google Scholar]
- 38.Sprang SR, Acharya KR, Goldsmith EJ, Stuart DI, Varvill K, Fletterick RJ, Madsen NB, Johnson LN. Structural changes in glycogen phosphorylase induced by phosphorylation. Nature. 1988;336:215–221. doi: 10.1038/336215a0. [DOI] [PubMed] [Google Scholar]
- 39.Barford D, Johnson LN. The allosteric transition of glycogen phosphorylase. Nature. 1989;340:609–616. doi: 10.1038/340609a0. [DOI] [PubMed] [Google Scholar]
- 40.Sunahara RK, Dessauer CW, Whisnant RE, Kleuss C, Gilman AG. Interaction of Gsα with the cytosolic domains of mammalian adenylyl cyclase. J. Biol. Chem. 1997;272:22265–22271. doi: 10.1074/jbc.272.35.22265. [DOI] [PubMed] [Google Scholar]
- 41.Nishizuka Y. Intracellular signaling by hydrolysis of phospholipids and activation of protein kinase C. Science. 1992;258:607–614. doi: 10.1126/science.1411571. [DOI] [PubMed] [Google Scholar]
- 42.Welch HCE, Coadwell WJ, Ellson CD, Ferguson GJ, Andrews SR, Erdjument-Bromage H, Tempst P, Hawkins PT, Stephens LR. P-Rex1, a PtdIns(3,4,5)P3- and Gβγ-regulated guanine-nucleotide exchange factor for Rac. Cell. 2002;108:809–821. doi: 10.1016/s0092-8674(02)00663-3. [DOI] [PubMed] [Google Scholar]
- 43.Biddlecome GH, Berstein G, Ross EM. Regulation of phospholipase C-β1 by Gq and m1 muscarinic cholinergic receptor. Steady-state balance of receptor-mediated activation and GTPase-activating protein-promoted deactivation. J. Biol. Chem. 1996;271:7999–8007. doi: 10.1074/jbc.271.14.7999. [DOI] [PubMed] [Google Scholar]
- 44.Chidiac P, Markin VS, Ross EM. Kinetic control of guanine nucleotide binding to soluble Gαq. Biochem. Pharmacol. 1999;58:39–48. doi: 10.1016/s0006-2952(99)00080-5. [DOI] [PubMed] [Google Scholar]
- 45.Brooks SPJ, Storey KB. Bound and determined: A computer program for making buffers of defined ion concentrations. Anal. Biochem. 1992;201:119–126. doi: 10.1016/0003-2697(92)90183-8. [DOI] [PubMed] [Google Scholar]
Associated Data
This section collects any data citations, data availability statements, or supplementary materials included in this article.