Abstract
Purpose
To assess the reproducibility of MDCT-measured forced expiratory tracheal collapse in healthy volunteers.
Methods and Materials
Fourteen healthy, non-smoking volunteers (6 M, 8 F, mean age = 48.7 ± 13.8 yrs) underwent repeat imaging 1 year after baseline imaging of tracheal dynamics employing the same scanner and technique (64-MDCT, 40 mAs, 120 kVp, and 0.625 mm detector collimation) with spirometric monitoring of total lung capacity and forced exhalation. Cross-sectional area (CSA) of the trachea was measured 1 cm above the aortic arch at end-inspiration and dynamic expiration, and percentage (%) expiratory reduction in tracheal lumen was calculated. Measurements were compared between baseline (Yr1) and repeat imaging (Yr2) using correlation coefficients and Bland-Altman plots.
Results
Mean end-inspiratory CSA was 255.3 ± 56 mm2 at Yr1 and 255.1 ± 52 mm2 at Yr2; mean dynamic expiratory CSA was 125.6 ± 60 mm2 at Yr1 and 132.1 ± 58 mm2 at Yr2; and mean % expiratory reduction was 51.7 ± 18% at Yr1 and 48.7 ± 19% at Yr2. Mean differences between Yr1 and Yr2 values were 0.2 mm2 for end-inspiratory CSA, 6.5 mm2 for dynamic expiratory CSA, and 3.0 % for percentage expiratory reduction. There was excellent correlation between the Yr1 and Yr2 measures of end-inspiratory CSA (R2 = 0.97, p <.001), dynamic expiratory CSA (R2 = 0.89, p <.001) and % expiratory reduction (R2 = 0.86, p <.001).
Conclusion
MDCT measurements of forced expiratory tracheal collapse in healthy volunteers are highly reproducible over time.
Keywords: tracheomalacia, MDCT, reproducibility
Introduction
Multidetector-row CT (MDCT) paired end-inspiratory and dynamic expiratory imaging has been increasingly used to evaluate expiratory tracheal dynamics in both health and disease [1-5]. In particular, this technique has been shown to be comparable to the reference standard of bronchoscopy for diagnosing tracheomalacia [1, 4] and has been used to monitor progression and response to treatment of this condition [5, 6].
The use of MDCT for monitoring progression and response to treatment is based upon an assumption that this method is reproducible over time. However, to our knowledge, this assumption has not been previously tested. Therefore, our purpose was to assess the reproducibility of MDCT- measured dynamic expiratory tracheal collapse.
Materials and Methods
Study population
This prospective study was approved by our institutional review board and performed in compliance with HIPPA guidelines. In 2008, following written informed consent, 51 healthy volunteers were enrolled into a study designed to provide normative data of forced expiratory tracheal collapse using MDCT [7]. Enrollment criteria included healthy individuals between 25 and 75 years of age, with normal spirometry results and no history of respiratory symptoms, cigarette smoking, or risk factors for tracheomalacia. Fourteen of these same asymptomatic, healthy volunteers were randomly selected (by choosing names at regular intervals from a consecutive list of the original group of volunteers) to undergo repeat MDCT imaging 1 year later for the purpose of assessing the reproducibility of measurements over time. The baseline data from year 1 for these 14 volunteers were included in the previous publication [7].
Imaging technique
At baseline and follow up, participants were imaged using the same 64-MDCT scanner (Light Speed VCT; General Electric Medical Systems, Milwaukee, WI) and identical imaging parameters (120 kVp, 40 mAs, 0.625 mm collimation, 0.5 sec gantry rotation, pitch of 1.375, and 10 cm field of view). Sequential acquisitions were acquired at end-inspiration and during forced exhalation (dynamic expiration) with active respiratory coaching and spirometric monitoring by a respiratory physiologist. Images were reconstructed at 2.5 mm collimation with 1.25 mm reconstruction intervals in a standard algorithm and transferred to a PACS workstation for analysis of the airway lumen [7, 8].
CT Analysis
Baseline CT measurements were recorded in 2008 and have been previously reported as part of a larger normative data study [7]. Follow-up CT measurements were performed in 2009 by the same radiologist without comparison to the baseline measurement values at the time of measurement.
All CT scans were analyzed by a fellowship-trained, thoracic radiologist with 12 years experience in interpreting dynamic MDCT studies of the trachea. For both baseline and follow-up examinations, the tracheal lumen was assessed at a standard level 1 cm above the top of the aortic arch on both end-inspiratory and dynamic expiratory scans [5-10]. At this level, the cross-sectional area (CSA) of the tracheal lumen was measured using an electronic tracing tool on standard lung window settings (level, -650 HU; width, 1500 HU) [8, 9]. The tracheal CSA measurements recorded at baseline and at follow-up CT studies were used to calculate the percentage expiratory tracheal collapse.
Statistical Analysis
Descriptive data are reported as means and standard deviations (SD) for continuous variables. Correlation coefficients were calculated to assess the relationship between baseline (year 1 = Yr1) and follow-up (year 2 = Yr2) measurements of inspiratory and dynamic expiratory CSA and percentage expiratory collapse, and paired T tests were used to assess the significance of Yr1 - Yr2 differences. A Bland-Altman plot was used to visualize longitudinal differences between estimates of percentage expiratory collapse.
A p value of <0.05 was considered statistically significant. All analyses were performed using statistical software (SPSS, version 12; SPSS, Inc., Chicago, IL).
Results
Study population
Table 1 displays the descriptive data for the study population, which was comprised of 8 women and 6 men, with a mean age of 49 ± 14 years.
Table 1. Descriptive Features of the Study Population.
| Gender | 6M, 8F |
|---|---|
| Age (years) | 49 ± 14 |
| Height (cm) | 167 ± 10 |
| Weight (kg) | 73 ± 13 |
| FEV1 (% predicted) | 105 ± 13 |
| FEV1/FVC (% predicted) | 107 ± 8 |
Cross-sectional area of tracheal lumen
Table 2 displays the mean CSA measurements of the tracheal lumen at end-inspiration and forced exhalation at baseline (Yr1) and follow-up (Yr2) examinations. Figures 1 and 2 are examples that demonstrate similar measurements between Yr1 and Yr2 scans in patients at the low and high ranges of tracheal collapse, respectively At end-inspiration, the mean CSA was 255.3 ± 56 mm2 at Yr1 compared to 255.1 ± 52 mm2 at Yr2, a mean difference of 0.2 mm2 (P = .94). At dynamic expiration, the mean CSA was 125.6 ± 60 mm2 at Yr1 compared to 132.1 ± 58 mm2 at Yr2, a mean difference of 6.5 mm2 (P = .25). As shown in Figure 3, strong positive correlations were observed between baseline and follow-up CT measurements of end-inspiratory and dynamic expiratory CSA (R2 = 0.97 and 0.89, respectively, p < 0.01 for both correlations).
Table 2. Comparison of cross-sectional area and percentage expiratory collapse between measurements at year 1 (Yr1) and year 2 (Yr2).
| Upper Trachea | Yr 1 | Yr 2 | Mean Difference |
|---|---|---|---|
| INSP (mm2) | 255.3 ± 56 | 255.1 ± 52 | -0.2 |
| EXP (mm2) | 125.6 ± 60 | 132.1 ± 58 | -6.5 |
| Dynamic Collapse (%) | 51.7 ± 18 | 48.7 ± 19 | -3.0 |
Figure 1.
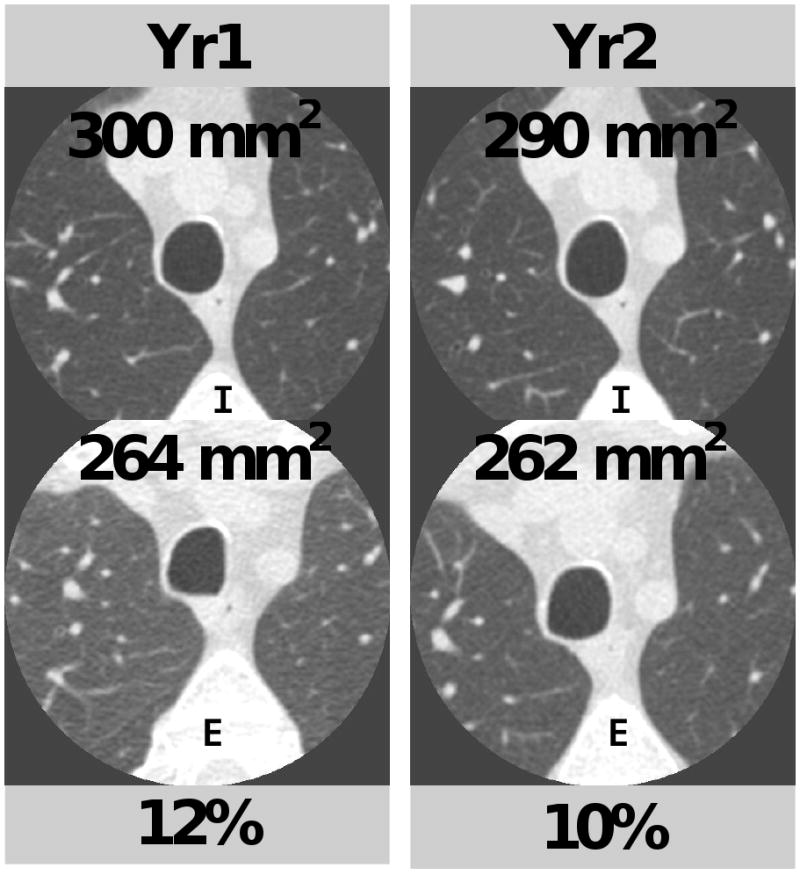
Comparison of cross-sectional area measurements and percentage collapse at year 1 (Yr1) and year 2 (Yr2) for end-inspiration (I) and dynamic expiration (E) in a 50 year-old man. Percentage expiratory collapse was 12% at Yr1 compared to 10% at Yr2.
Figure 2.
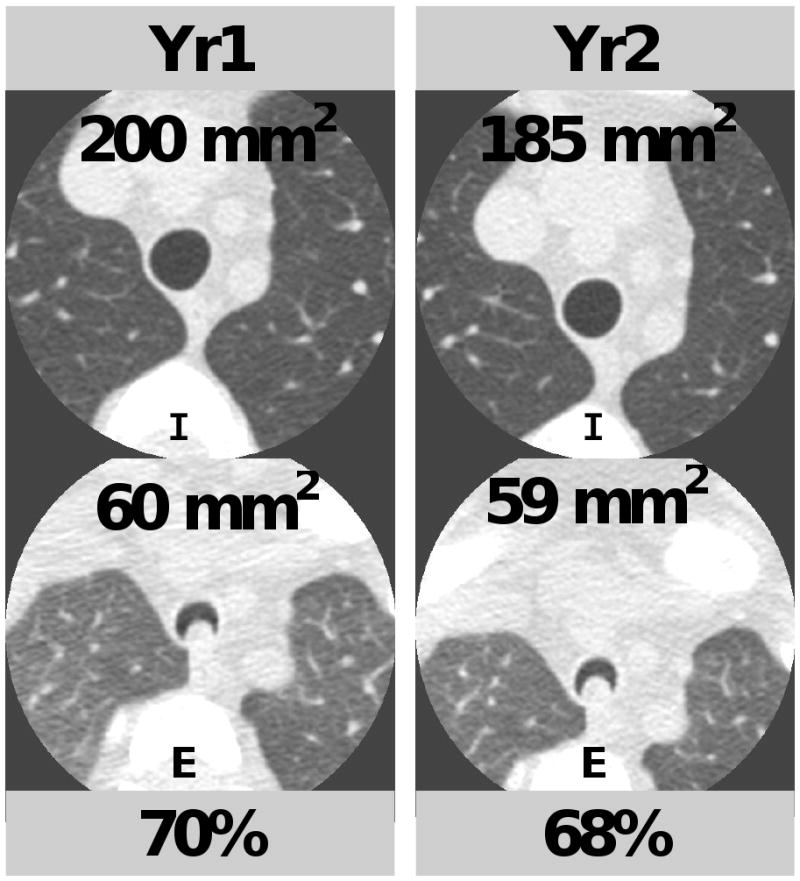
Comparison of cross-sectional area measurements and percentage collapse at year 1 (Yr1) and year 2 (Yr2) for end-inspiration (I) and dynamic expiration (E) in a 47 year-old woman. Percentage collapse was 70% at Yr1 compared to 68% at Yr2.
Figure 3.
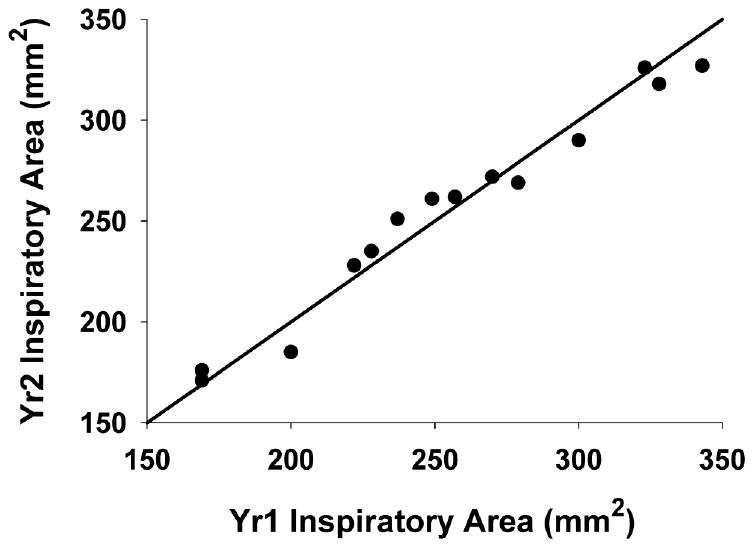
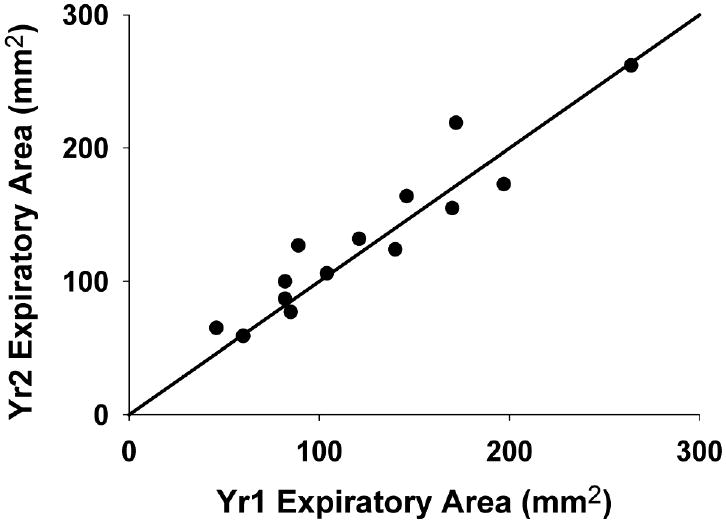
Scatterplots demonstrating the relationship between year 2 (Yr2) and year 1 (Yr1) measurements of tracheal luminal cross-sectional area (CSA) at end-inspiration (a) and dynamic expiration (b). Correlation coefficients (R2) are 0.97 and 0.89, respectively (p<0.01 for both correlations). The line in the graphs represents the line of identity.
Percentage expiratory tracheal collapse
The mean percentage expiratory collapse at Yr1 was 51.7 ± 18, compared to 48.7 ± 19 at Yr2, a mean difference of 3.0 (P = .13). A strong positive correlation was observed between baseline and follow-up CT measurements of percentage expiratory collapse (R2 = 0.86, p< 0.01). As shown in the Bland-Altman plot in Figure 3, there was a small variability of differences (95% confidence interval = ± 13%), and a similar degree of variability was observed at low and high ranges of tracheal collapse.
Discussion
In this study, we demonstrated that MDCT measurements of forced expiratory tracheal collapse in healthy volunteers are highly reproducible over time. Indeed, repeated measurements of expiratory tracheal collapse showed a small mean difference (3%), a small variability of differences, and a similar degree of variability at both low and high ranges of dynamic tracheal collapse.
Our results confirm that MDCT measurements of dynamic expiratory tracheal collapse are a reliable measure of physiologic tracheal dynamics in healthy individuals. Rather than simply assessing whether participants could reproduce the same level of tracheal collapse within the same study session, we sought to determine whether such measurements would be reproducible over time. In this way, our findings simulate a potential clinical scenario in which a patient with tracheomalacia might be followed yearly to monitor for progression or response to therapy.
By controlling several aspects of our study design, including the use of the same CT scanner, the same radiologist, consistent respiratory coaching, and the use of spirometric monitoring, the main uncontrolled independent variable was the voluntary expiratory efforts by our participants. Our study thus suggests that expiratory efforts are sufficiently reproducible when accompanied by active respiratory coaching and spirometric monitoring. Future studies would be helpful to address the reproducibility of this method while changing other variables, such as the type of CT scanner.
We acknowledge potential limitations of our study. First, our study population is relatively small. However, because of the wide range of tracheal collapse within our sample, as well as a similar mean level of collapse as our original larger cohort of 51 volunteers [7], we do not believe that the size of the study population limited our assessment. Second, we employed a manual electronic tracing technique for airway luminal measurements rather than a fully automated technique. Our rationale is that automated techniques have not been validated for measuring non-spherical airway lumen shapes that are typically observed during forced exhalation. We emphasize that the manual tracing technique that we have used in this study has been previously shown to have excellent agreement between observers and between CT and bronchoscopy [2, 4].
In summary, MDCT measurements of forced expiratory tracheal collapse in healthy volunteers are highly reproducible over time. These results represent an essential, incremental step toward the future use of this technique in the longitudinal assessment of patients with tracheomalacia.
Figure 4.
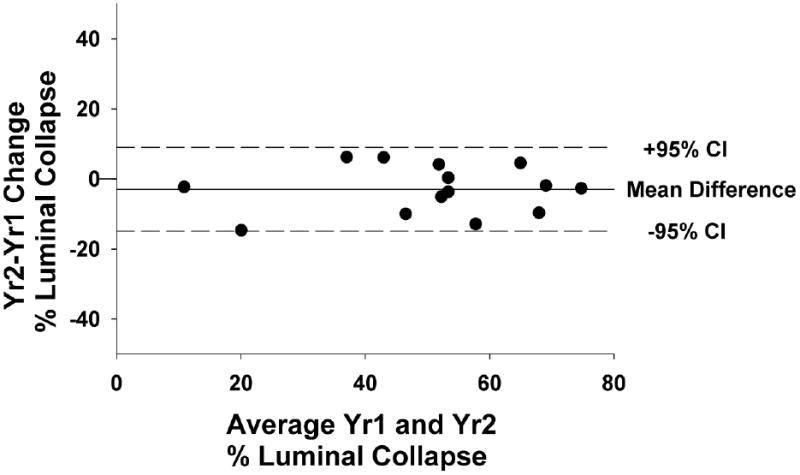
Bland-Altman plot. Change in % expiratory luminal collapse is plotted against the average of Year 1 (Yr1) and Year 2 (Yr2) % expiratory luminal collapse. Bold horizontal line represents mean difference (-3%), and dashed horizontal lines represent the 95% confidence interval range (± 13%) [CI = confidence interval].
Footnotes
Publisher's Disclaimer: This is a PDF file of an unedited manuscript that has been accepted for publication. As a service to our customers we are providing this early version of the manuscript. The manuscript will undergo copyediting, typesetting, and review of the resulting proof before it is published in its final citable form. Please note that during the production process errors may be discovered which could affect the content, and all legal disclaimers that apply to the journal pertain.
References
- 1.Gilkeson RC, Ciancibello LM, Hejal RB, Montenegro HD, Lange P. Tracheobronchomalacia: dynamic airway evaluation with multidetector CT. AJR. 2001;176:205–210. doi: 10.2214/ajr.176.1.1760205. [DOI] [PubMed] [Google Scholar]
- 2.Ferretti GR, Jankowski A, Perrin MA, et al. Multi-detector CT evaluation in patients suspected of tracheobronchomalacia: comparison of end-expiratory with dynamic expiratory volumetric acquisitions. Eur J Rad. 68(2):340–346. doi: 10.1016/j.ejrad.2007.08.029. [DOI] [PubMed] [Google Scholar]
- 3.Sverzellati N, Rastelli A, Chetta A, et al. Airway malacia in chronic obstructive pulmonary disease: prevalence, morphology and relationship with emphysema, bronchiectasis and bronchial wall thickening. Eur Radiol. 2009;19:1669–1678. doi: 10.1007/s00330-009-1306-9. [DOI] [PubMed] [Google Scholar]
- 4.Lee KS, Sun ME, Ernst A, et al. Comparison of dynamic expiratory CT with bronchoscopy in diagnosing airway malacia. Chest. 2007;131:758–764. doi: 10.1378/chest.06-2164. [DOI] [PubMed] [Google Scholar]
- 5.Baroni RH, Ashiku S, Boiselle PM. Dynamic-CT evaluation of the central airways in patients undergoing tracheoplasty for tracheobronchomalacia. AJR. 2005;184:1444–1449. doi: 10.2214/ajr.184.5.01841444. [DOI] [PubMed] [Google Scholar]
- 6.Lee KS, Ashiku SK, Ernst A, et al. Comparison of expiratory CT abnormalities before and after tracheoplasty surgery for tracheobronchomalacia. J Thorac Imaging. 2008;23:121–126. doi: 10.1097/RTI.0b013e3181653c41. [DOI] [PubMed] [Google Scholar]
- 7.Boiselle PM, O'Donnell C, Bankier AA, et al. Tracheal collapsibility of healthy volunteers during forced expiration: assessment with MDCT. Radiology. 2009;252:255–262. doi: 10.1148/radiol.2521081958. [DOI] [PMC free article] [PubMed] [Google Scholar]
- 8.Zhang J, Hasegawa I, Feller-Kopman D, Boiselle PM. Dynamic expiratory volumetric CT imaging of the central airways: comparison of standard-dose and low-dose techniques. Acad Radiol. 2003;10:719–724. doi: 10.1016/s1076-6332(03)80117-4. [DOI] [PubMed] [Google Scholar]
- 9.Baroni RH, Feller-Kopman D, Nishino M, et al. Tracheobronchomalacia: comparison between end-expiratory and dynamic expiratory CT for evaluation of central airway collapse. Radiology. 2005;235:635–641. doi: 10.1148/radiol.2352040309. [DOI] [PubMed] [Google Scholar]
- 10.Stern EJ, Graham CM, Webb WR, Gamsu G. Normal trachea during forced expiration: dynamic CT measurements. Radiology. 1993;187:27–31. doi: 10.1148/radiology.187.1.8451427. [DOI] [PubMed] [Google Scholar]


