Abstract
This paper proposes a new method for feature extraction and recognition of epileptiform activity in EEG signals. The method improves feature extraction speed of epileptiform activity without reducing recognition rate. Firstly, Principal component analysis (PCA) is applied to the original EEG for dimension reduction and to the decorrelation of epileptic EEG and normal EEG. Then discrete wavelet transform (DWT) combined with approximate entropy (ApEn) is performed on epileptic EEG and normal EEG, respectively. At last, Neyman–Pearson criteria are applied to classify epileptic EEG and normal ones. The main procedure is that the principle component of EEG after PCA is decomposed into several sub-band signals using DWT, and ApEn algorithm is applied to the sub-band signals at different wavelet scales. Distinct difference is found between the ApEn values of epileptic and normal EEG. The method allows recognition of epileptiform activities and discriminates them from the normal EEG. The algorithm performs well at epileptiform activity recognition in the clinic EEG data and offers a flexible tool that is intended to be generalized to the simultaneous recognition of many waveforms in EEG.
Keywords: EEG, Principal component analysis, Factor analysis, Epileptiform activity, Discrete wavelet transform, Approximate entropy
Introduction
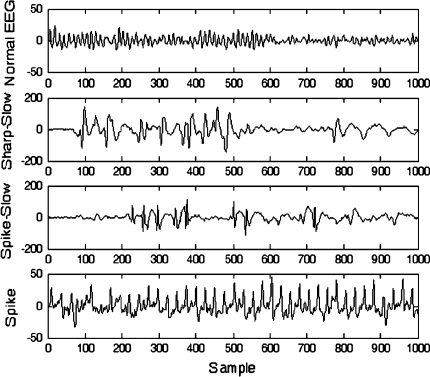
Diagnosis of neurological disorders is based on the detection of typical pathological patterns in electroencephalogram (EEG). Epilepsy is one of the most common neurological diseases and it may be caused by many pathological processes of genetic or acquired origins. The presence of epileptiform activities (sharp wave, spike wave, spike-and-slow wave and sharp-and-slow wave) in EEG supports the diagnosis of epilepsy (IFSECN 1974). Figure 1 gives out examples for the four types of waves, a spike wave, a sharp-and-slow wave and a spike-and-slow wave, which consists of a sharp or spike wave followed by a slow wave. The main difficulty in EEG analysis is how to distinguish these epileptiform activities from the normal ones, such as alpha rhythm at 8–12 Hz, eye movement and blink. Traditionally epilepticform activities can be visually inspected from EEG signals by highly experienced physicians. However, this process is a time-consuming task in case of long EEG recordings. So, rapid detection and recognition of epileptiform activity would give a great help to quantitative analysis and interpretation.
Fig. 1.
Sample EEG signals from normal subjects and epileptic patients
Research in automatic detection of epileptiform activities began in the 1970s and various algorithms addressing this problem have been presented (Gotman 1999). Methods for automatic detection of epileptiform activities may depend on the identification of various patterns such as amplitude, rhythmic activity or EEG flattening (Harding 1993). Several algorithms have been developed based on spectral (Srinivasan et al. 2005) or wavelet features (Adeli et al. 2003; Subasi 2007) and spatial context, (Dingle et al. 1993; Argoud et al. 2006). Chaotic features (Kannathal et al. 2005a) such as correlation dimension (Lerner 1996), Lyapunov exponents (Güler et al. 2005) and entropy (Kannathal et al. 2005b) have also been proposed to characterize the EEG signal. These features can then be used to classify the EEG signal by decision trees (Polat and Günes 2007), ANNs (Güler et al. 2005) and support vector machine (SVM) (Derya Übeyli 2008).
Most of the epileptiform activity detection schemes consist of two stages. In the first stage, features are extracted from the original EEG data using time domain, frequency domain or time–frequency domain methods. Since the EEG is non-stationary in general, it is most appropriate to use time–frequency domain methods like the wavelet transform (WT) for feature extraction. It provides both time and frequency information of a signal thus it is possible to get and localize features in the data such as the epileptiform activity accurately. In Ocak (2009), the method of wavelet transform combined with approximate entropy is used for feature extraction.
In the second stage of the epileptiform activity detection schemes, features extracted from the EEG are used for classifier to differentiate normal and epileptic EEG. However, the classification performance is mostly dependent on the features that are being used to characterize the original EEG. Therefore, optimal selection of the feature plays a very important role in the performance of a classifier.
One of the important problems of automatic detection is the amount of EEG data. Most of the detection methods are designed to be applied to one channel of the EEG, and thus do not consider the EEG processing speed as well as how to reduce the amount of EEG data. Multi-dimension methods exploit the relationship between the different channels. And it is also helpful to compress EEG data and improve the speed of automatic detection system. The detection methods based on independent component analysis (ICA) and principal component analysis (PCA) are multi-dimension methods. The method in Ossadtchi et al. (2004) is applied to MEG, based on source analysis using ICA for multiple signal classification. In Pockett et al. (2007), the method takes advantage of the information on the topography of ERPs. The detection is performed by searching for focal epileptiform activity using principal component analysis and dipole source model in Pockett et al. (2007). The method in Hoey et al. (2000) is useful for searching for focal activity in EEG signal but results in a low detection performance for epileptiform activity.
In order to improve the recognition rate as well as to reduce the computation cost, a novel intelligent recognition method based on PCA, ApEn and DWT is proposed. In this study, 8-channel EEG data are compressed by PCA and electrode location of epileptiform activity is quickly completed by factor analysis. Then, features are extracted from the EEG data using discrete wavelet transform (DWT), which is demonstrated to be the most promising feature extraction method. Normal and epileptic EEG segments are decomposed into several sub-bands through DWT. ApEn values of the detail wavelet coefficients are used as features for classifier. ApEn is a measure of the predictability and regularity of a time series that have been applied to EEG for sleep analysis (Acharya et al. 2005), identification of the burst suppression patterns and anesthetic depth monitoring (Bruhn et al. 2000a, b). ApEn is not only showed to help understand EEG dynamics (Diambra et al. 2001), but also is effectively used in epileptiform activity detection (Kannathal et al. 2005b). At last, Neyman–Pearson criteria are applied to classify epileptic EEG from normal ones. The relationship of detection rate versus false detection rate is obtained which shows that the proposed approach has a strong data compression and fast processing ability. Moreover, it has a high accuracy and low false detection rate. Figure 2 shows the structure of the feature extraction and recognition method based on PCA combined with ApEn.
Fig. 2.
Structure of the extraction and recognition method based on PCA combined with ApEn
Theory and algorithm
Principal component analysis
PCA is a powerful transform method, (de Cheveigné and Simon 2007; Palaniappan and Ravi 2006). It can transform source data into feature data linear with smaller dimension whereas the variance of the feature data is maximal. Through transforming, higher dimension feature space can be transformed into lower dimension principal component space to cut down the cost of computation. PCA is a way of identifying patterns in data, and expressing the data in order to highlight their similarities and differences. Since it is difficult to find patterns when the data are in high dimension, PCA is a useful statistical technique for analyzing data that has found application in the fields such as face recognition, image compression and biomedical signal processing (Chawla et al. 2006). Besides, another main advantage of PCA is that you can find the patterns in the data, and compress the data by reducing the number of dimensions without losing much information. The idea to use PCA is due to the fact that, in most of the EEG data, there is a large amount of redundant information unnecessary for diagnostic applications.
Suppose x = (x1, x2,…,xM)′ are M × 1 vectors, xi is row vector of N points
Step 1: 
Step 2: subtract the mean: 
Step 3: compute covariance matrix
 |
Step 4: compute the eigenvalues of C:λ1 > λ2 > … > λN.
Step 5: compute the eigenvectors of C:u1, u2,…, uN.
Step 6: get the relationship of principal components and original variables
 |
Using PCA compression, recognizable reconstruction of a given signal may be achieved by summing the contributions of only first few basis vectors which contain most of the energy (Chawla et al. 2006). The eigenvectors and associated eigenvalues are derived from the particular different sets through a linear-algebra decomposition process (Chawla et al. 2006).
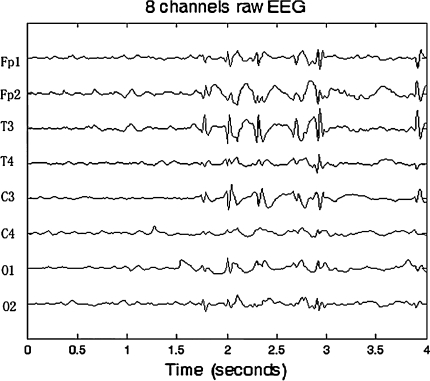
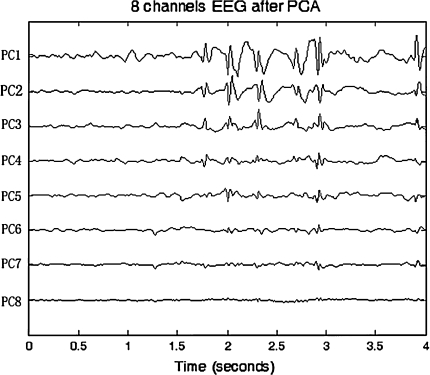
Figures 3 and 4 show the original EEG signals recorded from 8 electrodes (Fp1, Fp2, T3, T4, C3, C4, O1 and O2) with a sampling rate of 128 Hz and EEG principal components after PCA. In Fig. 3, we can observe that EEG recordings of some channels such as T3 and C3 have obvious epilepticform activity. From the principal components (PCs) in Fig. 4, we can clearly find the first few principal components extracted from epilepticform activity. Then, the first problem is how to choose the principal components, that is how to choose K. We use the following criteria:
 |
where  is eigenvalues of covariance matrix
  . Usually, the threshold is 0.85. The second problem is how to interpret the location of epileptic signal on electrode from the principal components or give the relation of principal components with original EEG signal. Factor loading of principal components resolves the problem. Factor loading is defined by:
 |
where  and
and  are principal component and original signal, respectively,
  is corresponding coefficient vector.
Fig. 3.
Original EEG signal from 8 electrodes containing epileptic wave
Fig. 4.
Principal components of Fig 3 after PCA
Table 1 gives the factor loading of the first two principal components with the original 8 channels’ EEG signals. The largest values of factor loading for PC1 and PC2 are 0.92419 and 0.98499, respectively. It indicates that PC1 and PC2 reflect information of T3 and C3, respectively. The analysis result is consistent with what we observed from Figs. 3 and 4. Therefore, it is helpful to use PCA not only for dimension reduction and EEG data compression, but also for rapid epilepticform activity localization. Moreover, it proves that PCA can perform EEG analysis in real-time due to the characteristics of reduction of EEG data storage and computation cost. It is useful for automatic diagnosis in clinical application.
Table 1.
Factor loading of the first two principal components (pcs) with 8 channels EEG signals
| Channel | PC1 | PC2 |
|---|---|---|
| Fp1 | 0.77706 | −0.10142 |
| Fp2 | 0.89 | −0.033565 |
| T3 | 0.92419 | −0.1243 |
| T4 | −0.32999 | −0.31784 |
| C3 | −0.093568 | 0.98499 |
| C4 | −0.69095 | −0.23418 |
| O1 | −0.73745 | −0.1746 |
| O2 | −0.55609 | −0.49955 |
Processing of EEG using DWT
Mallat (1998) presented the concept of multi-resolution analysis when he constructed an orthogonal wavelet basis. It makes multi-resolution characters of wavelet visual in space, and gives a way of constructing orthogonal wavelet basis and a fast algorithm of wavelet transform, i.e. Mallat algorithm.
In the second step of the proposed epilepticform activity detection method, the EEG signals after PCA are analyzed using DWT. Today, wavelets are also widely used in EEG processing. Because the optimal resolution for analyzing epilepticform activity corresponds to the frequency band 4–32 Hz (Subasi 2006), a third level wavelet decomposition is utilized to EEG data at the 128 Hz sampling frequency for both normal subjects and epileptic patients. The corresponding frequency sub-bands of decomposed signals are listed in Table 2.
Table 2.
Categorization of decomposed EEG signal into three sub-bands with corresponding frequency distribution at sampling frequency of 128 Hz
| Decomposed signal | Frequency band (Hz) |
|---|---|
| D1 | 32–64 |
| D2 | 16–32 |
| D3 | 8–16 |
| A3 | 4–8 |
In this representation, the coefficients D1, D2, D3, and A3 present the frequency content of the original EEG. Usually, short duration of sharp and spike waves are considered in clinic application. Therefore, we focus on sub-band 1, 2 and 3 to analyze epileptic EEG signals. Daubechies 4 (DB4) is chosen as a basic function to decompose the EEG signals into three sub-bands to get the desired frequency resolution.
Approximate Entropy (ApEn) Estimation
In the third step, ApEn values of the detail coefficients (D1, D2 and D3) at each level of the wavelet decomposition are computed. The “approximate entropy” is a family of statistic, which is introduced to quantify the creation of information in a time series. A low value of the entropy indicates that the time series is deterministic; contrarily, a high value indicates randomness. ApEn, unlike Shannon’s entropy, takes into account the temporal order of points in a time sequence; so it is a preferred measure of randomness or regularity (Ocak 2009).
Formally, given N data points from a time series {x(n)} = x(1), x(2),…,x(N), one should follow these steps to compute ApEn (Pincus 2001):
1. Form  vectors
  defined by:
 |
2. Define the distance between  and
and  ,
,  , as the maximum absolute difference between their respective scalar components,
 |
1 |
3. For a given  , count the number of
  so that
  , denoted as
  .
.
Then, for i = 1,…,N − m + 1,
 |
2 |
4. Compute the natural logarithm of each  , and average it over
  ,
,
 |
3 |
5. Increase the dimension to  . Repeat steps 1–4 and get
  and
and  .
.
6. ApEn is given by the formula:
 |
4 |
ApEn has been used to characterize different biomedical signals (Pincus 2001), such as ECG and EEG signals. In particular, it discriminates atypical EEG signals from normative counterparts. The usefulness of ApEn in epileptic seizure prediction has been suggested (Radhakrishnan and Gangadhar 1998).
The ApEn value is obviously related to the assignment of m and r. Although m and r are important in determining the outcome of ApEn, no guideline exists for optimizing their values. To calculate ApEn, Pincus took  , r = 0.1–0.2 × std in practices (the std is the standard deviation of a time series of
  data points). In this way, a small
  value (short templates) and large
  value (wide tolerance) are selected to improve the accuracy of entropy estimate within limits that produce good statistical reproducibility for ApEn (Abásolo et al. 2008).
It can be noticed from the above definition that ApEn (2, r, N) reflects the difference in the time series between the probability of the segments of two neighborhood points and that of three neighborhood points. It reveals the likelihood of creating a new mode when the vector dimension increases from 2 to 3, which displays the irregularity of the curve.
In this step, for computing the ApEn, we choose  and
and  , respectively based on suggestions by Pincus. For comparison purposes, ApEn values of D1, D2 and D3 coefficients are computed for all EEG data sets. Significant difference is found between the ApEn values of the healthy subjects and the epileptic patients.
Experimental results
Epileptic components of EEG have different characteristics in different resolution detail signals. In this paper, ApEn is used to qualitatively analyze the different detail signals. The aim is to find a generalization which can distinguish the normal and epileptic EEG through the differences of the complexity of epileptic EEG based on consistent experience or results.
In the study, the EEG data required are collected at Changhai Hospital Attached to the Second Military Medical University, Shanghai, China. The EEG data are recorded from 8 electrodes (Fp1, Fp2, T3, T4, C3, C4, O1, O2) attached by collodion on each subject’s scalp according to the International 10–20 system of electrode placement. Each electrode is referenced to a common reference electrode that averages the electrical activity at all electrodes. The electrical activity at the common average reference electrode is considered to be near zero, and therefore reflects the electrical activity at the active electrodes fairly accurately. The sampling frequency of EEG data sets is 128 Hz and resolving power of the data is 16 bit. We choose two experimental groups: there are 55 segments from five epileptic patients in the first group, which consist of sharp-and-slow wave, spike-and-slow wave and spike. In the other group, we choose 60 segments from four healthy subjects. Each segment consists of 8-channel EEG signals.
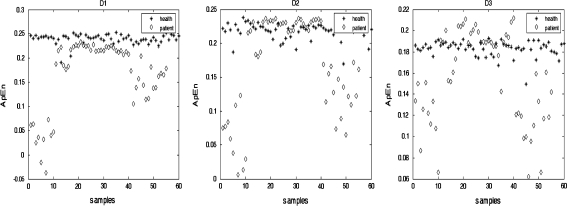
PCA is applied to EEG segments for two groups, concerning the data compression and feature extraction. Two test segments are analyzed by PCA. The first segment showed in Fig. 3 is taken from epileptic EEG. The second segment is a normal EEG signal. The eigenvalues of principal components for both segments are given in Table 3. The largest eigenvalues of the two segments after PCA are 1,212.4 and 690.4, respectively. In terms of PCA as a measure of feature extraction, this means the largest eigenvalue of epileptic EEG segment is evidently greater than the one of normal EEG segment. Therefore, the first principal component (PC1) of each segment is chosen as the feature extraction. Whereafter, each PC1 of two groups is decomposed into 3 sub-bands using DWT. Estimate values of ApEn are taken from the detail coefficients (D1, D2 and D3) for all the PC1s. Figure 5 shows distribution of the ApEn values D1, D2 and D3 of the two groups.
Table 3.
Eigenvalues of principal components fro epileptic EEG and normal EEG
| Principal components | Eigenvalues | |
|---|---|---|
| Epileptic EEG | Normal EEG | |
| PC1 | 1,212.4 | 690.4 |
| PC2 | 357.11 | 26.88 |
| PC3 | 202.39 | 9.1112 |
| PC4 | 120.15 | 7.3075 |
| PC5 | 114.18 | 4.147 |
| PC6 | 55.54 | 2.7651 |
| PC7 | 35.913 | 1.6563 |
| PC8 | 16.105 | 0.72031 |
Fig. 5.
Distribution of ApEn with different resolution from two groups
As expected, distributions of ApEn from normal EEG and epileptic EEG are different (Ocak 2009; Wang et al. 2009b). The analysis of ApEn shows that the ApEn of high-frequency detail signals at the 128 Hz sampling frequency, such as D1 can obviously distinguish epileptic patients from healthy subjects, but the ApEn of lower-resolution signals, such as D2 and D3 from two groups tends to be uniform and can not distinctively classify the subjects of two groups. To estimate the ApEn of different resolution detail coefficients from two groups, a T-test is performed. The values of P are 7.6105e-010, 4.1072e-006 and 2.0323e-005. It indicates that the difference of ApEn values of high-resolution detail coefficients between the normal EEG and the epileptic EEG is evident. High-frequency detail signal at the sampling frequency 128 Hz contains more energy of epileptiform activity, therefore the irregularity estimation of high-frequency detail signal can be considered to distinguish epileptiform activity from those of healthy subjects easily.
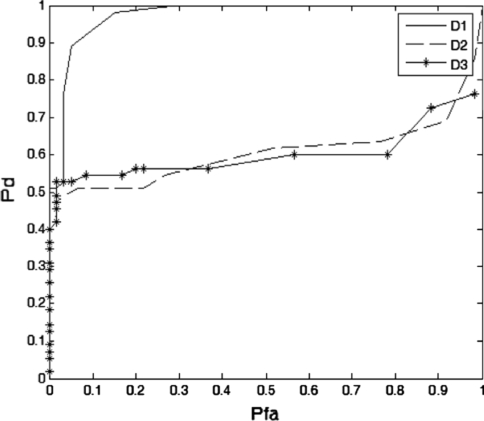
Then the recognition of epileptiform activity is based on the method by applying a threshold to the ApEn values by Neyman-Pearson criteria. Signals with ApEn less than the threshold are classified as epileptic EEG and signals with ApEn greater than or equal to the threshold are classified as normal EEG. Figure 6 gives the detection rate vs. false detection rate for D1, D2, and D3 signals.
Fig. 6.
Detection rate vs. false detection rate for D1, D2 and D3
In Fig. 6, the finding is that D1 outperforms D2 and D3 in recognizing epileptic EEG from the normal EEG. It proves that the energy of epileptic signal concentrates on D1 at the sampling frequency of 128 Hz by wavelet decomposition, and this can also be proved by observing Fig. 5 and the P value calculated above. This finding is consistent with the result reported in, (Ocak 2009; Wang et al. 2009b).
Recognition results of two groups are shown in Table 4. It is clear that low false detection rate is usually demanded in clinical application. Lower false detection rate is obtained at the cost of lower detection rate. For example, 98.182% detection rate is requested when 15% false detection rate is reached in D1 sub-band. Even now, it is sure that the method has the power to perform high detection rate and low false detection rate.
Table 4.
Detection results for two groups
| Sub-band | Detection rate (%) | False detection rate (%) |
|---|---|---|
| D1 | 89.091 | 5 |
| D2 | 50.909 | 6.6667 |
| D3 | 52.727 | 5 |
Then, a comparative analysis is carried out between the proposed method based on PCA and method, (Wang et al. 2009a, b) without PCA procedure. The clinical data in the experiment are used to extract and recognize epileptiform activity with the method in, (Wang et al. 2009a, b). As the result mentioned earlier, here D1 also gets the advantage over D2 and D3 in recognizing epileptiform activity from normal EEG at 128 Hz sampling frequency. The optimal detection rate is 89.474% with 5% false detection rate in D1 sub-band. The result demonstrates that it is almost as accurate as that has obtained with the proposed method, but with much more effort. However, the PCA preprocessing is used for data compression to improve the recognition efficiency. The efficacy of the algorithm lies on the fact that PCA promotes data compression, which would help the physicians to examine and analyze the EEG signals more accurately. For example, the first principal component looks like a certain electrode EEG signal. In PCA decomposition, the first few components represent larger energies in the EEG signals. In this study, the first principal component is chosen as extracted feature, and the compression ratio is 7/8. PCA would further increase the compression ratio especially for more electrodes EEG analysis, such as for 128 electrodes EEG signals.
Conclusions
Principal component analysis applied in this study is used for dimensionality reduction and data compression. Moreover, it is capable for transient event i.e. epileptiform activity localization. Whereas ApEn combined with DWT is utilized for recognition of epileptform activity from normal EEG signals. If there are more measured signals, PCA is expected to provide better results. Compared with clinical EEG data analysis, there are much more advantages and efficiency in epileptic EEG recognition. (1) PCA is used for dimension reduction and decorrelation to operate EEG data compression procedure. (2) The decrease on the EEG data storage and computation cost guarantees the real-time processing of EEG signals. (3) It provides a quick and effective method to locate epileptiform activity on the electrode by factor analysis. (4) The method based on PCA and wavelet transform combined with ApEn promise a high detection rate and a low false detection rate. (5) Compared with other approaches, this method reduces the amount of data and slows down computation cost without loss of recognition rate. And these advantages give de-emphasis on the demands of system processing speed and data storage. Therefore, it provides a strong theoretic foundation of realizing a portable and desirable detection system for epileptic EEG. To conclude, the proposed method can be well accepted for EEG data compression and recognition of epileptic EEG signals.
Acknowledgments
Projects (10872068, 10672057) supported by National Natural Science Foundation of China (NSFC).
References
- Abásolo D, Escudero J, Hornero R, Gómez C, Espino P. Approximate entropy and auto mutual information analysis of the electroencephalogram in Alzheimer’s disease patients. Med Biol Eng Comput. 2008;46:1019–1028. doi: 10.1007/s11517-008-0392-1. [DOI] [PubMed] [Google Scholar]
- Acharya RU, Faust O, Kannathal N, Chua T, Laxminarayan S. Non-linear analysis of EEG signals at various sleep stages. Comput Methods Programs Biomed. 2005;80:37–45. doi: 10.1016/j.cmpb.2005.06.011. [DOI] [PubMed] [Google Scholar]
- Adeli H, Zhou Z, Dadmehr N. Analysis of EEG records in an epileptic patient using wavelet transform. J Neurosci Methods. 2003;123:69–87. doi: 10.1016/S0165-0270(02)00340-0. [DOI] [PubMed] [Google Scholar]
- Argoud F, Azevedo F, Neto J, Grillo E. SADE3: an effective system for automated detection of epileptiform events in long-term EEG based on context information. Med Biol Eng Comput. 2006;44:459–470. doi: 10.1007/s11517-006-0056-y. [DOI] [PubMed] [Google Scholar]
- Bruhn J, Röpcke H, Hoeft A. Approximate Entropy as an Electroencephalographic Measure of Anesthetic Drug Effect during Desflurane Anesthesia. Anesthesiology. 2000;92:715–726. doi: 10.1097/00000542-200003000-00016. [DOI] [PubMed] [Google Scholar]
- Bruhn J, Röpcke H, Rehberg B, Bouillon T, Hoeft A. Electroencephalogram Approximate Entropy Correctly Classifies the Occurrence of Burst Suppression Pattern as Increasing Anesthetic Drug Effect. Anesthesiology. 2000;93:981–985. doi: 10.1097/00000542-200010000-00018. [DOI] [PubMed] [Google Scholar]
- Chawla M, Verma H, Vinod K (2006) ECG modeling and QRS detection using principal component analysis. In Proceedings of IET international conference, paper no. 04, MEDSIP06, Glasgow, UK
- Cheveigné A, Simon JZ. Denoising based on time-shift PCA. J Neurosci Methods. 2007;165:297–305. doi: 10.1016/j.jneumeth.2007.06.003. [DOI] [PMC free article] [PubMed] [Google Scholar]
- Derya Übeyli E. Analysis of EEG signals by combining eigenvector methods and multiclass support vector machines. Comput Biol Med. 2008;38:14–22. doi: 10.1016/j.compbiomed.2007.06.002. [DOI] [PubMed] [Google Scholar]
- Diambra L, Malta CP, Capurro A, Fernández J. Nonlinear structures in electroencephalogram signals. Physica A. 2001;300:505–520. doi: 10.1016/S0378-4371(01)00352-1. [DOI] [Google Scholar]
- Dingle AA, Jones RD, Carroll GJ, Fright WR. A multi-stage system to detect epileptiform activity in the EEG. IEEE Trans Biomed Eng. 1993;40(12):1260–1268. doi: 10.1109/10.250582. [DOI] [PubMed] [Google Scholar]
- Gotman Jean. Automatic detection of seizures and spikes. J Clin Neurophysiol. 1999;16(2):130–140. doi: 10.1097/00004691-199903000-00005. [DOI] [PubMed] [Google Scholar]
- Güler NF, Übeyli ED, Güler I. Recurrent neural networks employing Lyapunov exponents for EEG signals classification. Expert Syst Appl. 2005;29:506–514. doi: 10.1016/j.eswa.2005.04.011. [DOI] [Google Scholar]
- Harding GW. An automated seizure monitoring system for patients with indwelling recording electrodes. Electroencephalogr Clin Neurophysiol. 1993;86:428–437. doi: 10.1016/0013-4694(93)90138-L. [DOI] [PubMed] [Google Scholar]
- Hoey GV, Vanrumste B, Walle RVD,Boon P,Lemahieu I (2000) Detection and localization of epileptic brain activity using an artificial neural network for dipole source analysis. In Proceedings of the EUSIPCO2000 conference, Tampere, Finland
- IFSECN A glossary of terms most commonly used by clinical electroencephalographers. Electroencephalogr Clin Neurophysiol. 1974;37:538–548. doi: 10.1016/0013-4694(74)90099-6. [DOI] [PubMed] [Google Scholar]
- Kannathal N, Acharya UR, Lim CM, Sadasivan PK. Characterization of EEG–A comparative study. Comput Methods Programs Biomed. 2005;80:17–23. doi: 10.1016/j.cmpb.2005.06.005. [DOI] [PubMed] [Google Scholar]
- Kannathal N, Choo ML, Acharya UR, Sadasivan PK. Entropies for detection of epilepsy in EEG. Comput Methods Programs Biomed. 2005;80:187–194. doi: 10.1016/j.cmpb.2005.06.012. [DOI] [PubMed] [Google Scholar]
- Lerner DE. Monitoring changing dynamics with correlation integrals: Case study of an epileptic seizure. Physica D. 1996;97:563–576. doi: 10.1016/0167-2789(96)00085-1. [DOI] [Google Scholar]
- Mallat S (1998) Multiresolution representation and wavelets, Ph.D. thesis, Pennsylvania University
- Ocak H. Automatic detection of epileptic seizures in EEG using discrete wavelet transform and approximate entropy. Expert Syst Appl. 2009;36:2027–2036. doi: 10.1016/j.eswa.2007.12.065. [DOI] [Google Scholar]
- Ossadtchi A, Baillet S, Mosher JC, Thyerlei D, Sutherling W, Leahy RM. Automated interictal spike detection and source localization in magnetoencephalography using independent components analysis and spatio-temporal clustering. Clin Neurophysiol. 2004;115:508–522. doi: 10.1016/j.clinph.2003.10.036. [DOI] [PubMed] [Google Scholar]
- Palaniappan R, Ravi KVR. Improving visual evoked potential feature classification for person recognition using PCA and normalization. Pattern Recogn Lett. 2006;27:726–733. doi: 10.1016/j.patrec.2005.10.020. [DOI] [Google Scholar]
- Pincus SM. Assessing serial irregularity and its implications for health. Ann N Y Acad Sci. 2001;954:245–267. doi: 10.1111/j.1749-6632.2001.tb02755.x. [DOI] [PubMed] [Google Scholar]
- Pockett S, Whalen S, McPhail A, Freeman W. Topography, independent component analysis and dipole source analysis of movement related potentials. Cogn Neurodyn. 2007;1:327–340. doi: 10.1007/s11571-007-9024-y. [DOI] [PMC free article] [PubMed] [Google Scholar]
- Polat K, Günes S. Classification of epileptiform EEG using a hybrid system based on decision tree classifier and fast Fourier transform. Appl Math Comput. 2007;187:1017–1026. doi: 10.1016/j.amc.2006.09.022. [DOI] [Google Scholar]
- Radhakrishnan N, Gangadhar BN. Estimating regularity in epileptic seizure time-series data. IEEE Eng Med Biol. 1998;17:89–94. doi: 10.1109/51.677174. [DOI] [PubMed] [Google Scholar]
- Srinivasan V, Eswaran C, Sriraam N. Artificial Neural Network Based Epileptic Detection Using Time-Domain and Frequency-Domain Features. J Med Syst. 2005;29:647–660. doi: 10.1007/s10916-005-6133-1. [DOI] [PubMed] [Google Scholar]
- Subasi A. Automatic detection of epileptic seizure using dynamic fuzzy neural networks. Expert Syst Appl. 2006;31:320–328. doi: 10.1016/j.eswa.2005.09.027. [DOI] [Google Scholar]
- Subasi A. EEG signal classification using wavelet feature extraction and a mixture of expert model. Expert Syst Appl. 2007;32:1084–1093. doi: 10.1016/j.eswa.2006.02.005. [DOI] [Google Scholar]
- Wang C-m, Zou J-z, Zhang J, Zhang Z-s, Zhang C-m (2009a) Classifying Detection of Epileptic EEG Based on Approximate Entropy in Wavelet Domain, in 2009 2nd International Conference on Biomedical Engineering and Informatics, Tianjin, pp 560–564
- Wang C, Zou J, Zhang J, Zhang Z. (2009b) Automatic Detection of Epileptic Sharp-slow by Wavelet and Approximate Entropy, in 2009 IEEE international conference on information and automation, Zhuhai/Macau, pp 1269–1273


