

Abstract
In this paper, a modeling approach combining in vivo intravascular ultrasound (IVUS) imaging, computational modeling, angiography, and mechanical testing is proposed to perform mechanical analysis for human coronary atherosclerotic plaques for potential more accurate plaque vulnerability assessment. A 44-slice in vivo IVUS dataset of a coronary plaque was acquired from one patient, and four 3-D models with fluid–structure interactions (FSIs) based on the data were constructed to quantify effects of anisotropic vessel properties and cyclic bending of the coronary plaque on flow and plaque stress/strain conditions. Compared to the isotropic model (model 1, no bending, no axial stretch), maximum stress-P1 (maximum principal stress) values on the cut surface with maximum bending (where applicable) from model 2 (anisotropic, no bending, no stretch), model 3 (anisotropic, with bending, no stretch), and model 4 (anisotropic with bending and stretch) were, respectively, 63%, 126%, and 345% higher than that from model 1. Effects of cyclic bending on flow behaviors were modest (5%–15%). Our preliminary results indicated that in vivo IVUS-based FSI models with cyclic bending and anisotropic material properties could improve the accuracies of plaque stress/strain predictions and plaque vulnerability assessment. Large-scale patient studies are needed to further validate our findings.
Index Terms: Atherosclerotic plaque rupture, cardiovascular, coronary artery, fluid-structure interaction (FSI), intravascular ultrasound (IVUS)
I. Introduction
Assessing atherosclerotic plaque vulnerability based on limited in vivo patient data has been a major challenge in cardiovascular research and clinical practice. Considerable advances in medical imaging technology have been made in recent years to identify vulnerable atherosclerotic carotid plaques in vivo with information about plaque components including lipid-rich necrotic pools, plaque cap, calcification, intraplaque hemorrhage, loose matrix, thrombosis, and ulcers, subject to resolution limitations of current technology [1]–[6]. It is commonly believed that plaque rupture may be linked to critical stress/strain conditions. Image-based computational models have been developed by several groups combining mechanical analysis with image technology, aiming to identify critical flow and stress/strain conditions that may be related to possible plaque rupture [7]–[19]. However, existing in vivo 3-D multi-component plaque models are mostly for carotid plaques based on MRI data. Similar models for coronary plaques based on in vivo image data are lacking in the current literature because clinical recognition of vulnerable coronary plaques has remained challenging and beyond the capability of noninvasive diagnostic imaging such as MRI and computed tomography (CT) coronary angiography [20]. Coronary imaging is more difficult because of the following reasons.
Coronary arteries move with the pumping heart constantly.
Coronary arteries have smaller dimensions compared to carotid arteries.
Coronary arteries are not as accessible as carotid arteries.
Plaque components are not reliably delineated as in carotid arteries.
Traditional invasive X-ray angiography can delineate luminal stenosis, but not plaque components. Intravascular ultrasound (IVUS) imaging with tissue characterization represents the most promising and potentially clinically relevant technique for recognition of vulnerable plaques in vivo in patients [2].
We propose a modeling approach to develop 3-D in vivo IVUS-based models with fluid–structure interactions (FSIs), cyclic bending, and anisotropic properties to perform mechanical analysis for human coronary atherosclerotic plaques. Cyclic bending represents the bending caused by cardiac motion and is included in the FSI model to evaluate its impact on stress conditions in coronary plaques. An anisotropic material model will be used for the vessel for more realistic modeling, and more accurate computational flow and stress/strain predictions.
In vivo IVUS is a catheter-based approach that has been used for two decades for direct in vivo imaging of coronary, carotid, and peripheral arteries [1], [20]. Using a miniaturized transducer at its tip, the IVUS catheter emits a high-frequency ultrasound signal and receives a reflected signal from tissue, providing an image of the atherosclerotic plaque with its composition [4]. Lipid-filled “soft” plaque, dense fibrous “hard” plaque, calcification, and thrombosis have all been identified on IVUS images [1], [4]. Attempts of using ultrasound and IVUS techniques have been made to quantify vessel motion, plaque development, mechanical properties, and vessel wall structure, even to predict rupture locations [5], [21]–[25]. Liang et al. developed techniques to estimate transverse strain tensors in the artery wall using IVUS image registration [8]. For mechanical testing of tissue properties, Lee et al. performed mechanical analysis of human coronary plaques based on histological data, and studied mechanical properties of fibrous tissues and lesion lipid pools [26]–[28]. Holzapfel et al. measured anisotropic mechanical properties for tissue components of human atherosclerotic plaques using 107 samples from nine human iliac arteries [29], [30]. In McCord and Ku’s experiments, fresh human artery rings were cyclically bent for 500 000 cycles. The cyclic bending stresses induced intimal rupture that may mimic artery fatigue and plaque rupture [31].
Recent advances in the processing of raw IVUS RF data by spectral analysis of the ultrasound backscatter signals have provided the capability to discriminate different tissue types in native plaque, a process called “virtual histology” (VH) [2]. Rather than relying on the amplitude of the echo signal as in traditional IVUS, IVUS-VH uses autoregressive modeling to analyze the frequencies of echo signals to obtain a signal profile that can be matched to one of a known tissue type. Via statistical classification trees, IVUS-VH sorts the RF data based on combinations of spectral parameters into one of four tissue types, allowing in vivo identification of four discrete atherosclerotic plaque components: fibrotic, fibro-fatty, necrotic, and dense calcified tissue [2]. This technique has been rigorously validated. In an ex vivo study comparing VH to histopathology in 277 regions of interest from 88 plaques imaged in 51 explanted left anterior descending (LAD) coronary arteries imaged under physiology pressure, Nair et al. observed predictive accuracies for the detection of each plaque components of 89% (fibrotic, fibro-fatty, and necrotic tissues) to 93% calcification. More recent studies [3], [32] have shown even better accuracy, from 93% to 97%, and IVUS-VH is now widely accepted as a reliable method for the differentiation of plaque components with lipid and fibrous tissue in a clinical setting. In this paper, IVUS-VH (we will use IVUS for IVUS-VH when no confusion may arise) images were used as the starting dataset in our model construction process.
II. Data Acquisition, Models, and Methods
A. IVUS Protocol
A 44-slice in vivo 3-D IVUS dataset was acquired during cardiac catheterization from one patient (female; age: 50) after voluntary informed consent. For IVUS image acquisition, a 20-MHz, 2.9-F phased-array Eagle Eye Gold IVUS catheter (Volcano Corporation, Rancho Cordova, CA) was positioned 2 cm beyond a stenosis in the middle segment of the right coronary artery. A pullback at 0.5 mm/s was performed to 2 cm proximal to the lesion for recording digitized cross-sectional IVUS images. The catheter orientation is fixed at the proximal interface with the imaging console, and the distal tip is constrained by the coronary guide wire that remains stationary in the monorail lumen. The catheter pullback is accomplished while avoiding torque application to the proximal catheter to avoid catheter rotation as much as possible. During the pullback, the IVUS B-mode images were recorded and then reconstructed from the RF data, and contour detection was performed using automated VH software (version 3.1) on a Volcano s5 Imaging System (Volcano Corporation) to provide geometrical and compositional output. Forty four slices covering the plaque region were used for model construction (Fig. 1). A two-step filtering–smoothing process was employed to convert the noisy IVUS-VH data to slices with smoothed plaque component contours for finite-element model construction.
Fig. 1.
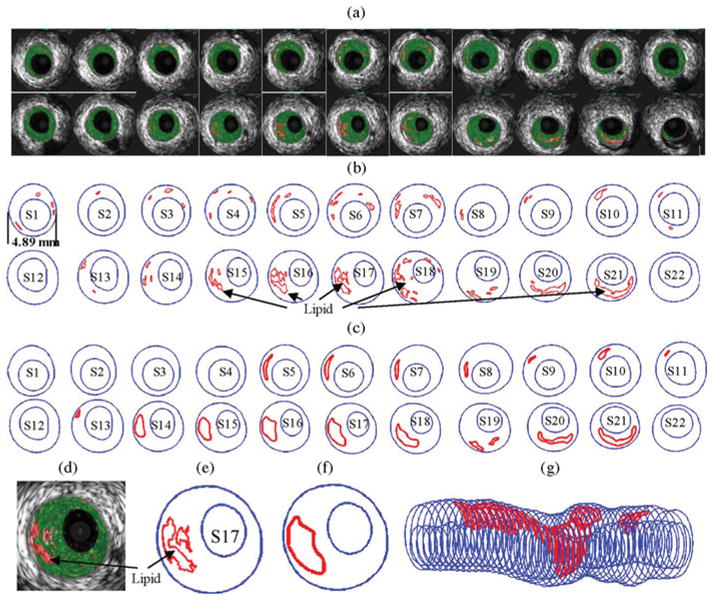
IVUS segmentation data preparation process: selected 22 slices from the 44-slice IVUS dataset with: (a) IVUS-VH; (b) contour plots directly from APIA; (c) after smoothing and ready for FE model construction; (d)–(f) enlarged view; and (g) 3-D plaque geometry showing lipid core locations.
Step 1
An in-house software atherosclerotic plaque imaging analysis (APIA) written in MATLAB was used to automatically generate contour plots of lumen, vessel out-boundary, and plaque components with a smoothing filter to remove outliers with pixel size <5 (IVUS system interpolated apparent pixel size was 20 μm). This filtering dimension (5 pixels = 0.1 mm) was empirically determined based on visual inspection of all VH images. Fibrous and fibro-fatty tissues were merged and treated as a uniform fibrous tissue.
Step 2
The APIA-generated contour plots [Fig. 1(b)] were inspected slice by slice by the modeling group, and further, smoothing was applied to get slices ready for model construction. Isolated small components (like those in S1–S4) were removed. Similar to techniques used in MRI segmentations [6], components that are close to each other and with complex nonsmooth contours were combined and outlined using cubic splines [Fig. 1(c) and (e)–(f)]. Critical morphological features such as cap thickness were kept in the smoothing process. Fig. 1 shows 22 selected IVUS-VH and two-step contour plots from the 44-slice IVUS dataset, together with the 3-D geometry showing all 44 slices.
The traditional X-ray angiogram (Allura Xper FD10 System, Philips, Bothel, WA) was obtained prior to the pullback of the IVUS catheter to determine the location of the coronary artery stenosis in patients. Since this imaging modality can demonstrate the dynamic phasic changes of the coronary artery tree during the cardiac cycle with a high frame rate (30 frames/s), we used X-ray angiographic data for the determination of the stenosis segment movement and curvature (Fig. 2).
Fig. 2.
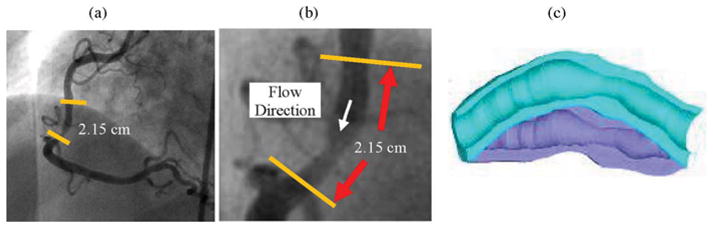
X-ray angiographic images and movies (30 frames/s) were used to determine location of the myocardium and patient-specific curvature variations. Flow direction is marked in (b). For this IVUS dataset, S44 is the inlet and S1 is the outlet. (a) Angiographic image showing location of the imaged coronary segment. (b) Enlarged view of the segment and flow direction. (c) Illustration of coronary vessel bending.
B. 3-D Reconstruction of Plaque Geometry and Component-Fitting Mesh-Generation Method
All segmented 2-D slices were read into ADINA input file; ADINA is a commercial finite-element package (ADI-NAR&D, Inc., Watertown, MA) used in this paper to construct and solve the FSI models. A 3-D plaque geometry was reconstructed following the procedure described by Tang et al. [17]. Since plaques have complex irregular geometries with component inclusions that are challenging for mesh generation, a component-fitting mesh-generation technique was developed to generate mesh for our models. Fig. 3 gives a simple illustration of the method. Each slice was first divided into component-fitting areas [called “surfaces” in ADINA; see Fig. 3(a) and (b)]. The neighboring slices were stacked to form volumes [Fig. 3(c)]. Four types of volumes (hexahedron, prism, pyramid, and tetrahedron) were used to form regular (hexahedron) volumes and special volumes when the component changes drastically from one slice to the next slice. Using this technique, the 3-D plaque domain was divided into hundreds of small “volumes” to curve-fit the irregular plaque geometry with plaque component inclusions. 3-D surfaces, volumes, and computational mesh were made under ADINA computing environment. For the plaque sample given in Fig. 1, the finite-element ADINA FSI solid model has 774 volumes, 20 124 elements (eight-node brick element), and 22 880 nodes. The fluid part has 86 volumes, 67 777 elements (four-node tetrahedral element), and 12 935 nodes. Mesh analysis was performed by decreasing mesh size by 10% (in each dimension) until solution differences were less than 2%. The mesh was then chosen for our simulations.
Fig. 3.
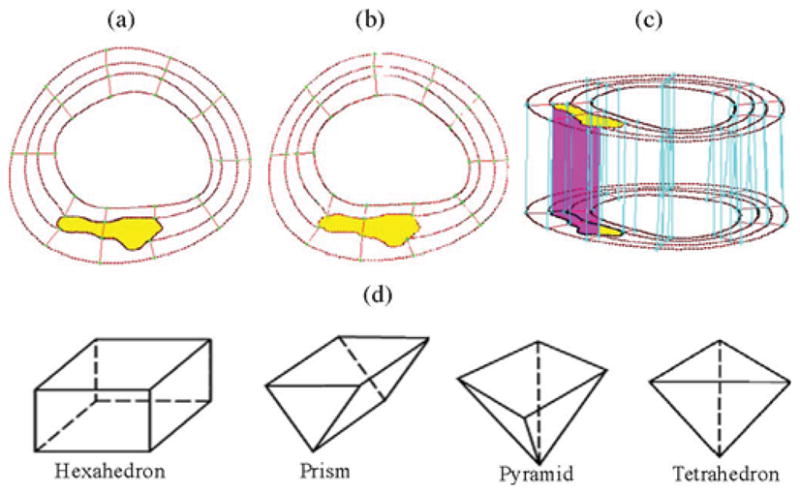
Component-fitting mesh-generation process. (a) and (b) Two slices with a lipid core inclusion (yellow) and numerically generated component-fitting curves and surfaces. (c) Component-fitting volumes formed by connection corresponding areas from stacking adjacent slices. (d) Four types of volumes to curve-fit components and complex geometry. Slice distance not to scale. (a) Slice A. (b) Slice B. (c) Stacking slices to form component-fitting volumes. (d) Four types of volumes.
C. FSI Models With Cyclic Bending and Boundary Conditions
3-D anisotropic and isotropic multicomponent FSI models were constructed to calculate flow and stress/strain distributions, and evaluate the effects of cyclic bending and anisotropic properties using the plaque sample shown in Fig. 1. Blood flow was assumed to be laminar, Newtonian, and incompressible. The Navier–Stokes equations with arbitrary Lagrangian–Eulerian formulation were used as the governing equations. Physiological pressure conditions were prescribed at both inlet and outlet (see Fig. 4). Cyclic bending was specified by prescribing periodic displacement at the lower edge of the vessel. Physiological pressure conditions were specified at the inlet and outlet of the vessel. Use of pressure conditions is preferred for FSI models to keep the vessel properly pressurized. The imposed curvature variation is given in Fig. 4(c) using the data of a human LAD coronary curvature variation data [33]. No-slip conditions and natural traction equilibrium conditions are assumed at all interfaces. Putting these together, we have
Fig. 4.
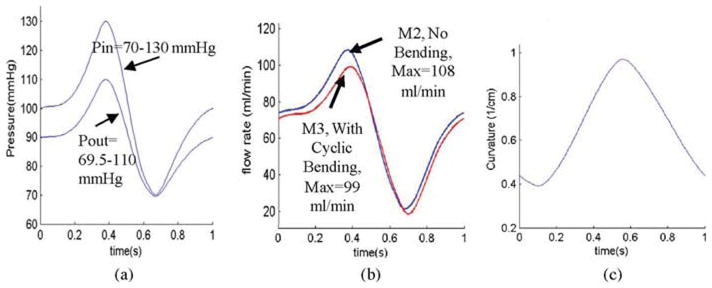
Model pressure, flow rate, and curvature conditions. (a) Simplified pressure profile for human coronary artery was scaled to 70–130 mmHg and used as the inlet (Pin). Down-stream pressure (Pout) was chosen so that the flow rate was within physiological range. (b) Flow rate corresponding to the prescribed pressure conditions with and without cyclic bending. (c) Imposed curvature conditions based on human coronary curvature variation data [33]. Model 2 (M2) and model 3 (M3) will be defined later. (a) Imposed pressure condition. (b) Flow rate, M2 and M3. (c) Imposed curvature variations in one cardiac cycle based human data.
| (1) |
| (2) |
| (3) |
| (4) |
| (5) |
| (6) |
| (7) |
| (8) |
where u and p are fluid velocity and pressure, respectively, ug is the mesh velocity, μ is the dynamic viscosity, ρ is density, Γ the vessel inner boundary, f •, j the derivative of the function f with respect to the jth variable, σ is the stress tensor (superscripts indicate different materials), ε is the strain tensor, v is the solid displacement vector, and superscript letters “r” and “s” were used to indicate different materials. For simplicity, all material densities were set to 1 g·cm−3 in this paper.
D. Mechanical Testing and Isotropic and Anisotropic Material Models
Since human coronary material properties are not available in the current literature, a cadaveric human coronary artery sample (male; age: 50) with some intimal thickening was obtained from Washington University Medical School to perform mechanical testing and obtain material data for our models. The fresh cadaveric coronary artery specimen was obtained 2 h prior to the fixing and autopsy, and shipped overnight to Worcester Polytechnic Institute for mechanical testing. After the connective tissue was removed, the artery was cut to open. Dumbbell-shaped strips of 2 mm width were cut in the axial and radial directions. The strips were cut from areas without obvious plaque blocks to avoid the disturbance to the experimental data. Pieces of waterproof sand paper were attached at the ends of each strip with cyanoacrylate adhesive. Then, two black markers were put in the central area for noncontact deformation measurement. Samples were submerged in a 37 °C thermostatic saline bath and mounted on a custom-designed device to perform uniaxial tests [34]. For each test, after three preconditioning cycles to a stretch ratio of 1.3, the sample was cycled two times with stretch ratio varying from 1.0 to 1.3 at a rate of 10%/min. Force was measured using an isometric torque transducer (0.15 N·m, Futek) attached to the sample via a 7.6-cm plexiglass arm extending out of the bath, yielding ±4 mN accuracy. Force and stretch ratio data were recorded with a rate of ten data points per second. Engineering stress was calculated by dividing force by the initial cross-sectional area of the sample measured with a micrometer (±10 μm). Measured circumferential and axial stress–stretch experimental data are given in Fig. 5 fit by stress–stretch curves derived from the anisotropic and isotropic material models. The 3-D nonlinear modified Mooney–Rivlin (M-R) isotropic and anisotropic models were used to describe the material properties of the vessel [35], [36]. The strain energy function for isotropic M-R model is given by
Fig. 5.
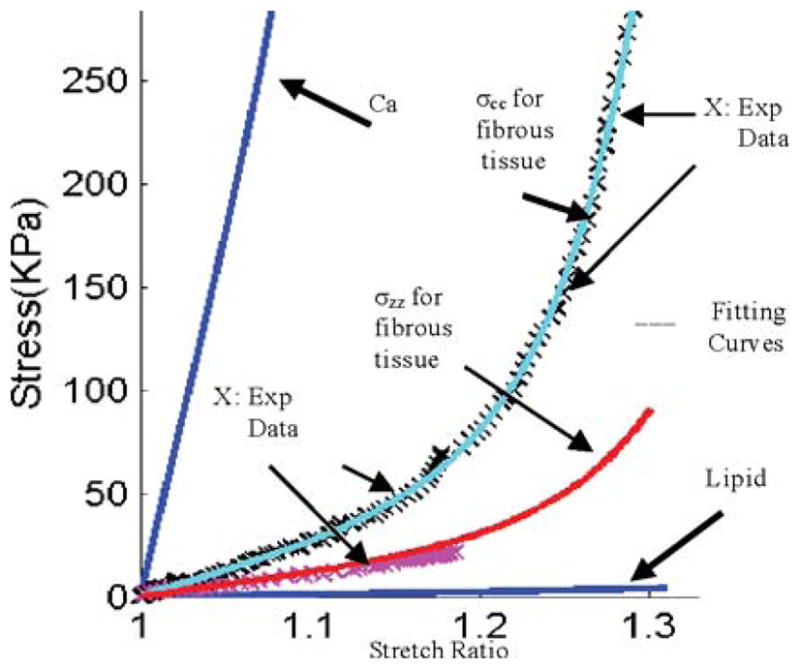
Experimentally measured axial and circumferential stress–stretch data (marked by ×) from one human coronary plaque sample and stress–stretch matching curves derived from the modified anisotropic M-R model [see (11)] for fibrous tissue (vessel). Stress–stretch curves for lipid and calcification were also shown.
| (9) |
| (10) |
where I1 and I2 are the first and second strain invariants, C = [Cij] = XT X is the right Cauchy–Green deformation tensor, X = [Xij] = [∂xi/∂aj], xi is the current position, ai is the original position [4], [5], and ci and Di, for i = 1, 2, are material parameters chosen to match our own experimental measurements. Using the modified M-R model available in AD-INA and adding an additional anisotropic term to (9), we have the anisotropic (transversely isotropic) strain energy density function for our anisotropic FSI model [29], [30], [35], [36]:
| (11) |
where I4 = Cij (nc)i (nc)j, Cij is the Cauchy–Green deformation tensor, nc is the circumferential direction of the vessel, and K1 and K2 are material constants [36]. A least-squares method was used to determine the parameter values in (11) to fit our experimental circumferential and axial stress–stretch data. Parameter values determined numerically are summarized in Table I. Fig. 5 shows that our model with parameters selected with this procedure fits very well with the measured experimental data. Our measurements are consistent with data available in the literature [29], [30]. Isotropic models were used for calcification and necrotic lipid-rich pool. Since tissue-specific material property data are not available, considering that calcification is much stiffer than fibrous tissue and that lipid core is much softer than fibrous tissue, parameter values in Table I were used. Parameter analyses were performed in our previous paper, showing that these assumptions were reasonable [17].
TABLE I.
Parameter Values for the Material Models Used in This Paper
| Model/Tissue Type | c1 (kPa) | D1 (kPa) | D2 | K1 (kPa) | K2 |
|---|---|---|---|---|---|
| Isotropic model fitting circumferencial exp data | 28.14 | 1.31 | 11.5 | ||
| Isotropic model fitting axial exp data | 14.07 | 0.655 | 9.2 | ||
| Anisotropic model for fibrous tissue fitting exp axial and circumferencial data | 8.29 | 0.907 | 3.1 | 8.82 | 3.70 |
| Isotropic model for lipid core | 0.5 | 0.5 | 0.5 | ||
| Isotropic model for calcification | 281.4 | 13.10 | 11.5 |
E. Solution Methods
The FSI models were solved by a commercial finite-element package ADINA (ADINA R&D, Inc., Watertown, MA). ADINA uses unstructured finite-element methods for both fluid and solid models. Nonlinear incremental iterative procedures were used to handle FSIs. A component-fitting mesh was made to fit the shape of each component, the vessel, and the fluid domain. Finer mesh was used for thin plaque cap and components with sharp angles to get better resolution and handle high-stress concentration behaviors. The governing finite-element equations for both the solid and fluid models were solved by the Newton–Raphson iteration method. More details of the models and solution methods are given in [17]–[19], [35], and [36].
III. Results
Four FSI models using the IVUS plaque sample given in Fig. 1 with different model assumptions were constructed to quantify effects of anisotropic properties, cyclic bending, and axial stretch on flow and stress/strain distributions: model 1 (M1, baseline), isotropic, no bending; model 2 (M2), anisotropic, no bending; model 3 (M3), anisotropic model with cyclic bending; and model 4 (M4) is the same as M3 with 10% axial stretch added. Fig. 6 gives plots of maximum principal stress (stress-P1) on the cut surface corresponding to maximum/minimum curvature conditions. Maximum stress-P1 and strain-P1 values on the cut surfaces corresponding to maximum/minimum pressure and maximum/minimum curvature are summarized in Table II. Details are given shortly.
Fig. 6.
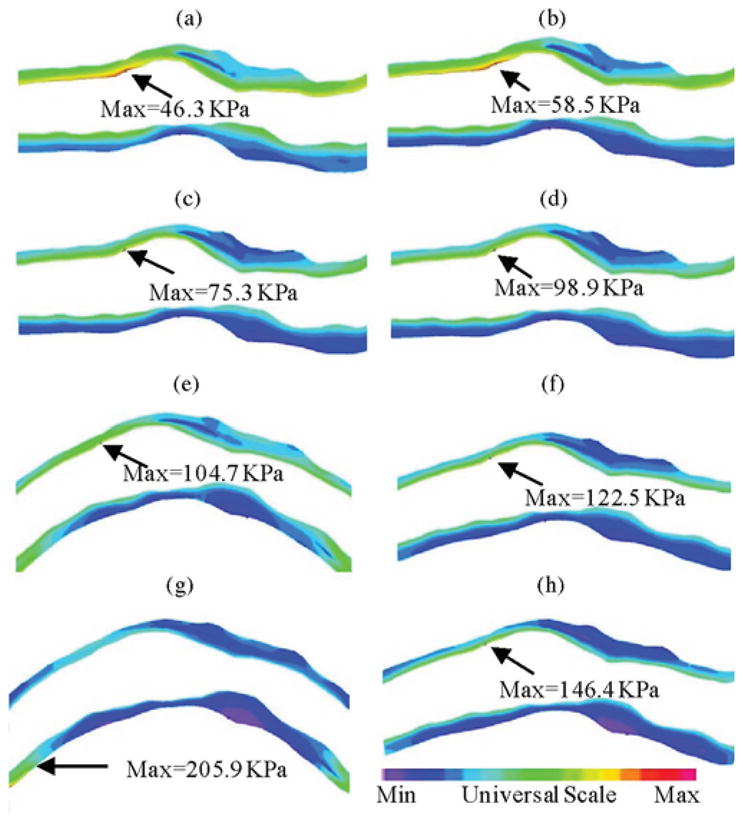
Stress-P1 at maximum (κ = 0.97 cm−1, Pin = 86 mmHg) and minimum (κ = 0.39 cm−1, Pin = 101 mmHg) bending (where applicable) from four models showing cyclic bending and anisotropic material properties have considerable effects on stress predictions. (a) M1, Pin = 86 mmHg, no bending. (b) M1, Pin = 101 mmHg, no bending. (c) M2, Pin = 86 mmHg, no bending. (d) M2, Pin = 101 mmHg, no bending. (e) M3, Pin = 86 mmHg, Max κ = 0.97 cm−1. (f) M3, Pin = 101 mmHg, Max κ = 0.39 cm−1. (g) M4, Pin = 86 mmHg, Max κ = 0.97 cm−1. (h) M4, Pin = 101 mmHg, Min κ = 0.39 cm−1.
TABLE II.
Maximum Values of Stress-P1 and Strain-P1 From the Four Models on the Cut Surface Showing Cyclic Bending and Anisotropic Material Properties Have Considerable Effects (From 60% to 419%) on Stress Predictions
| Model | Max Stress-P1 on Cut Surface | |||
|---|---|---|---|---|
| κ = 0.97 Pin = 86 |
κ = 0.76 Pin = 130 |
κ = 0.39 Pin = 101 |
κ = 0.88 Pin = 70 |
|
| M1 (isotropic, no-bending) | 46.3 (100 %) | 86.0 (100 %) | 58.5 (100 %) | 34.9 (100 %) |
| M2 (anisotropic, no bending) | 75.3 (163 %) | 153.8 (179%) | 98.9 (169 %) | 53.2 (152 %) |
| M3 (Anisotropic, with Bending) | 104.7 (226 %) | 205.6 (239 %) | 122.5 (209 %) | 75.4 (216 %) |
| M4 (aniso, Bend, 10 % axial; stretch) | 205.9 (445 %) | 222.6 (259 %) | 146.4 (250 %) | 142.5 (408%) |
| Max Strain-P1 on Cut Surface | ||||
| M1 (isotropic, no-bending) | 0.147 (100 %) | 0.204 (100 %) | 0.168 (100 %) | 0.124 (100 %) |
| M2 (anisotropic, no bending) | 0.300 (204 %) | 0.395 (194 %) | 0.339 (202 %) | 0.252 (203 %) |
| M3 (Anisotropic, with Bending) | 0.556 (378 %) | 0.483 (237 %) | 0.373 (222 %) | 0.509 (410 %) |
| M4 (aniso, Bend, 10 % axial stretch) | 0.722 (491 %) | 0.602 (295 %) | 0.447 (266 %) | 0.643 (519 %) |
Four time points chosen correspond to maximum/minimum curvatures (κ = 0.97/0.39) and pressure conditions (P = 130/70). Units: curvature κ: centimeters inverse; pressure: millimeters of mercury; stress: kilopascals.
A. Effects of Anisotropic Vessel Material Properties on Stress/Strain Distributions
Using M1 as the baseline model, Table II shows that maximum stress-P1 values from M2 corresponding to four different pressure conditions were 63%, 79%, 69%, and 52% higher than those values from M1, with higher percentage corresponding to higher pressure. The corresponding percentage increases for maximum strain-P1 values varied between 94% and 104%, roughly at 100% level.
B. Effects of Cyclic Bending on Stress/Strain Distributions
Comparing two anisotropic models M2 (no bending) and M3 (with bending), Table II shows that maximum stress-P1 values from M3 corresponding to four curvature conditions (κ = 0.97, 0.76, 0.39, and 0.88 cm−1) were 39%, 33.7%, 23.9%, and 41.7% higher than those values from M2, with higher percentage corresponding to greater curvature. The corresponding percentage increases for maximum strain-P1 values varied more at 85.3%, 22.2%, 10.0%, and 102%. Combining cyclic bending and anisotropic properties together, maximum stress-P1 values from M3 corresponding to κ = 0.97, 0.76, 0.39, and 0.88 cm−1 were, respectively, 226%, 239%, 209%, and 216% higher than those values from M1.
C. Effects of Axial Stretch on Stress/Strain Distributions
Maximum stress-P1 values from M4 (anisotropic with bending and axial stretch) corresponding to four different curvature conditions were 97%, 8%, 20%, and 89% higher than those values from M3 (anisotropic with bending, but no axial stretch), with higher percentage corresponding to higher curvature. The corresponding percentage increases for maximum strain-P1 values were 30%, 25%, 20%, and 26%, respectively. When compared to M1, the percentages were even higher (345% for stress and nearly 400% for strain).
D. Effects of Cyclic Bending on Flow Behaviors
Fig. 7 compares flow maximum shear stress (FMSS) and flow velocity from M2 and M3. Cyclic bending caused a modest 15% decrease in maximum FMSS, 5% decrease in maximum velocity, and 8.7% decrease in flow rate (99.0 mL/min from M3 versus 108.4 mL/min from M2; see Fig. 4). Since the plaque has a mild stenosis, no flow recirculation was observed.
Fig. 7.
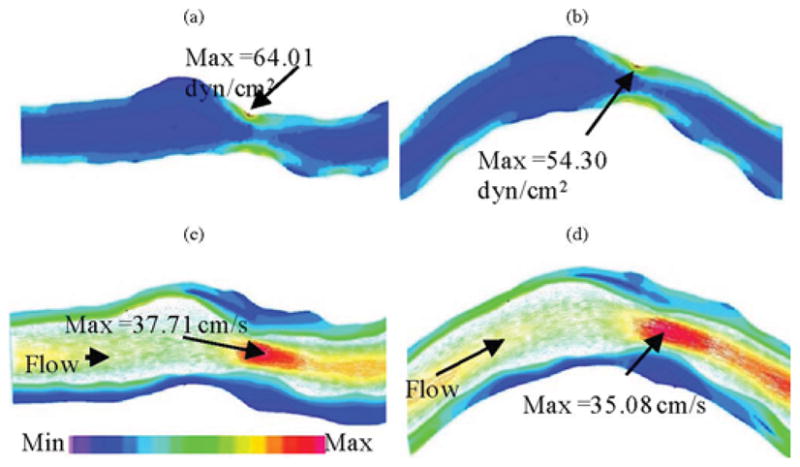
Comparison of FMSS and velocity plots from model 2 (anisotropic, no bending) and model 3 (anisotropic with bending), showing that cyclic bending has modest effects on flow velocity and maximum shear stress. No flow recirculation was observed. (a) M2, FMSS, Pin = 86 mmHg, no bending. (b) M3, FMSS, Pin = 86 mmHg, with bending, κ = 0.97 cm−1. (c) M2, Velocity, Pin = 86 mmHg, no bending. (d) M3, Velocity, Pin = 86 mmHg, κ = 0.97 cm−1.
IV. Discussion
A. Major Modeling Challenges for In Vivo IVUS-Based Coronary Plaque Models and Contributions of This Paper
Assessing coronary plaque vulnerability is difficult due to:
lack of gold standard for vulnerability assessment based on clinical data;
difficulty in acquiring patient-specific coronary plaque data;
lack of data bank for vessel morphology, pressure, plaque component material properties, and large number of plaque samples with desired characteristics (ruptured plaques and plaques with specific features) for proper statistical analysis;
lack of data at cellular level with plaque inflammation and cap erosion that are important for plaque analysis.
It is commonly believed that plaque vulnerability and rupture may be closely related to critical stress/strain conditions. Computational modeling is a necessary tool to calculate plaque stress/strain distributions.
Major controlling factors frequently investigated for plaque mechanical analysis and assessment include: 1) blood pressure; 2) plaque morphology and components; and 3) material properties. Based on 3-D in vivo IVUS patient-specific coronary plaque images, we are adding cyclic bending (curvature variation) and anisotropic properties into coronary plaque models to improve model accuracies. We believe that this is the first time such a comprehensive model is introduced for in vivo human coronary plaque modeling and mechanical analysis. While only one coronary plaque sample was used in this paper, we are quantitatively demonstrating that cyclic bending, anisotropic vessel material properties, and axial stretch should be included for accurate calculation of stress/strain conditions in coronary plaques. Multipatient studies with more plaque samples are being conducted and new findings will be reported as they become available.
B. Limitations of the Study and Potential Improvements
Some limitations of this study are as follows.
Patient-specific and tissue-specific material properties were not available for our study.
While the angiographic movie provided information for the position of the myocardium and partial information for curvature variations, two movies with different (preferably orthogonal) view angles are needed to reconstruct the 3-D motion of the coronary and provide accurate curvature variation information.
Some data such as zero-stress conditions (opening angle), multilayer vessel morphology, and material properties are not possible to measure noninvasively in vivo.
Tethering and interaction between the heart and vessel could not be included because these measurements are not currently available. A model coupling heart motion and coronary bending would be desirable when required data become available.
C. Plaque Mechanical Analysis by Adjusting Morphological Features
Plaque mechanical analysis by adjusting plaque morphological features such as lipid pool size and cap thickness has been performed in our previous studies. Investigation using this plaque yielded similar and parallel results. Results were omitted to keep the paper more focused. Multipatient studies are needed to further investigate clinical implications of different plaque features, cardiac motion, blood flow, and pressure for coronary plaques.
V. Conclusion
In vivo IVUS-based FSI models for human coronary plaques with cyclic bending and anisotropic material properties were introduced to improve accuracy of computational plaque stress/strain predictions, which may be useful for better plaque assessment. Our initial model comparison studies indicated that cyclic bending, anisotropic material properties, pulsating pressure, plaque structure, and axial stretch may affect critical stress/strain values in coronary plaques from 40% to 400% or more, depending on morphology, location, and contributing factors. Effects of cyclic bending on flow behaviors were limited. In vivo IVUS-based FSI models with cyclic bending and anisotropic material properties have the potential to improve accuracy of coronary plaque stress/strain predictions and plaque vulnerability assessment. More vigorous validation and large-scale patient studies with patient-specific material properties, pressure, and curvature data are needed to establish and further improve our model accuracies.
Acknowledgments
The authors would like to acknowledge the advice and guidance from Prof. M. Friedman at Duke University and Prof. R. Kamm at Massachusetts Institute of Technology.
This work was supported in part by the National Science Foundation (NSF)/National Institute of General Medical Sciences (NIGMS) Division of Mathematical Sciences (DMS)-0540684 and the National Institute of Health (NIH) R01 EB004759. The work of C. Yang was supported in part by a priority discipline grant of Beijing Normal University.
Biographies
Chun Yang received the B.A. and M.S. degrees in computational mathematics from Beijing University, Beijing, China, in 1988 ad 1991, respectively.
She is currently an Associate Professor of mathematics in the School of Mathematics, Beijing Normal University, Beijing. Her current research interests include nonlinear analysis, numerical analysis, biomathematics, partial differential equations, nonlinear geometry, computational modeling for cardiovascular systems, ventricle models, vulnerable plaques, and atherosclerosis progression.
Richard G. Bach received the M.D. degree from New York University (NYU) School of Medicine, New York, in 1984.
His postgraduate training included Internal Medicine Residency and Cardiology and Interventional Cardiology Fellowships at NYU Medical Center/Bellevue Hospital, New York. He is currently an Associate Professor of medicine at Washington University School of Medicine, St. Louis, MO. He is also the Medical Director of the Cardiac Intensive Care Unit, Barnes-Jewish Hospital, St. Louis. His current research interests include acute coronary syndromes, advanced coronary imaging techniques, and coronary physiology.
Dr. Bach is a Fellow of the American College of Cardiology and the Society for Cardiac Angiography and Interventions. He is also a member of the American Heart Association Scientific Councils on Basic Science and Clinical Cardiology.
Jie Zheng received the B.S. degree from the Electrical Engineering Department, Beijing University, Beijing, China, in 1986, and the Ph.D. degree in medical physics from the University of Cincinnati, Cincinnati, OH, in 1994.
He is currently an Assistant Professor at Mallinckrodt Institute of Radiology, Washington University School of Medicine, St. Louis, MO. His current research interests include myocardial oxygenation imaging and atherosclerotic plaque imaging in vivo.
Issam Ei Naqa (M’99) received the Ph.D. degree in electrical engineering from Illinois Institute of Technology, Chicago, in 2002, and the M.A. degree in biology science from Washington University, St. Louis, MO, in 2007.
He is currently an Assistant Professor in the Department of Radiation Oncology, Washington University. His current research interests include image processing, pattern recognition, machine learning, and treatment outcomes.
Dr. Naqa is a member of the American Association of Physicists in Medicine (AAPM) and the American Society for Therapeutic Radiology and Oncology (ASTRO).
Pamela K. Woodard received the M.D. degree from Duke University School of Medicine, Durham, NC.
She performed her Residency in radiology at Duke University, and took a Cardiothoracic Radiology Fellowship at Mallinckrodt Institute of Radiology, Washington University School of Medicine, St. Louis, MO, where she is currently an Associate Professor of radiology and the Co-Head of Advanced Cardiac Imaging (CT/MRI). Her current research interests include cardiovascular MRI/computed tomography (CT) imaging and the imaging of atherosclerotic plaque.
Dr. Woodard is a Fellow of the American College of Radiology, the American Heart Association, and the American College of Chest Physicians. She is the President of the North American Society for Cardiovascular Imaging (NASCI).

Zhongzhao Teng was born in Fuzhou, China. He received the B.Sc. degree in theoretical and applied mechanics, and the Ph.D. degree in fluid mechanics from Fudan University, Shanghai, China, in 1998 and 2003, respectively.
He is currently a Research Assistant Professor at Worcester Polytechnic Institute, Worcester, MA. His current research interests include material behavior of biological tissues and mechanical behavior of vulnerable atherosclerotic plaque.
Kristen Billiar received the B.S. degree in mechanical and aerospace engineering from Cornell University, Ithaca, NY, in 1991, and the Ph.D. degree in bioengineering from the University of Pennsylvania, Philadelphia, in 1998.
He is currently an Associate Professor in the Department of Biomedical Engineering, Worcester Polytechnic Institute, Worcester, MA, and an Adjunct Associate Professor in the Department of Surgery, University of Massachusetts Medical School, Worcester. His current research interests include tissue mechanics, mechanobiology, and tissue engineering.
Dalin Tang received the Ph.D. degree in applied mathematics from the University of Wisconsin- Madison, Madison, in 1988.
He is currently a Professor of mathematics and biomedical engineering at Worcester Polytechnic Institute, Worcester, MA. His current research interests include computational biomechanics and modeling, image-based modeling for cardiovascular diseases, ventricle models, fluid–structure interactions, vulnerable plaques, computer-aided surgical design, computational fluid dynamics, biofluids, biosolids, and nonlinear analysis.
Prof. Tang is a member of the American Society of Mechanical Engineers, the Biomedical Engineering Society, the American Heart Association, the International Atherosclerotic Society, the Council on Arteriosclerosis, Thrombosis and Vascular Biology, the Council on Basic Cardiovascular Sciences, the United States Association for Computational Mechanics, and the American Medical Society.
Contributor Information
Chun Yang, Email: yangchun@bnu.edu.cn, School of Mathematics, Beijing Normal University, Beijing 100875, China.
Richard G. Bach, Email: rbach@im.wustl.edu, Division of Cardiovascular Diseases, Washington University School of Medicine, St. Louis, MO 63110 USA, and also with the Cardiac Intensive Care Unit, Barnes-Jewish Hospital, St. Louis, MO 63108 USA
Jie Zheng, Email: zhengj@mir.wustl.edu, Mallinkcrodt Institute of Radiology, Washington University School of Medicine, St. Louis, MO 63110 USA.
Issam Ei Naqa, Email: ielnaqa@radonc.wustl.edu, Department of Radiation Oncology, Washington University, St. Louis, MO 63110 USA.
Pamela K. Woodard, Email: woodardp@mir.wustl.edu, Mallinkcrodt Institute of Radiology, Washington University School of Medicine, St. Louis, MO 63110 USA
Zhongzhao Teng, Email: zzteng@wpi.edu, Department of Mathematical Sciences, Worcester Polytechnic Institute, Worcester, MA 01609 USA.
Kristen Billiar, Email: kbilliar@wpi.edu, Department of Biomedical Engineering, Worcester Polytechnic Institute, Worcester, MA 01609 USA.
Dalin Tang, Email: dtang@wpi.edu, Department of Mathematical Sciences, Worcester Polytechnic Institute, Worcester, MA 01609 USA.
References
- 1.Chandran KB, Wahle A, Vigmostad SC, Olszewski ME, Rossen JD, Sonka M. Coronary arteries: Imaging, reconstruction, and fluid dynamic analysis. Crit Rev Biomed Eng. 2006;34(1):23–103. doi: 10.1615/critrevbiomedeng.v34.i1.20. [DOI] [PubMed] [Google Scholar]
- 2.Nair A, Kuban BD, Tuzcu EM, Schoenhagen P, Nissen SE, Vince DG. Coronary plaque classification with intravascular ultrasound radiofrequency data analysis. Circulation. 2002;106:2200–2206. doi: 10.1161/01.cir.0000035654.18341.5e. [DOI] [PubMed] [Google Scholar]
- 3.Nair A, Margolis MP, Kuban BD, Vince DG. Automated coronary plaque characterization with intravascular ultrasound backscatter: Ex vivo validation. Euro Intervention. 2007;3:113–120. [PubMed] [Google Scholar]
- 4.Kimura BJ, Bhargava V, DeMaria AN. Value and limitations of intravascular ultrasound imaging in characterizing coronary atherosclerotic plaque. Amer Heart J. 1995;130(2):386–396. doi: 10.1016/0002-8703(95)90457-3. [DOI] [PubMed] [Google Scholar]
- 5.Wahle A, Lopez JJ, Olszewski ME, Vigmostad SC, Chandran KB, Rossen JD, Sonka M. Plaque development, vessel curvature, and wall shear stress in coronary arteries assessed by X-ray angiography and intravascular ultrasound. Med Image Anal. 2006;10(4):615–631. doi: 10.1016/j.media.2006.03.002. [DOI] [PMC free article] [PubMed] [Google Scholar]
- 6.Yuan C, Mitsumori LM, Beach KW, Maravilla KR. Special review: Carotid atherosclerotic plaque: Noninvasive MR characterization and identification of vulnerable lesions. Radiology. 2001;221:285–299. doi: 10.1148/radiol.2212001612. [DOI] [PubMed] [Google Scholar]
- 7.Tang D. Wiley Encyclopedia of Biomedical Engineering. Hoboken, NJ: Wiley; 2006. Flow in healthy and stenosed arteries; pp. 1–16. Article 1525. [Google Scholar]
- 8.Liang Y, Zhu H, Friedman MH. Estimation of the transverse strain tensor in the arterial wall using IVUS image registration. Ultrasound Med Biol. 2008;34(11):1832–1845. doi: 10.1016/j.ultrasmedbio.2008.04.005. [DOI] [PubMed] [Google Scholar]
- 9.Ohayon J, Pierre T, Finet G, Rioufol G. In-vivo prediction of human coronary plaque rupture location using intravascular ultrasound and the finite element method. Coron Artery Dis. 2001;12:655–663. doi: 10.1097/00019501-200112000-00009. [DOI] [PubMed] [Google Scholar]
- 10.Steinman DA. Image-based computational fluid dynamics modeling in realistic arterial geometries. Ann Biomed Eng. 2002;30(4):483–497. doi: 10.1114/1.1467679. [DOI] [PubMed] [Google Scholar]
- 11.Vengrenyuk Y, Cardoso L, Weinbaum S. Micro-CT based analysis of a new paradigm for vulnerable plaque rupture: Cellular microcalcifications in fibrous caps. Mol Cell Biomech. 2008;5(1):37–47. [PubMed] [Google Scholar]
- 12.Bluestein D, Alemu Y, Avrahami I, Gharib M, Dumont K, Ricotta JJ, Einav S. Influence of microcalcifications on vulnerable plaque mechanics using FSI modeling. J Biomech. 2008;41(5):1111–1118. doi: 10.1016/j.jbiomech.2007.11.029. [DOI] [PubMed] [Google Scholar]
- 13.Wentzel JJ, Corti R, Fayad ZA, Wisdom P, Macaluso F, Winkelman MO, Fuster V, Badimon JJ. Does shear stress modulate both plaque progression and regression in the thoracic aorta? Human study using serial magnetic resonance imaging. J Amer Coll Cardiol. 2005;45(6):846–854. doi: 10.1016/j.jacc.2004.12.026. [DOI] [PubMed] [Google Scholar]
- 14.Long Q, Xu XY, Ariff B, Thom SA, Hughes AD, Stanton AV. Reconstruction of blood flow patterns in a human carotid bifurcation: A combined CFD and MRI study. J Magn Reson Imaging. 2000;11:299–311. doi: 10.1002/(sici)1522-2586(200003)11:3<299::aid-jmri9>3.0.co;2-m. [DOI] [PubMed] [Google Scholar]
- 15.Li ZY, Howarth SP, Tang T, Graves MJ, U-King-Im J, Trivedi RA, Kirkpatrick PJ, Gillard JH. Structural analysis and magnetic resonance imaging predict plaque vulnerability: A study comparing symptomatic and asymptomatic individuals. J Vasc Surg. 2007;45(4):768–775. doi: 10.1016/j.jvs.2006.12.065. [DOI] [PubMed] [Google Scholar]
- 16.Kaazempur-Mofrad MR, Isasi AG, Younis HF, Chan RC, Hinton DP, Sukhova G, Lamuraglia GM, Lee RT, Kamm RD. Characterization of the atherosclerotic carotid bifurcation using MRI, finite element modeling, and histology. Ann Biomed Eng. 2004;32(7):932–946. doi: 10.1023/b:abme.0000032456.16097.e0. [DOI] [PubMed] [Google Scholar]
- 17.Tang D, Yang C, Zheng J, Woodard PK, Saffitz JE, Sicard GA, Pilgram TK, Yuan C. Quantifying effects of plaque structure and material properties on stress behaviors in human atherosclerotic plaques using 3D FSI models. J Biomech Eng. 2005;127(7):1185–1194. doi: 10.1115/1.2073668. [DOI] [PMC free article] [PubMed] [Google Scholar]
- 18.Tang D, Yang C, Zheng J, Woodard PK, Saffitz JE, Petruccelli JD, Sicard GA, Yuan C. Local maximal stress hypothesis and computational plaque vulnerability index for atherosclerotic plaque assessment. Ann Biomed Eng. 2005;33(12):1789–1801. doi: 10.1007/s10439-005-8267-1. [DOI] [PMC free article] [PubMed] [Google Scholar]
- 19.Yang C, Tang D, Yuan C, Hatsukami TS, Zheng J, Woodard PK. In vivo/ex vivo MRI-based 3D models with fluid–structure interactions for human atherosclerotic plaques compared with fluid/wall-only models. CMES: Comput Model Eng Sci. 2007;19(3):233–245. [PMC free article] [PubMed] [Google Scholar]
- 20.Mintz GS, Nissen SE, Anderson WD, Bailey SR, Erbel R, Fitzgerald PJ, Pinto FJ, Rosenfield K, Siegel RJ, Tuzcu EM, Yock PG. American College of Cardiology clinical expert consensus document on standards for acquisition, measurement and reporting of intravascular ultrasound studies (IVUS) J Amer Coll Cardiol. 2001;37:1478–1492. doi: 10.1016/s0735-1097(01)01175-5. [DOI] [PubMed] [Google Scholar]
- 21.Baldewsing RA, de Korte CL, Schaar JA, Mastik F, Van Der Steen AF. Finite element modeling and intravascular ultrasound elastography of vulnerable plaques: Parameter variation. Ultrasonics. 2004;42(1–9):723–729. doi: 10.1016/j.ultras.2003.11.017. [DOI] [PubMed] [Google Scholar]
- 22.Leach C, Bach RG. Atherosclerotic coronary plaque in a patient with the metabolic syndrome: Assessment by lesion physiology and intravascular ultrasound virtual histology. J Cardiometab Syndr. 2006;1(3):225–227. doi: 10.1111/j.1559-4564.2006.05494.x. [DOI] [PubMed] [Google Scholar]
- 23.Ohayon J, Teppaz P, Finet G, Rioufol G. In-vivo prediction of human coronary plaque rupture location using intravascular ultrasound and the finite element method. Coron Artery Dis. 2001;12:655–663. doi: 10.1097/00019501-200112000-00009. [DOI] [PubMed] [Google Scholar]
- 24.Park JBR, Tobis JM. Spontaneous plaque rupture and thrombus formation in the left main coronary artery documented by intravascular ultrasound. Cathet Cardiovasc Diagn. 1997;40:358–360. doi: 10.1002/(sici)1097-0304(199704)40:4<358::aid-ccd7>3.0.co;2-8. [DOI] [PubMed] [Google Scholar]
- 25.Pedersen PC, Chakareski J, Lara-Montalvo R. Ultrasound characterization of arterial wall structures based on integrated backscatter profiles. Proc. 2003 SPIE Med. Imag. Symp; San Diego, CA. Feb; pp. 115–126. [Google Scholar]
- 26.Lee RT, Kamm RD. Vascular mechanics for the cardiologist. J Amer Coll Cardiol Rev. 1994;23(6):1289–1295. doi: 10.1016/0735-1097(94)90369-7. [DOI] [PubMed] [Google Scholar]
- 27.Loree HM, Grodzinsky AJ, Park SY, Gibson LJ, Lee RT. Static circumferential tangential modulus of human atherosclerotic tissue. J Biomech. 1994;27(2):195–204. doi: 10.1016/0021-9290(94)90209-7. [DOI] [PubMed] [Google Scholar]
- 28.Loree HM, Tobias BJ, Gibson LJ, Kamm RD, Small DM, Lee RT. Mechanical properties of model atherosclerotic lesion lipid pools. Arterioscler Thromb. 1994;14(2):230–234. doi: 10.1161/01.atv.14.2.230. [DOI] [PubMed] [Google Scholar]
- 29.Holzapfel GA, Gasser TC, Ogden RW. A new constitutive framework for arterial wall mechanics and a comparative study of material models. J Elast. 2000;61:1–48. [Google Scholar]
- 30.Holzapfel GA, Sommer G, Regitnig P. Anisotropic mechanical properties of tissue components in human atherosclerotic plaques. J Biomech Eng. 2004;126(5):657–665. doi: 10.1115/1.1800557. [DOI] [PubMed] [Google Scholar]
- 31.McCord BN. Ph.D. dissertation. Georgia Inst. Technol; Atlanta: 1992. Fatigue of atherosclerotic plaque. [Google Scholar]
- 32.Nasu K, Tsuchikane E, Katoh O, Vince DG, Virmani R, Surmely JF, Murata A, Takeda Y, Ito T, Ehara M, Matsubara T, Terashima M, Suzuki T. Accuracy of in vivo coronary plaque morphology assessment: A validation study of in vivo virtual histology compared with in vitro histopathology. J Amer Coll Cardiol. 2006;47:2405–2412. doi: 10.1016/j.jacc.2006.02.044. [DOI] [PubMed] [Google Scholar]
- 33.Prosi M, Perktold P, Ding Z, Friedman MH. Influence of curvature dynamics on pulsatile coronary artery flow in a realistic bifurcation model. J Biomech. 2004;37:1767–1775. doi: 10.1016/j.jbiomech.2004.01.021. [DOI] [PubMed] [Google Scholar]
- 34.Balestrini J, Billiar KL. Magnitude and duration of stretch modulates fibroblast remodeling of fibrin gels. J Biomech Eng. 2009;131(5):051005-1–051005-9. doi: 10.1115/1.3049527. [DOI] [PubMed] [Google Scholar]
- 35.Bathe KJ. Finite Element Procedures. Englewood Cliffs, NJ: Prentice-Hall; 1996. [Google Scholar]
- 36.Bathe KJ. Theory and Modeling Guide. I and II. Watertown, MA: ADINA and ADINA-F, ADINA R&D, Inc; 2007. [Google Scholar]