

Abstract
Protein 3-nitrotyrosine (3-NT) has been recognized as an important biomarker of nitroxidative stress associated with inflammatory and degenerative diseases, and biological aging. Analysis of protein-bound 3-NT continues to represent a challenge since in vivo it frequently does not accumulate on proteins in amounts detectable by quantitative analytical methods. Here, we describe a novel approach of fluorescent tagging and quantitation of peptide-bound 3-NT residues based on the selective reduction to 3-AT followed by reaction with 4-(amino-methyl)benzenesulfonic acid (ABS) in the presence of K3Fe(CN)6 to form a highly fluorescent 2-phenylbenzoxazole product. Synthetic 3-NT peptide (0.005–1 μM) upon reduction with 10 mM sodium dithionite and tagging with 2 mM ABS and 5 μM K3Fe(CN)6 in 0.1 M Na2HPO4 buffer (pH 9.0) was converted with yields >95% to a single fluorescent product incorporating two ABS molecules per 3-NT residue, with fluorescence excitation and emission maxima at 360 ± 2 and 490 ± 2 nm, respectively, and a quantum yield of 0.77 ± 0.08, based on reverse-phase LC with UV and fluorescence detection, fluorescence spectroscopy and LC–MS–MS analysis. This protocol was successfully tested for quantitative analysis of in vitro Tyr nitration in a model protein, rabbit muscle phosphorylase b, and in a complex mixture of proteins from C2C12 cultured cells exposed to peroxynitrite, with a detection limit of ca. 1 pmol 3-NT by fluorescence spectrometry, and an apparent LOD of 12 and 40 pmol for nitropeptides alone or in the presence of 100 μg digested cell proteins, respectively. LC–MS–MS analysis of ABS tagged peptides revealed that the fluorescent derivatives undergo efficient backbone fragmentations, allowing for sequence-specific characterization of protein Tyr nitration in proteomic studies. Fluorogenic tagging with ABS also can be instrumental for detection and visualization of protein 3-NT in LC and gel-based protein separations.
Keywords: Column liquid chromatography-mass spectrometry, Reversed phase, UV and fluorescence detection, Protein 3-nitrotyrosine
Introduction
Protein-bound 3-nitrotyrosine (3-NT) has been recognized as an important biomarker of nitroxidative stress associated with inflammatory and degenerative diseases, and biological aging [1–10]. The quantitative analysis of 3-NT on specific protein sequences continues to be a challenge since the absolute accumulation of 3-NT especially on low abundance proteins in vivo may be below the detection limits of current quantitative analytical methods [3, 11]. The analysis of 3-NT by immunochemical and LC–MS methods is at best semi-quantitative suffering from obvious shortcomings such as the unknown specificity of commercially available anti-3-NT antibodies, and/or unknown recovery of 3-NT-containing peptides for mass spectrometry analysis. The design of 3-NT sequence-specific antibodies [12, 13] and of synthetic 3-NT containing peptide standards for LC–MS (similar to the approach applied to the analysis of phosphoproteins [14]) can significantly improve the quantitative analysis of protein 3-NT; however, these approaches are barely possible for the complete sequence-specific characterization of protein nitration in tissue samples, and are limited so far to the targeted characterization of a few nitrated proteins to address specific biologic questions. Another approach to enhance the sensitivity of low-level 3-NT determination is the affinity-enrichment of 3-NT containing proteins or peptides by either immunoprecipitation (IP) with 3-NT-specific antibodies [15, 16] or selective multi-step conversion of 3-NT into products amenable to affinity separation, followed by LC–MS analysis [17, 18]. However, most of these approaches do not exert a high specificity in regard to 3-NT. Affinity of anti-3-NT antibodies varies greatly depending on a given protein epitope, and, additionally, suffer from non-specific protein binding. Chemical derivatization procedures are based on the reactivity of the amino group formed after reduction of 3-NT to 3-aminoty-rosine (3-AT); here low-abundant 3-AT cannot always be selectively modified in the presence of a great excess of other amino or thiol groups. To achieve such selectivity of 3-AT derivatization, highly efficient pretreatments to block other reactive groups are required, which, in turn, may provide undesirable effects on protein digestion, mass spectrometry detection, etc. [19].
Recently, we have suggested an approach for selective derivatization of 3-NT based on simultaneous reaction of both the aromatic amino and hydroxyl groups of 3-AT (this method would also derivatize 3,4-dihydroxyphenylalanine, DOPA; however, 3-AT derivatization is only possible after reduction of 3-NT to3-AT). In model experiments, the selective reaction of ortho-substituted phenol derivatives (2-aminocresol and 4-methylcatechol) as well as DOPA-containing peptides with benzylamine generated a highly fluorescent 2-phenylbenzoxazole (PBO) product [20]. The selective fluorogenic derivatization of 3-NT has been established as a multi-functional approach, which combines 3-NT quantitation by fluorescence spectrometry and sequence-specific quantitative MS analysis of tyrosine nitration sites using isotope-coded tags [20]. Subsequently, we demonstrated the general applicability of this reaction for the fluorogenic derivatization of reduced 3-NT residues in peptides, where two different PBO derivatives formed depending on the reaction conditions [21]. Here, we report on (i) the optimization of the reaction conditions for the fluorogenic tagging with 4-(aminomethyl)benzene sulfonic acid (ABS) for submicromolar concentrations of 3-NT-containing synthetic peptide, resulting in formation of virtually a single PBO product, (ii) the fluorescence quantum yields of the PBO product, (iii) the applicability of the procedure to peptide mixtures from proteins nitrated in vitro and to proteins nitrated in cell culture, and (iv) the sequence-specific mass spectrometric characterization of PBO products in complex protein samples.
Experimental
Synthesis of ABS
ABS was synthesized according to a published procedure with slight modifications [22]. 10 mL of benzylamine (Sigma-Aldrich, St. Louis, MO, USA) was carefully and slowly added dropwise at 0°C to 30 mL of 20% fuming H2SO4 under stirring (the reaction and H2SO4 must be handled with appropriate precautions!). The mixture was warmed to room temperature and stirred for 30 min, and then heated to 80°C and stirred for 1 h. After cooling to room temperature, the reaction mixture was poured into 400 mL of cool dioxane. The solid that formed was collected by filtration through a sintered glass funnel, and washed with 50 mL of cool dioxane. The compound was purified by dissolving in a minimum volume of aqueous ammonium hydroxide (NH4OH) and then precipitated upon careful addition of concentrated HCl (final pH 1) affording 5.5 g product. NMR (DMSO-d6): δ 8.11 (br, s, 3H), 7.63 (d, 2H), 7.38 (d, 2H), 4.02 (s, 2H). Based on the 1HNMR and ESI–MS analysis in both positive and negative modes, the purity of ABS was ca 98% (spectra not shown).
Synthesis and Characterization of Standard 3-NT-Containing Peptide
A 3-NT-containing peptide, representing the partial sequence of mouse muscle phosphorylase b (Ph-b), 545FSAY(NO2) LER551, was synthesized on an ACT 90 (Advanced ChemTech, Louisville, KY, USA) instrument by means of a solid phase technique using Fmoc-protected amino acids and 3-NT (Bachem Bioscience, King of Prussia, PA, USA). The peptide was purified by semipreparative LC performed on a Summit LC system (Dionex Corp., Sunnyvale, CA, USA). Peptide purity was >99% characterized by ESI–MS and analytical reverse-phase LC. For quantitation of the nitropeptide, a spectrophotometric method based on an extinction coefficient of the 3-NT residue of ε430 = 4,400 M−1cm−1 (measured in 0.1% NaOH at pH 12 [11]) was used instead of less accurate gravimetric analysis.
Reverse-Phase LC
Standard and tryptic peptides, and their derivatives, were separated by reverse-phase LC using a Vydac C18 column and various acetonitrile (ACN) gradients. Desalting of either individual peptides or protein tryptic digests after derivatization reactions was achieved on guard columns (4.6 mm ID × 10 mm length) equilibrated with 0.1% aqueous trifluoroacetic acid (TFA) (mobile phase A), and after extensive washing with mobile phase A for at least 5 min under control of the baseline with UV and fluorescence detection, peptides were eluted by a steep linear gradient increasing ACN in 0.1% TFA from 0 to 80% (v/v) within 5 min, followed by an additional 5 min elution with 80% (v/v) ACN in 0.1% aqueous TFA. Fractions containing peptides (from 6 to 10 min) were collected and dried in a speed-vac before reconstitution in the media compatible with the next analysis or derivatization step.
For the quantitative analysis of the standard peptide FSAY*LER (here * refers to derivatives of the tyrosine residue: 3-NT, 3-AT, and various fluorescent products) samples were injected onto a Vydac C18 column (4.6 mm ID × 250 mm length) equilibrated with 10%ACN/90%H2O/0.1%TFA (v/v/v), and peptides were separated by a linear increase of ACN in the mobile phase (1% min−1) followed by a washing step for 10 min at 80% ACN. UV spectra were monitored with a photodiode array (PDA) detector (SPD-M10AVP) and fluorescence detection was achieved on an RF-10AXL detector (both from Shimadzu USA Manufacturing, Canby, OR, USA).
Protein Nitration in Vitro
Prior to protein tyrosine nitration, 1 mg mL−1 (~10 μM) rabbit muscle Ph-b (Prozyme, San Leandro, CA) in a buffer containing 1% (w/v) SDS, 50 mM NH4HCO3, pH 7.8, was reductively alkylated by incubation with 2 mM DTT for 30 min at 50°C followed by the addition of iodoacetic acid (IAA) at a final concentration of 5 mM and incubation for an additional 30 min at room temperature. The alkylated protein was separated from unreacted compounds and side products by precipitation in ten volumes of cold ethanol for 4 h at −20°C followed by centrifugation at 14,000g for 2 min. Peroxynitrite (ONOO−) was prepared by the ozonolysis of sodium azide solutions as described earlier [23]; the ONOO− content in stock solutions containing 0.1% NaOH was quantified using ε302 = 1,670 M−1cm−1 [23]. Reconstituted 100-μL (100-μg) Ph-b aliquots in 0.1 M NH4HCO3 buffer containing 1% SDS were then nitrated by the addition of 10 μL alkaline stock solution of ONOO− (final concentration of 3 mM) while vortexing to yield ca. 100 μM protein 3-NT. The content of 3-NT on Ph-b was determined by UV-spectroscopy at λmax = 430 nm (ε430 = 4,400 M−1cm−1 at pH > 9) using non-nitrated protein samples for background control [11]. Ph-b samples containing desired concentrations of 3-NT were prepared by mixing of nitrated and control protein at specific ratios.
Protein Nitration in Cell Culture and Protein Extracts of Cell Cultures
C2C12 murine myoblasts were grown in Petri dishes as monolayers to ca. 50% confluence in Dulbecco’s modified Eagle’s medium (DMEM) supplemented with 10% fetal bovine serum and penicillin/streptomycin at 37°C and 5% CO2. The resulting myotube monolayers were washed with PBS, trypsinized, washed with DMEM and PBS, and cells were collected by centrifugation at 500 g for 2 min. A cell suspension in PBS containing 1.5 mg mL−1 protein was exposed to peroxynitrite (final concentration 3 mM) under vortexing for 5 s in 1.5-mL Eppendorf tubes. Cells were lysed by the addition of 1% SDS to PBS buffer and sonication for 30 s at 10% power output of the probe sonicator Sonic Dismembrator 500 (Fisher Scientific, Pittsburgh, PA, USA). The lysate was centrifuged at 14,000g for 10 min and the supernatant, after reductive alkylation of protein Cys residues, was used for the analysis of protein nitration. The content of 3-NT was determined by UV spectroscopy as described above.
Protein Digestion
Protein samples were cleaned from reagents by precipitation in 10 volumes of cold ethanol (4 h to overnight at −20°C) and centrifugation at 14,000g for 2 min in a benchtop centrifuge. Protein pellets were re-dissolved in 100 μL of 40 mM NH4HCO3 (pH 8) containing 10% ACN and 5 μg trypsin (sequence grade from Promega, Madison, WI, USA), and digested at 37°C overnight [24].
Reduction of 3-Nitrotyrosine to 3-Aminotyrosine
Reduction of peptide and protein 3-NT to 3-AT was performed with 10 mM sodium dithionite (Na2S2O4). Peptide samples were then injected onto a Vydac C18 column for further purification and analysis by LC. The reduction of 3-NT to 3-AT was controlled by LC with PDA detection of the UV spectra, monitoring the loss of the 360-nm absorbance of 3-NT (at acidic pH), and by ESI–MS and ESI–MS–MS analysis. Collected peptide fractions were dried in a speed-vac to remove the LC solvent. Proteins, after sodium dithionite reduction, were purified by precipitation in ethanol as described above.
Fluorogenic Derivatization of 3-Aminotyrosine-Containing Peptides
Peptide or protein samples were reconstituted in 100 μL of 0.1 M Na2HPO4 (pH 9) and reacted with ABS and K3Fe(CN)6 at room temperature as indicated. Controls for non-specific fluorescence included samples without a substrate or reagents incubated under the same conditions. An optimized condition for fluorogenic derivatization of peptide samples containing <1 μM 3-AT would involve incubation with 2 mM ABS and 20 μM K3Fe(CN)6 for 1 h at room temperature.
Fluorescence Measurements
After derivatization, sample volumes were adjusted to 0.5 mL with the derivatization buffer and fluorescence spectra were recorded in 0.5 mL 1-cm light-pass fluorescence cuvettes (Hellma, Plainview, NY, USA) using a Shimadzu RF-5000U fluorescence spectrophotometer with excitation and emission band widths set at 5 nm. Spectra were then digitized and fluorescence intensities were derived from the spectra, calculated with Microsoft Excel tools. For calculations of extinction coefficient and fluorescence quantum yields, the specific ABS-tagged fluorescent peptide product, FSAY(A2)LER (Fig. 1), was synthesized under reaction conditions providing virtually stoichiometric yields of the tagged peptide from the known amount of the original nitropeptide, and purified by reverse-phase LC. The quantum yield Φ for the fluorescence of FSAY(A2)LER was determined through comparison with a reference compound, the GSH-adduct of ThioGlo1 (www.covalentassociates.com), based on known values of ΦR = 0.49 and ε380 = 14,454 M−1cm−1, according to Eq. 1 [25, 26],
Fig. 1.

Formation of fluorescent 6-substituted 2-phenylbenzoxazole (products of types I, II, and III) from FSAY(3-NO2)LER upon reaction with ABS and K3Fe(CN)6 (modified from [21])
| (1) |
where Φ and ΦR are fluorescence quantum yields of FSAY(A2)LER and GSH-ThioGlo1, A and AR are absorbencies at the respective excitation wavelengths, q and qR are the relative photon outputs of the sources at the excitation wavelengths, F and FR are maximal fluorescence intensities, and n and nR are the refractive indices for FSAY(A2)LER and GSH-ThioGlo1, respectively. GSH-ThioGlo1 was obtained by the reaction of known amounts of GSH with excess ThioGlo1, and the product was characterized and purified by reverse-phase LC with UV and fluorescence detection. Any unreacted reagent does not contribute to fluorescence; however, it was removed in order to avoid any effect on the measured absorbance of the reference standard.
Fluorescence Gel Imaging
SDS–PAGE analysis of proteins was performed as previously described [24] using precasted Novex tris–glycine 4–20% gradient gels (Invitrogen, Carlsbad, CA). After protein separation the gels were removed from the plastic casing and photographed with a digital camera under irradiation by a Black-Ray lamp UVL-56 (UVP, San Gabriel, CA), which has a maximum emission at 366 nm.
CapLC–LTQ–FT–MS Analysis
Prior to MS analysis, samples were desalted by RP–LC as described above. Fractions exhibiting specific absorbance and fluorescence were collected, dried on a speed-vac, and re-dissolved in 30 μL of 40 mM NH4HCO3 containing 10% ACN. Peptide samples (5 μL) were introduced into an LTQ–FT hybrid linear quadrupole ion trap Fourier transform ion cyclotron resonance (FT–ICR) mass spectrometer (ThermoFinnigan, Bremen, Germany) via capillary liquid chromatography, analogous to a published procedure [27].
NanoLC–nanoESI–LTQ–FT MS Analysis
Peptide samples obtained by in-gel protein digestion (10 μL) were submitted to nano-LC-nanoelectrospray ionization-tandem mass spectrometry (nLC–nESI–MS–MS) analysis on an LTQ–FT spectrometer, equipped with a nano-electrospray source (ThermoElectron, San Jose, CA, USA). Prior to separation, peptides were loaded onto a 1 mm C18 PepTrap column via the chromatographic system consisting of a FAMOS Capillary and Nano LC Autosampler and a Switchos loading pump with integral switching valve (all from Dionex, Sunnyvale, CA, USA), and washed at a flow rate of 20 μL min−1 with 0.1% (v/v) aqueous TFA for 5 min before switching the flow through the peptide trap to a separation LC system. Separation of peptides was achieved on-line prior to MS–MS analysis on in-house packed BioBasic C18 stationary phase (300Å pore size, 5 μM particles from Thermo Scientific, Waltham, MA, USA) nanoflow columns (10 cm × 75 μm, 15 μm tip size; New Objective, Woburn, MA, USA). The chromatographic conditions were: mobile phase A: 0.1% aqueous formic acid, mobile phase B: 0.1% formic acid in ACN, flow rate: 200 nL min−1 delivered by an ULTIMATE Nano pump (Dionex). A linear gradient was utilized ramping from 5 to 80% ACN in 0.1% formic acid within 90 min, and continued at 80% ACN for additional 30 min. After each run, the columns were washed by a short gradient (0–80% B for 30 min) and allowed to re-equilibrate to the initial conditions for 15 min. Peptides were directly eluted from the PicoFrit column into the nanoelectrospray source of the LTQ–FT mass spectrometer programmed to use a data-dependent survey scan. Full range mass spectra (m/z 400–2000) were collected and the three most abundant ions scanned in the selected ion monitoring (SIM) mode by the Fourier transform ion cyclotron resonance mass spectrometer (FT–ICR) prior to an MS–MS experiment in the linear quadrupole ion trap (LTQ) mass spectrometer. The ions were accumulated in the linear ion trap for both the MS and MS–MS scans. The target values were set to 1 × 10⁶ ions for the survey MS, 1 × 10⁵ ions for the SIM, and 1 × 10⁴ for the MS–MS experiments. The maximum accumulation time was set at 200 ms for all modes. The resolution at m/z 400 was set to 1 × 10⁴ for the FT–ICR scans and isolation widths were set at ±2 m/z for the SIM experiments and ±1 m/z for the MS–MS experiments. Ions were selected for MS–MS when their respective intensities reached 1,000 counts and the normalized collision energy was set to 35%. The mass spectrometer was programmed to ignore singly charged ions for fragmentation and, additionally, the dynamic exclusion option was set to exclude precursors that had already been selected for 1 min after their respective fragmentations.
MS Data Analysis
Raw experimental files were processed using the ThermoElectron BioWorks 3.2 software followed by peptide identification using Sequest, Mascot and X!Tandem database-searching programs. The peptide assignments obtained were validated using a statistical method of the Scaffold 1.7 software from Proteome Software Inc. (Portland, OR; http://www.proteomesoftware.com). For characterization of protein modifications, a custom database was created. The following modifications were accounted for during the search: oxidation of Met (+16 AMU; AMU = atomic mass units); carboxymethylation (+58 AMU) or oxidation of Cys (+32 and +48 AMU); 3-NT (+45 AMU), 3-AT (+15 AMU), A2 (+366 AMU), AN (+196 AMU), and ANC (+179 AMU) modifications to the Tyr residue (the nature of these products will be discussed below; see Fig. 1). Additionally, MS–MS spectra of interest were examined manually for the presence of neutral losses and internal fragments using internet-based free software from the ProteinProspector website (http://prospector.ucsf.edu) as described earlier [6]. Analysis of the MS–MS spectra was based on a search for the major sequence-indicating ions resulting from the cleavage of the parent ion at specific locations relative to the peptide bond: N-terminal (b) and C-terminal (y″) fragments.
Statistical Analysis
For quantitative analysis, all measurements were performed in triplicate, and the data presented as mean ± standard deviation. The limits of detection were calculated from concentration dependencies including at least seven data points over a limited concentration range as LOD = 3sB/b, where sB (the standard error of blank) was obtained from the linear regression analysis (y = a + b*x) as a standard deviation of y, and b is the slope of the best linear fit line from the linear regression [28].
Results
Stoichiometric Reduction of FSAY(3-NO2)LER to FSAY (3-NH2)LER
Figure 2, panels a and b, shows that the incubation of FSAY(3-NO2)LER (50 μM) with 10 mM Na2S2O4 converted 3-NT stoichiometrically to 3-AT. RP–LC analysis after reduction demonstrates the absence of the original peak of the 3-NT peptide (eluting at ca. 17 min), which is converted to a product with a retention time of ca. 11 min. UV and mass spectral analysis of these peaks show a (i) loss of specific 3-NT absorbance at 360 nm upon reduction (inserts in Fig. 2a and b) and (ii) change of the mass of parent peptide molecular ion (M + H)+ from 930.4 to 900.5 AMU. Here the mass change of 30 AMU targeted the Tyr residue in the peptide, i.e. (Y + 45) was converted to (Y + 15), measured by LC–MS, in accord with the expected mass shifts displayed in Table 1 (MS spectra are not shown).
Fig. 2.

Reduction of 50 μM FSAY(3-NO2)LER (a) to FSAY(3-NH2)LER (b) by 10 mM Na2S2O4 analyzed by RP–LC with UV detection (the chromatograms are recorded at 214 nm). The UV spectra of major peaks analyzed by a PDA detector are shown as inserts in a and b
Table 1.
Monoisotopic masses (AMU) for 3-NT, 3-AT, and fluorescence 2-phenylbenzoxasole derivatives of FSAY*LER tagged with ABS (structures are shown in Fig. 1)
| Nature of Y* residue | Formula for the Y* derivative | Mass shift on Y | M + H+ for FSAY*LER | M + 2H+ for FSAY*LER |
|---|---|---|---|---|
| Native | C9H9N1O2 | 0 | 885.5 | 443.3 |
| 3-NO2 | C9H8N2O4 | +45 | 930.4 | 465.7 |
| 3-NH2 | C9H10N2O2 | +15 | 900.5 | 450.8 |
| A2 | C23H19N3O8S2 | +366 | 1251.4 | 626.2 |
| AN | C16H13N3O5S1 | +196 | 1081.4 | 541.2 |
| ANC | C16H9N2O5S1 | +179 | 1064.4 | 532.7 |
Formation of Fluorescent Products upon the Reaction of FSAY(3-NH2)LER with ABS/K3Fe(CN)6
Figure 1 displays the major fluorescence products that can be obtained after derivatization of FSAY(3-NH2)LER with ABS/K3Fe(CN)6 in 0.1 M phosphate and ammonium carbonate buffer at pH 9 (products type I and II, respectively) [21]. They differ by the nature of amino group substitution at position 6 of the original 3-AT ring, a Michael addition product that precedes condensation of 6-amino substituted 3-AT with ABS leading to the formation of PBO products (respective mass shifts for the model peptide are listed in Table 1 and representative MS–MS spectra are displayed in Fig. 4b and c). In addition to ABS and NH3, other amino groups of, e.g., peptides or proteins may theoretically react at position 6 forming various PBO products (see below). The structure of product I was formulated based on an analogous derivatization of 2-aminocresol and 4-methylcatechol with benzylamine, for which a crystal structure was obtained [20]. Structures II and III are based on mass spectrometry results only. The relative yields of such products would depend on the reaction conditions. Figure 3 illustrates the formation of fluorescent products in 0.1 M phosphate buffer at pH 9 assayed by LC with UV and fluorescence detection. In phosphate buffer, derivatization with ABS produces one major fluorescent product from FSAY(3-NH2)LER with a retention time of ca. 16 min, based on UV absorbance (at 214 nm) and fluorescence detection (excitation and emission wavelengths of 360 and 490 nm, respectively). The absorbance spectrum of this product measured with a PDA detector (insert in Fig. 3a, trace 2) matches the fluorescence excitation spectrum obtained by fluorescence spectrometry (data not shown) in accord with previously published data [21]. LC (Fig. 3b, trace 2) and semi-quantitative MALDI-MS analysis (Fig. 4a) show that in addition to a major product, FSAY(A2)LER (ca.75%), derivatization with ABS under these conditions yields two additional PBO products, FSAY(AN)LER and FSAY(ANC)LER, (ca. 18 and 7%, respectively), identified by respective mass shifts in the tandem MS spectra (Table 1 and Fig. 4b and c). It is important to underline that all three PBO variants are formed from original 3-NT, and have similar fluorescent properties (see fluorescence spectrum of a total sample in the insert to Fig. 3b) so that even minor yields of these products will also contribute to the measured fluorescence, and therefore to 3-NT quantitation. However, reaction conditions can be optimized to yield a single or predominant PBO product, that is important for the calculation of chemical and fluorescence yields of single peptide derivatives (see below), and for sequence-specific MS detection and quantitation of tagged peptides in complex systems.
Fig. 4.

MS analysis of tagged FSAY(3-NH2)LER (50 μM) after reaction with 10 mM ABS and 0.5 mM K3Fe(CN)6 by MALDI–TOF–MS (a) and CapLC–LTQ–FT–MS–MS (b and c). Panels b and c display sequence-indicating fragmentation of m/z 624.6 and 541.4 representing doubly charged ions of FSAY(A2)LER (Y + 366) and FSAY(AN)LER (Y + 196), respectively
Fig. 3.

Fluorescence tagging of FSAY(3-NH2)LER analyzed by RP–LC with UV detection at 214 nm (a) and by fluorescence detection with excitation and emission wavelengths at 360 and 490 nm, respectively (b). Chromatograms 1 and 2 are recorded before and after tagging of 50 μM FSAY(3-NH2)LER with 10 mM ABS and 0.5 mM K3Fe(CN)6 for 1 h at room temperature. The UV spectra of major peaks analyzed by a PDA detector are shown in the insert to a; the fluorescence spectrum of a total sample is shown in the insert to panel b
Optimization of Derivatization Conditions for Maximal Yields of FSAY(A2)LER (Product Type I)
To optimize reaction conditions for the maximal yield of a single fluorescent product, we varied incubation times, and reagent concentrations and quantified PBO product formation by both fluorescence spectrometry, and RP–LC with fluorescence detection. High concentrations of the nitropeptide (50 μM) were used in previous experiments to provide an opportunity for quantitative LC analysis based on UV detection (214 nm). However, the high sensitivity of fluorescence detection allows for the analysis of fluorescence products for concentrations of the peptide at three orders of magnitude lower, e.g., in the submicromolar concentration range, which is physiologically more relevant. Figure 5 shows that the overall fluorescence intensity, measured by fluorescence spectrometry (solid lines), reaches its maximum value for 10 mM ABS (the K3Fe(CN)6 concentration of 0.5 mM and the incubation time of 1 h were kept constant in this experiment). The shape of the ABS concentration dependence was similar for different concentrations of FSAY(3-NH2)LER, i.e., 1 and 0.1 μM. However, LC analysis indicated that the increase in the total fluorescence at ABS concentrations higher than 2 mM is due to the formation of fluorescent products with retention times of 12–14 min., i.e. different from FSAY(A2)LER, which elutes at ca. 16 min (Fig. 3b). Based on the LC data (dashed trace in Fig. 5), a maximum yield of product I and minimal accumulation of other fluorescent products is observed for 2 mM ABS. We also found that formation of fluorescent products other than product I was less pronounced in the presence of lower amounts of the oxidant, K3Fe(CN)6, particularly at low concentrations of the nitropeptide (compare Fig. 6a and b). Hence, the optimal concentrations of K3Fe(CN)6 yielding maximum amounts of FSAY(A2)LER are relatively low and dependent on the concentrations of the peptide. A detailed fluorescence spectrometry evaluation of the dependence of fluorescent product formation on K3Fe(CN)6 concentration (at optimal ABS concentration of 2 mM) revealed an optimal ratio of [K3Fe(CN)6] to [3-AT] ≥ 5:1 for 3-AT concentrations of 0.1, 1, and 10 μM, respectively (Fig. 6c). The exact chemical reason for this empirical value is currently unclear. At too high levels of K3Fe(CN)6 fluorescence intensity is reduced, possibly due to overoxidation of 3-AT. Nevertheless, for fluorescence quantitation of 3-NT, the optimal range of K3Fe(CN)6 concentration is quite acceptable as it extends over nearly two orders of magnitude. For example, for less than 1 μM of 3-AT (a concentration range, which appears biologically relevant) the optimal K3Fe(CN)6 concentration to produce maximum yields of fluorescence product I would be 5 μM. Importantly, the presence of additional iron in cells or tissues of up to 0.5 mM is not expected to significantly change fluorescence output from the given amount of 3-NT peptide (see respective curve in Fig. 6c). This is additional evidence that different PBO products exhibit comparable fluorescence quantum yields. One potential complication would be the presence of strong iron chelating species, either low molecular weight compounds or biopolymers, such as apometalloproteins. In this case it is advisable to increase K3Fe(CN)6 concentrations in samples to 10 and 20 μM to check whether the fluorescence yield reaches the plateau.
Fig. 5.

The dependence of fluorescent product formation from FSAY(3-NH2)LER on the ABS concentration, analyzed by fluorescence spectrometry (solid lines) and RP–LC (dashed line) with fluorescence detection (excitation and emission wavelengths were 360 and 480 nm, respectively). The reaction was performed in the presence of 0.5 mM K3Fe(CN)6 for 1 h at room temperature with different concentrations of ABS and 3-AT peptide as indicated in respective panels
Fig. 6.

Effect of [K3Fe(CN)6] on fluorescent product formation from 1 (a) and 0.1 μM (b) FSAY(3-NH2)LER assessed by RP–LC with fluorescence detection (excitation and emission wavelengths set at 360 and 480 nm, respectively) and by fluorescence spectrometry (c). The ABS concentration was 2 mM, the concentrations of FSAY(3-NH2)LER are shown at the curves
Fluorescence Quantum Yield of FSAY(A2)LER
Taking advantage of the nearly stoichiometric conversion of FSAY(3-NO2)- LER to FSAY(3-NH2)LER, and further (nearly 100%) to FSAY(A2)LER under optimized reaction conditions (Fig. 7a), we produced known amounts of the tagged peptide and quantified its fluorescence quantum yield by comparison of absorbance and fluorescence spectra with those of a reference standard measured under the same conditions (Fig. 7b). We determined an extinction coefficient of ε360 = 6,300 M−1cm−1 for FSAY(A2)LER. For the reference compound, the GSH adduct of ThioGlo1 (GSH-ThioGlo1), we used the published values ΦR = 0.49 and ε380 = 14,454 M−1cm−1 at pH 7. Based on these data, and Eq. 1, we calculated a fluorescence quantum yield of Φ = 0.77 ± 0.08 for the fluorescent product type I, FSAY(A2)LER.
Fig. 7.

Determination of the fluorescence quantum yield for RP–LC-purified FSAY(A2)LER (peak at ca. 16 min in the panel a) using a reference fluorescence peptide, the GSH-ThioGlo1 adduct. Panel b shows absorbance (Abs.), fluorescence excitation (Ex.) and emission (Em.) spectra for 1 μM FSAY(A2)LER (solid lines) and 2 μM ThioGlo1-GSH (dashed lines) in 0.1 M NaH2PO4, pH 7.4
Quantitative Analysis of ABS Tagged 3-NT in Complex Peptide Mixtures by Fluorescence Spectrometry
To test whether our optimized tagging conditions are suitable for quantitative fluorogenic derivatization of nitropeptides in complex samples containing highly abundant matrix proteins/peptides, fluorescence spectra were recorded for low concentrations (0–0.1 μM) of FSAY(3-NO2)LER derivatized with ABS via our protocol in the absence and presence of increasing amounts of tryptic peptides obtained from lysates of cultured C2C12 cells (Fig. 8). Figure 8a shows that in the absence of peptides, the reagent background control where ABS was incubated with K3Fe(CN)6 alone exhibited a low intensity fluorescence with a maximum at ca. 435 nm. In the presence of increasing concentrations of the nitropeptide alone, we detected an increase in the fluorescence intensity with gradual shift of the maximum from 435 nm for reagent background to 490 nm for nitropeptide concentrations of 50 nM and above (Fig. 8a) reflecting the 3-NT-dependent accumulation of PBO product with the fluorescence maximum at 490 nm, in accord with data obtained for high concentrations of the nitropeptide (compare with spectra in Figs. 3b and 7b). The subtraction of the reagent background spectrum converts the spectra even with high relative contribution of the background fluorescence (for 5 and 20 nM of the nitropeptide) into spectra of a single fluorophore with maximum emission at 490 nm (dashed lines in Fig. 8b), the amplitude of those is linearly dependent (R > 0.99) on the concentration of 3-NT (Fig. 9a). A similar background subtraction procedure can be applied also to the spectra of samples containing in addition to the nitropeptide a mixture of tryptic peptides from C2C12 cell lysate (Fig. 8c, d) although the respective background fluorescence spectra and intensity are different from the reagent background in Fig. 8a. The nature of this background fluorescence will be discussed below. However, the resulting subtracted spectra (dashed traces in Fig. 8b and d) are perfectly matching the spectra of PBO product. Technically, this offers an opportunity to quantify the 3-NT dependent fluorescence upon ABS tagging at just one wavelength (490 nm) without the necessity of spectral analysis, provided that the necessary background controls are included. Linear regression analysis of the data in Fig. 9a shows that the slopes of concentration dependencies, 82.5 ± 0.68 and 81.0 ± 2.5 μM−1 in the absence and in the presence of 100 μg C2C12 lysate tryptic digest, respectively, are virtually the same, so that the complex peptide mixtures change only the level of background fluorescence (Fig. 9b) and do not affect the fluorescence output from the tagged nitropeptide. Though our data demonstrate that reduction and fluorogenic derivatization of FSAY(3-NO2)LER with ABS allows to detect as low as 1 pmol of nitropeptide (0.002 μM in a 0.5-mL sample) by fluorescence spectrometry, the limit of 3-NT detection calculated from the linear regression analysis of calibration curves between 0 and 500 pmol (0–1 μM) 3-NT is ca. 12 pmol (0.025 μM) for FSAY(3-NO2)LER alone and ca. 40 pmol (0.09 μM) in the presence of non-nitrated peptides from 100 μg digested C2C12 proteins.
Fig. 8.

Fluorescence spectra recorded after ABS tagging of low FSAY(3-NO2)LER concentrations in the absence (a, b) or in the presence of tryptic peptides prepared from lysate of 100 μg C2C12 cell protein (c, d). Fluorescence tagging after nitropeptide reduction was performed with 2 mM ABS and 10 μM K3Fe(CN)6 in 0.1 M Na2HPO4 at 25°C. Concentrations of the nitropeptide in the respective samples (nM) are indicated for respective spectra. The dashed line traces represent spectra obtained through subtraction of respective background fluorescence spectra (in the absence of nitropeptide)
Fig. 9.

a Calibration of FSAY*LER in the absence (open circles) and in the presence of 100 μg digested C2C12 cell proteins (solid circles). Solid squares connected with dashed line represent the result of background fluorescence subtraction. b The dependence of background fluorescence (in the absence of 3-NT peptide) on the amount of protein digest. Fluorescence was measured at excitation and emission wavelengths of 360 and 490 nm, respectively, after 3-NT reduction and tagging with 2 mM ABS and 20 μM K3Fe(CN)6 for 1 h at room temperature
The background fluorescence does not correlate with 3-NT levels, can be easily subtracted from measured fluorescence signal (provided that respective controls are included), and could be completely neglected at 3-NT concentrations above 0.1 μM. However, it affects the limit of detection, which is a very important issue for the analysis of 3-NT in biological samples, so that the removal of fluorescence background would greatly improve the sensitivity of 3-NT determination. Spectral analysis of background fluorescence (spectra in the absence of 3-NT in Fig. 8) shows at least two origins of fluorogenic reactions, which form fluorescent products during incubation with K3Fe(CN)6 from either ABS alone (Fig. 8a) or C2C12 peptides (Fig. 8c) with fluorescence maxima at 435 and 460 nm, respectively. The 435-nm fluorescence represents a minor source of background; it is ABS- and K3Fe(CN)6-dependent, and can be diminished through a decrease in reagent concentrations. However, changing the optimal concentrations of the reagents would affect the yield of 3-NT tagging and is not acceptable. The 460-nm fluorescence is the predominant source of background fluorescence at high peptide loads; it is ABS-independent and directly proportional to the amount of protein digest in the samples (Fig. 9b). Our experiments show that the fluorescence products may form during the storage of C2C12 proteins, particularly during the overnight protein digestion at 37°C (compare spectra 1 in Fig. 10a and b) and that the incubation with K3Fe(CN)6 markedly increases the yield of the fluorescent products (spectra 2 in Fig. 10a, and b). Therefore, we suggest that the fluorescent products originate from iron-dependent protein oxidation. We can rule out a possible participation of (i) thiol-mediated reactions, since the reductive alkylation of proteins does not affect the background fluorescence (data not shown), and (ii) reactions involving amino groups in proteins, since the reductive methylation of protein samples (performed as described in [19]) did not abolish the accumulation of fluorescence signal (data not presented). The most likely candidates are N′-formylkynurenin (NFK) and kynurenin (Kyn), which may form during tryptophan (Trp) oxidation by various reactive oxygen species [29–32] and possess appropriate fluorescent properties [32, 33]. Though NFK was referred as a major product of Trp oxidation with a stronger fluorescence than that for Kyn, our spectral analysis would be more consistent with a potential role of Kyn as a source of background fluorescence under our conditions. This conclusion is based on (i) the location of the excitation maximum (at 360 nm vs. 325 nm for NFK), (ii) the similarity of the fluorescence spectra (Fig. 10), and (iii) a strong dependence of the fluorescence intensity on solvent polarity accompanied by the characteristic shift of the fluorescence maximum (Fig. 10c), consistent with the literature [33]. CapLC–LTQ–FT–MS–MS analysis of C2C12 protein digests, however, detected peptide masses consistent with the formation of hydroxy-Trp and/or NFK residues after incubation with K3Fe(CN)6 (W + 16 and W + 32 AMU, respectively), while no Kyn modifications (W + 4 AMU) were observed. These results could suggest that NFK may either serve as a precursor to Kyn and/or contribute to background fluorescence itself, although to a lower extent than Kyn. The question is whether the amounts of Trp present in our samples are sufficient for the formation of fluorescence products under our conditions. Comparison of fluorescence levels generated through the oxidation of 100 μg C2C12 proteins (or protein digests) with that of authentic Kyn (Fig. 10) shows that, depending on the local environment, the formation of 1–10 μM Kyn may account for the observed background fluorescence. Such amounts are not unreasonable based on the calculated amount of Trp in our samples (ca. 50 μM), based on the natural abundance of Trp residues in proteins of 1.13% [34]. Another question is whether we can find a way to reduce the intensity of background fluorescence in order to further improve the limit of 3-NT detection by our method. Chemically, this may be difficult; however, we have synthesized an ABS-derivative with an affinity tag, which will allow us to use affinity chromatography to fractionate benzylamine-derived fluorescent products from background fluorescence [unpublished results]. An additional side reaction is the potential reaction of 5-hydroxytryptophan (5-OH-Trp) with ABS to form a fluorescent product of 2-phenyl-6H-oxazolo[4,5-e]indole (POI) type (Fig. 11); this reaction was earlier suggested for quantitative LC analysis of 5-hydroxyindole derivatives in biological fluids using benzylamine for pre-column fluorogenic derivatization [35]. While we can easily differentiate between 5-OH-Trp and 3-NT through the reduction by Na2S2O4, required for the derivatization of 3-NT, the derivatization of 5-OH-Trp may potentially contribute to background fluorescence due to Trp oxidation to 5-OH-Trp followed by fluorescent POI formation during the derivatization step. In a control experiment, submicromolar concentrations of authentic 5-OH-Trp indeed produced a fluorescence with a maximum at 500 nm (Fig. 12a and b) upon 1 h incubation with 2 mM ABS and 10 μM K3Fe(CN)6 in 0.1 M PBS at pH 9. However, the contribution of this product to background fluorescence cannot be significant since (i) the spectra (excitation and emission wavelengths maxima at 390 and 500 nm, respectively) are clearly different from those observed in the background controls (Fig. 8), and (ii) the formation of 5-OH-Trp during processing of protein samples in our conditions is not sufficient based on the experiment with authentic free Trp subjected to ABS derivatization (Fig. 12c). Similar results were obtained for serotonin, a decarboxylated Trp derivative (data not shown).
Fig. 10.

ABS-independent background (matrix) fluorescence originating from oxidative protein modification. a and b Spectra of samples containing 100 μg of (a) digested or (b) non-digested C2C12 proteins (1) before and (2) after 1 h incubation in 0.1 M PBS (pH 9) with 10 μM K3Fe(CN)6. c Fluorescence spectra of 10 (curves 1,3,4) and 2 μM (curve 2) kynurenin in 0.1 M PBS, pH 9 (curve 1), 50% PBS/50% ethanol (curves 2 and 3) and 100% ethanol (curve 4). Excitation wavelength was set at 360 nm
Fig. 11.

Fluorogenic derivatization of 5-OH-Trp with ABS (modified from [35])
Fig. 12.
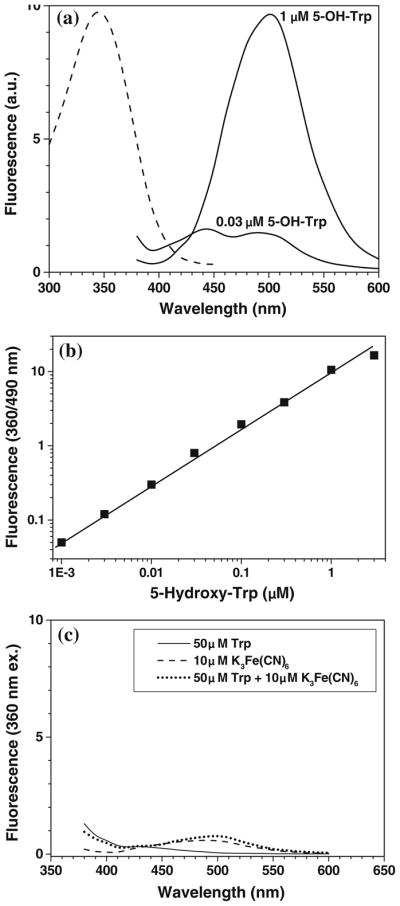
Fluorescence spectra of ABS-tagged 5-hydroxytryptophan (a), the dependence of the fluorescence intensity (excitation and emission wavelengths of 360 and 490 nm, respectively) on 5-OH-Trp concentration (b), and fluorescence resulted from the incubation for 1 h of 50 μM Trp with 2 mM ABS and 10 μM K3Fe(CN)6) in 0.1 M PBS (pH 9) at room temperature (c). The excitation spectrum for 1 μM 5-OH-Trp (the emission wavelength was set at 500 nm) is shown in panel a (dashed line)
Fluorogenic Tagging of Nitropeptide Mixtures from Proteins Nitrated in Vitro
We proceeded to analyze fluorescence and mass spectra after ABS tagging of tryptic digests of nitrated rabbit muscle Ph-b, following the protocol optimized for the synthetic peptide, FSAY(3-NO2) LER. Rabbit Ph-b is a 97 kDa protein, which contains a total of 36 Tyr residues, and represents a challenge for sequence-specific characterization of protein nitration [36–38]. Fluorescence spectra of ABS-tagged Ph-b tryptic digests, which represent a complex mixture of fluorescent and non-fluorescent peptides, show the fluorescence and excitation maxima at 490 and 360 nm, respectively. The yields of fluorescent products (measured at excitation and emission wavelengths of 360 and 490 nm, respectively) as a function of K3Fe(CN)6 and 3-NT concentrations were similar to those obtained for the standard peptide (compare Figs. 9a and 13). Quantitatively, a linear regression analysis of fluorescence as a function of 3-NT yields a slope of 88.6 ± 1.2 μM−1, which is only slightly bigger than that for our model peptide; the apparent LOD value was 20 pmol (0.04 μM). Importantly, ABS tagging of the whole protein performed under identical reaction conditions (except for the addition of SDS to 1% (v/w)), resulted in lower yields of fluorescence compared to protein digest: the slope and LOD were 27.1 ± 2.4 μM−1 and 130 pmol (0.26 μM), respectively. The decreased yields of fluorescent products are probably due to lower reactivity of 3-AT residues within the protein. These lower yields are not due to incomplete 3-NT reduction to 3-AT, based on control experiments with ABS tagging of digests, obtained after 3-NT reduction of whole protein (data not shown). Alternatively, an additional protein cleaning step through ethanol precipitation may be responsible for the loss of the analyte. These results demonstrate that for quantitative fluorescence analysis of 3-NT, ABS tagging should be carried out preferably with peptides (digested proteins), although 3-NT in proteins also can be derivatized with lower efficiency for specific applications, such as, for example, gel-based protein separation techniques (see below) or in visualization of nitrated proteins in tissue slices [unpublished results].
Fig. 13.

The dependence of fluorescence intensity (excitation and emission wavelengths of 360 and 480 nm, respectively) on the concentration of 3-NT after 3-NT reduction and tagging of whole phosphorylase b (open squares) or protein digest (solid squares) with 2 mM ABS and 20 μM K3Fe(CN)6. The total amount of protein in the samples was maintained at 100 μg; the 3-NT content was altered through mixing of native and nitrated protein at certain ratios
Sequence-Specific Analysis of ABS-Tagged Tryptic Peptides by LC–MS–MS
Qualitative tandem MS analysis of tagged peptides was performed in order to confirm the formation of fluorescent PBO products from 3-NT in a sequence specific manner in complex peptide and protein mixtures. It is noteworthy that the derivatization of 3-NT does not offer any advantage for the sensitivity of MS analysis as compared to non-derivatized nitropeptides. Furthermore, in contrast to fluorescence measurements, where all different types of fluorescent products contribute to the measured signal, the occurrence of different modified peptide isoforms decreases the abundance of individual products to be detected by mass spectrometry. Tables 2 and 3 show that all three types of fluorescent PBO peptide products (type I, Y + 366; type II, Y + 196; and type III, Y + 179) are formed on tryptic peptides of in vitro nitrated rabbit Ph-b after 3-NT reduction and ABS tagging, according to the structures shown in Fig. 1 (representative tandem MS spectra are shown in Fig. 14). The relative abundance of the different fluorescent products was similar to those observed for the model peptide based on semi-quantitative LC–MS analysis: the yield of product I was 1 to 2 orders of magnitude higher than that of types II and III. The major product was almost exclusively detected in samples containing 1 mol 3-NT/mol protein (Table 3), and no ABS-tagged peptides were observed by MS analysis in samples containing below 0.5 mol 3-NT/mol Ph-b (statistically, 0.5 mol 3-NT/mol Ph-b would correspond to 0.014 mol 3-NT per mol Tyr residue if randomly distributed). The fact that only 12 Tyr residues from a total of 36 were selectively derivatized demonstrates a remarkable sequence-specificity of both ABS-tagging and Tyr nitration of Ph-b, consistent with previous observations [36–38].
Table 2.
CapLC–LTQ–FT–MS–MS analysis of ABS-tagged tryptic peptides from rabbit muscle phosphorylase b nitrated in vitro at a level of 7.5 mol 3-NT/mol protein
| Peptide sequence | XCorr | ΔCn | Nature of PBO (type) | Mass shift on Y | m/z | z | Δ (ppm) | Start-stop |
|---|---|---|---|---|---|---|---|---|
| TIAQYAR | 0.28 | 0.00 | A2 (I) | +366 | 1188.5 | +1 | 15 | 817–823 |
| IGEEYISDLDQLR | 3.16 | 0.76 | A2 (I) | +366 | 958.9 | +2 | 20 | 508–520 |
| HLQIIYEINQR | 3.19 | 0.93 | A2 (I) | +366 | 598.27 | +3 | 5.2 | 400–410 |
| ARPEFTLPVHFYGR | 1.62 | 0.00 | A2 (I) | +366 | 1029.0 | +2 | 500 | 193–206 |
| ARPEFTLPVHFYGR | 1.94 | 0.83 | A2 (I) | +366 | 686.0 | +3 | 8.4 | 193–206 |
| LKQEYFVVAATLQDIIR | 2.42 | 0.00 | A2 (I) | +366 | 1187.1 | +2 | 22 | 294–310 |
| DFYELEPHK | 1.29 | 0.00 | A2 (I) | +366 | 772.3 | +2 | 12 | 471–479 |
| GEEYISDLDQLR | 2.15 | 0.85 | AN (II) | +196 | 873.9 | +2 | 15 | 508–520 |
| DFYELEPHK | 1.76 | 0.00 | AN (II) | +196 | 687.3 | +2 | 7.7 | 471–479 |
| VSALYK | 1.29 | 0.00 | AN (II) | +196 | 876.4 | +1 | 8.0 | 788–793 |
| VLYPNDNFFEGK | 1.81 | 0.00 | AN (II) | +196 | 819.9 | +2 | 9.2 | 279–290 |
| HLQIIYEINQR | 0.57 | 0.00 | ANC (III) | +179 | 803.4 | +2 | 12 | 400–410 |
| LLSYVDDEAFIR | 0.81 | 0.00 | ANC (III) | +179 | 810.4 | +2 | 23 | 522–533 |
| DFNVGGYIQAVLDR | 1.65 | 0.00 | ANC (III) | +179 | 1745.8 | +1 | 35 | 257–270 |
| WVDTQVVLAMPYDTPVPGYR | 1.40 | 0.94 | ANC (III) | +179 | 1244.1 | +2 | 430 | 216–235 |
| IGEEYISDLDQLRK | 1.35 | 0.00 | ANC (III) | +179 | 929.4 | +2 | 16 | 508–521 |
Table 3.
CapLC–LTQ–FT–MS–MS analysis of ABS-tagged tryptic peptides from rabbit muscle phosphorylase b nitrated in vitro at a level of 1 mol 3-NT/mol protein
| Sequence | XCorr | ΔCn | Nature of PBO (type) | Mass shift on Y | m/z | z | Δ (ppm) | Start-stop |
|---|---|---|---|---|---|---|---|---|
| HLQIIYEINQR | 3.19 | 0.93 | A2 (I) | +366 | 598.26 | +3 | 5.2 | 400–410 |
| ARPEFTLPVHFYGR | 1.62 | 0.00 | A2 (I) | +366 | 1028.47 | +2 | 17 | 193–206 |
| LLSYVDDEAFIR | 1.86 | 0.80 | A2 (I) | +366 | 903.38 | +2 | 13 | 522–533 |
| DFNVGGYIQAVLDR | 1.27 | 0.00 | ANC (III) | +179 | 873.39 | +2 | 35 | 257–270 |
Fig. 14.

Representative MS–MS spectra for ABS-tagged tryptic peptides from rabbit muscle Ph-b demonstrating the formation of fluorescent PBO products type I (Y + 366 AMU) in the sequences DFY*ELEPHK (a) and IGEEY*SDLDQLR (b)
Since all PBO products are fluorescent, formation of products of type II and III, particularly at much lower levels than product type I, does not significantly interfere with 3-NT quantitation by fluorescence spectrometry. However, they may have some negative impact on sequence-specific MS analysis due to (i) the increasing number of individual tagged peptide isoforms with different mass shifts, and (ii) the limited capability of common software for database searches to cover potential cross-links of type III, particularly in complex proteomic analysis. In proteomic studies, the sensitivity of LC–MS–MS analysis would depend on chromatographic resolution of low abundant target peptides from highly abundant non-modified peptides rather than on the absolute amounts of the analytes. One potential way to increase the resolution would be pre-fractionation of the samples, by, e.g., separation of proteins subjected to 3-NT reduction and ABS tagging, prior to digestion coupled to sequence-specific MS analysis. It was already mentioned that the ABS tagging of whole proteins produces significantly (ca. 3-fold) lower yields of fluorescent products compared to protein digests (Fig. 13). Nevertheless, ABS tagging of whole protein offers an advantage of pre-separation of protein mixtures by SDS–PAGE (or, alternatively, by LC), and the effciency of separation can be monitored through specific fluorescence detection, as exemplified in Fig. 15. It is clearly seen, that the gel band of Ph-b (5 μg protein containing 50 pmol 3-NT) can be easily visualized by fluorescence after ABS tagging (Fig. 15, lane 4) whereas control samples containing either non-treated protein (lane 2), or proteins reacted with ABS without 3-NT reduction (lane 3) do not exhibit any detectable fluorescence. These controls are important since the peroxynitrite-exposed protein, in addition to 3-NT, may potentially contain fluorescent products of Trp oxidation and/or DOPA. The latter products do not require reduction to form fluorescent derivatives upon ABS tagging. SDS-PAGE separation of ABS-tagged lysate from C2C12 cells exposed to peroxynitrite (50 μg protein containing 500 pmol 3-NT) resulted in a range of fluorescent bands with a major band at about 50 kDa (Fig. 15, lane 5). A slight fluorescence signal obtained in the non-reduced ABS-tagged control sample (lane 6) can be rationalized through the presence of trace amount of protein-bound DOPA and/or 5-OH-Trp, particularly in the overoxidized aggregated protein bands. No fluorescence from the oxidized proteins without ABS tagging was observed (lane 7). Separated proteins can be in-gel digested and analyzed by LC–MS–MS. This approach was tested for a qualitative sequence-specific analysis of protein nitration in C2C12 cells exposed to peroxynitrite. In this experiment, non-digested proteins of cell lysate (50 μg, containing 500 pmol 3-NT) were tagged with ABS prior to SDS-PAGE separation, gels were sliced, proteins digested in gel and analyzed by nanoLC–nanoESI–LTQ–FT–MS–MS analysis, which yielded very well resolved mass spectra of tagged nitropeptides from murine actin and lactate dehydrogenase (Fig. 16a and b, respectively), containing the PBO product of type I. It is worth mentioning that both peptides were identified in the gel slice containing the brightest fluorescent region just below 50 kDa (Fig. 15, line 5) so that separation of proteins was accompanied by the enrichment in ABS-tagged proteins for this particular sample.
Fig. 15.
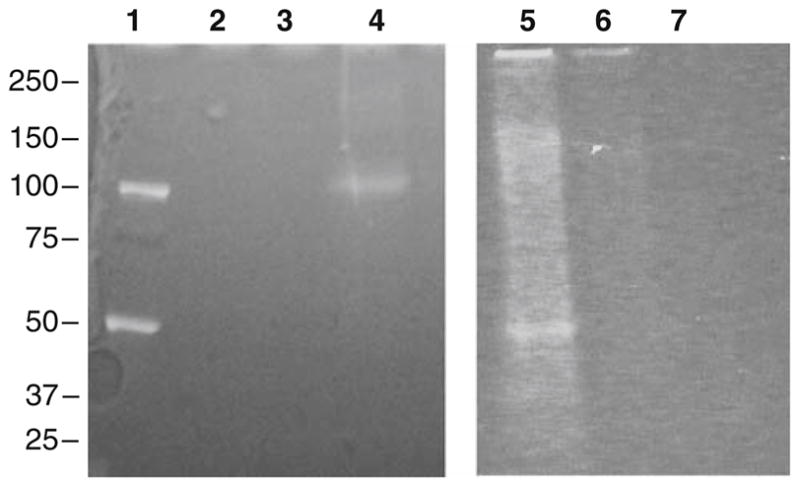
Fluorescence imaging of ABS-tagged proteins after SDS-PAGE separation Line 1: molecular weight standard (Precision Plus Dual Color, Bio-Rad); line 2: 5 μg rabbit phosphorylase b (containing 50 pmol 3-NT), non-derivatized; line 3: same protein, exposed to ABS without 3-NT reduction; line 4: same protein, 3-NT reduced and ABS-tagged; line 5: lysate of C2C12 cells exposed to peroxynitrite (50 μg protein containing 500 pmol 3-NT), after 3-NT reduction and ABS-tagging; line 6: same preparation, non-reduced, ABS tagged; line 7: same preparation, non-reduced and non-tagged control
Fig. 16.

Representative tandem MS spectra of ABS tagged nitrated C2C12 proteins obtained by nanoLC–FTICR–MS–MS analysis of in-gel digests. Reduction of 3-NT (with 10 mM Na2S2O4) and tagging with 2 mM ABS and 20 μM K3Fe(CN)6 in 100 mM Na2HPO4, pH 9.0, was performed on non-digested protein samples (containing 100 μg protein and 5 μM 3-NT in a 100-μL volume). MS–MS spectra show the type I product (Y + 366 AMU) of ABS tagged sequences for murine actin peptide GY*SFTTTAER (a), and murine lactate dehydrogenase peptide QVVDSAY*EVIK (b)
Discussion
Our data show that fluorogenic ABS tagging of 3-NT offers a quantitative approach to analyze the 3-NT content in peptides and proteins in biological matrices by fluorescence spectrometry. Since 3-NT has been recognized as important biomarker of oxidative stress involved in pathogenesis and progression of multiple diseases, numerous studies were designed to develop analytical methods suitable to quantify 3-NT in tissues and biological fluids in the lower nM range to approach (patho)physiologically relevant concentrations of the analyte [19, 39, 40]. It should be underlined that most quantitative methods based on LC, LC–MS–MS or GC–MS–MS have been designed for the quantitative determination of free 3-NT and must be modified for the analysis of site specific nitration in proteins. Protein sequence-specific techniques, such as LC–MS–MS of protein digests, are more qualitative unless authentic standards for quantitation are synthesized or stable isotope-labeling is used for comparative quantitation [16, 19, 40]. The latter procedures require application of sophisticated analytical procedures and instrumentation. Our approach offers some advantages over existing quantitative methods. First, it does not require complete hydrolysis of proteins to free amino acids and, therefore, may be used in biological systems of different complexity, potentially as non-destructive tool to study protein nitration even at the cell and tissue level. Second, quantification of 3-NT levels can be achieved through common fluorescence spectrometry using standard fluorescence spectrophotometers. Third, the method utilizes a principle of fluorogenic derivatization, which is selective to the presence of two reactive groups, aromatic hydroxyl and/or amine, in ortho position. The latter is characteristic for 3-AT, but also for DOPA. Differentiation between 3-NT and DOPA (or 5-OH-Trp) is easily achieved through the reduction step, transforming 3-NT to 3-AT, whereas the two other oxidatively modified amino acids would derivatize without prior reduction. Importantly, fluorescent PBO products can only form from the analyte and two other low-abundant protein modifications, and not from any other reactive groups present in polypeptides and amino acids. ABS tagging under optimized reaction conditions stoichiometrically converts peptide 3-NT into fluorescent PBO products, and the yield of a single product reached >95% by LC. Quantification of fluorescent PBO peptide products can be easily achieved through fluorescence spectrometry due to very high fluorescence quantum yields of the PBO derivatives (~0.77 based on comparison with a reference fluorescent peptide). Spectral analysis shows that by subtracting background controls (in the absence of 3-NT) we are able to detect ~1 pmol (5 nM) 3-NT peptide at excitation and emission wavelengths of 360 and 490 nm, respectively (Fig. 8). A statistically reliable limit of detection was, however, one order of magnitude higher, i.e. 12 and 40 pmol for the model 3-NT peptide alone and for the peptide in the presence of 100 μg digested proteins from C2C12 cells, respectively, due to the presence of background fluorescence. We identified two sources of background fluorescence, which are ABS- and protein concentration-dependent. The latter is the main source of background fluorescence at protein amounts >10 μg, and most probably associated with tryptophan oxidation to form kynurenin. At present, it is unclear how to avoid this background fluorescence though it would greatly improve the limit of 3-NT detection by fluorogenic tagging. One potential way could be additional pre-separation/enrichment of 3-NT peptides by an affinity step, and we have synthesized an ABS derivative, which is appended with an affinity tag for this purpose (unpublished results). So far, the sensitivity of quantitative analysis of 3-NT through ABS tagging is lower than reported for LC–MS–MS and GC–MS–MS methods (0.02–0.2 and 0.125–0.3 nM free 3-NT, respectively, in biological matrices such as blood plasma; reviewed in [39]). Nevertheless, irrespective of potential improvements of sensitivity, fluorogenic tagging of 3-NT in peptides and proteins has one advantage over other methods: the quantitative analysis can be combined with sequence-specific qualitative analysis of protein nitration using either gel-based or non-gel-based proteomic methodologies [40–42], thus meeting some requirements for quantitative redox proteomics analysis in physiology and diseases.
Our protocol for quantitative fluorogenic tagging with ABS involves (i) protein digestion with trypsin, (ii) peptide 3-NT reduction to 3-AT with Na2S2O4 followed by reversed-phase chromatography to separate peptides from unreacted Na2S2O4, and (iii) reaction of 3-AT peptides at room temperature for 1 h with 2 mM ABS and 5 μM K3Fe(CN)6 to form fluorescent PBO products. The latter concentrations are recommended for samples with a sub-micromolar content of 3-NT; for samples with unknown, potentially higher amounts of 3-NT, or samples potentially containing strong iron chelators, tests with a series of elevated K3Fe(CN)6 concentrations are suggested to identify optimal concentrations with maximal fluorescence yield. The tagged fluorescent peptides are quantified by fluorescence spectroscopy, and available for a sequence-specific characterization by LC–MS–MS analysis. The detection limits for tandem MS identification of tagged sequences depend not only on the relative abundance of fluorescent derivatives, but also on the homogeneity of fluorescent products, and the resolution of chromatographic system. Optimization of LC–MS–MS analysis of ABS tagged peptides in complex peptide mixtures from biological samples was beyond the scope of current study focused on fluorogenic derivatization of peptide 3-NT for quantitative fluorescence determination of protein nitration. However, our preliminary results show that the approach of fluorogenic ABS tagging is applicable to a broad range of proteomic research on protein nitration in biological systems.
Acknowledgments
This research was supported by NIH grants AG23551 (C.S.), AG25350, (C.S.), DK073594 (R.D.), and by a grant from Pfizer (C.S.). The authors thank Dr. D. Yakovlev (Biochemical Research Service Laboratory, University of Kansas) for peptide synthesis and purification.
References
- 1.Aulak KS, Miyagi M, Yan L, West KA, Massilon D, Crabb JW, Stuehr DJ. Proc Natl Acad Sci USA. 2001;98:12056–12061. doi: 10.1073/pnas.221269198. [DOI] [PMC free article] [PubMed] [Google Scholar]
- 2.Greenacre SAB, Ischiropoulos H. Free Rad Res. 2001;34:541–581. doi: 10.1080/10715760100300471. [DOI] [PubMed] [Google Scholar]
- 3.Ischiropoulos H, Beckman JS. J Clin Invest. 2003;111:163–169. doi: 10.1172/JCI17638. [DOI] [PMC free article] [PubMed] [Google Scholar]
- 4.Kanski J, Alterman M, Schöneich C. Free Radic Biol Med. 2003;35:1229–1239. doi: 10.1016/s0891-5849(03)00500-8. [DOI] [PubMed] [Google Scholar]
- 5.Kanski J, Behring A, Pelling J, Schöneich C. Am J Physiol Heart Circ Physiol. 2005;288:H371–H381. doi: 10.1152/ajpheart.01030.2003. [DOI] [PubMed] [Google Scholar]
- 6.Kanski J, Hong SJ, Schöneich C. J Biol Chem. 2005;280:24261–24266. doi: 10.1074/jbc.M501773200. [DOI] [PubMed] [Google Scholar]
- 7.Turko IV, Murad F. Pharmacol Rev. 2002;54:619–634. doi: 10.1124/pr.54.4.619. [DOI] [PubMed] [Google Scholar]
- 8.Sacksteder CA, Qian WJ, Knyushko TV, Wang H, Chin MH, Lacan G, Melega WP, Camp DG, Smith RD, Smith DJ, Squier TC, Bigelow DJ. Biochemistry. 2006;45:8009–8022. doi: 10.1021/bi060474w. [DOI] [PubMed] [Google Scholar]
- 9.Turko IV, Li L, Aulak KS, Stuehr DJ, Chang JY, Murad F. J Biol Chem. 2003;278:33972–33977. doi: 10.1074/jbc.M303734200. [DOI] [PubMed] [Google Scholar]
- 10.Pacher P, Beckman JS, Liaudet L. Physiol Rev. 2007;87:315–424. doi: 10.1152/physrev.00029.2006. [DOI] [PMC free article] [PubMed] [Google Scholar]
- 11.Radi R. Proc Natl Acad Sci USA. 2004;101:4003–4008. doi: 10.1073/pnas.0307446101. [DOI] [PMC free article] [PubMed] [Google Scholar]
- 12.Xu S, Ying J, Jiang B, Guo W, Sharov VS, Lazar H, Menzoian J, Bigelow D, Schöneich C, Cohen R. Am J Physiol Heart Circ Physiol. 2006;290:H2220–H2227. doi: 10.1152/ajpheart.01293.2005. [DOI] [PubMed] [Google Scholar]
- 13.Reynolds MR, Reyes JF, Fu Y, Bigio EH, Guillozet-Bongaarts AL, Berry RW, Binder LI. J Neurosci. 2006;26:10636–10645. doi: 10.1523/JNEUROSCI.2143-06.2006. [DOI] [PMC free article] [PubMed] [Google Scholar]
- 14.Mayya V, Rezual K, Wu L, Fong MB, Han DK. Mol Cell Proteomics. 2006;5:1146–1157. doi: 10.1074/mcp.T500029-MCP200. [DOI] [PubMed] [Google Scholar]
- 15.Kanski J, Schöneich C. Methods Enzymol. 2005;396:160–171. doi: 10.1016/S0076-6879(05)96016-3. [DOI] [PubMed] [Google Scholar]
- 16.Radabaugh MR, Nemirovskiy OV, Misko TP, Aggarwal P, Matheus WR. Anal Biochem. 2008;380:68–76. doi: 10.1016/j.ab.2008.05.019. [DOI] [PubMed] [Google Scholar]
- 17.Nikov G, Bhat V, Wishnok JS, Tannenbaum SR. Anal Biochem. 2003;320:214–222. doi: 10.1016/s0003-2697(03)00359-2. [DOI] [PubMed] [Google Scholar]
- 18.Zhang Q, Qian WJ, Knyushko TV, Clauss TR, Purvine SO, Moore RJ, Sacksteder CA, Chin MH, Smith DJ, Camp DG, 2nd, Bigelow DJ, Smith RD. J Proteome Res. 2007;6:2257–2268. doi: 10.1021/pr0606934. [DOI] [PubMed] [Google Scholar]
- 19.Nuriel T, Deeb RS, Hajjar DP, Gross SS. Methods Enzymol. 2008;441:1–17. doi: 10.1016/S0076-6879(08)01201-9. [DOI] [PMC free article] [PubMed] [Google Scholar]
- 20.Pennington JP, Schöneich C, Stobaugh JF. Chromatographia. 2007;66:649–659. [Google Scholar]
- 21.Sharov VS, Dremina ES, Pennington J, Killmer J, Asmus C, Thorson M, Hong SJ, Li X, Stobaugh JF, Schöneich C. Methods Enzymol. 2008;441:19–32. doi: 10.1016/S0076-6879(08)01202-0. [DOI] [PubMed] [Google Scholar]
- 22.Gallo-Rodriguez C, Ji XD, Melman N, Siegman BD, Sanders LH, Orlina J, Fischer B, Pu Q, Olah ME, van Galen PJ, et al. J Med Chem. 1994;37:636–646. doi: 10.1021/jm00031a014. [DOI] [PMC free article] [PubMed] [Google Scholar]
- 23.Pryor WA, Cueto R, Jin X, Koppenol WH, Ngu-Schwemlein M, Squadrito GL, Uppu PL, Uppu RM. Free Radic Biol Med. 1995;18:75–83. doi: 10.1016/0891-5849(94)00105-s. [DOI] [PubMed] [Google Scholar]
- 24.Sharov VS, Galeva NA, Knyushko TV, Bigelow DJ, Williams TD, Schöneich C. Anal Biochem. 2002;308:328–335. doi: 10.1016/s0003-2697(02)00261-0. [DOI] [PubMed] [Google Scholar]
- 25.Morris JV, Mahaney MA, Huber JR. J Phys Chem. 1976;80:969–974. [Google Scholar]
- 26.Girgis AS, Kalmouch A, Hosni HM. Amino Acids. 2004;26:139–146. doi: 10.1007/s00726-003-0051-7. [DOI] [PubMed] [Google Scholar]
- 27.Ikehata K, Duzhak TG, Galeva NA, Ji T, Koen YM, Hanzlik RP. Chem Res Toxicol. 2008;21:1432–1442. doi: 10.1021/tx800093k. [DOI] [PMC free article] [PubMed] [Google Scholar]
- 28.Miller JC, Miller JN. Statistics for analytical chemistry. Ellis Horwood; London: 1992. pp. 115–117. [Google Scholar]
- 29.Stadtman ER, Levine RL. Amino Acids. 2003;25:207–218. doi: 10.1007/s00726-003-0011-2. [DOI] [PubMed] [Google Scholar]
- 30.Kato Y, Kawakishi S, Aoki T, Itakura K, Osawa T. Biochem Biophys Res Commun. 1997;234:82–84. doi: 10.1006/bbrc.1997.6587. [DOI] [PubMed] [Google Scholar]
- 31.Ronsein G, Oliveira MCB, Miyamoto S, Medeiros MHG, Di Mascio P. Chem Res Toxicol. 2008;21:1271–1283. doi: 10.1021/tx800026g. [DOI] [PubMed] [Google Scholar]
- 32.Matin A, Streete IM, Jamie IM, Truscott RJW, Jamie JF. Anal Biochem. 2006;349:96–102. doi: 10.1016/j.ab.2005.10.039. [DOI] [PubMed] [Google Scholar]
- 33.Fukunaga Y, Katsuragi Y, Izumi T, Sakiyama F. J Biochem. 1982;92:129–141. doi: 10.1093/oxfordjournals.jbchem.a133909. [DOI] [PubMed] [Google Scholar]
- 34.Gauthier MA, Klok HA. Chem Commun (Camb) 2008;23:2591–2611. doi: 10.1039/b719689j. [DOI] [PubMed] [Google Scholar]
- 35.Fujino K, Yoshitake T, Kehr J, Nohta H, Yamaguchi M. J Chromatogr A. 2003;1012:169–177. doi: 10.1016/s0021-9673(03)01180-4. [DOI] [PubMed] [Google Scholar]
- 36.Sharov VS, Galeva NA, Kanski J, Williams TD, Schöneich C. Exp Gerontol. 2006;41:407–416. doi: 10.1016/j.exger.2006.02.012. [DOI] [PubMed] [Google Scholar]
- 37.Dairou J, Pluvinage B, Noiran J, Petit E, Vinh J, Haddad I, Mary J, Dupret JM, Rodrigues-Lima F. J Mol Biol. 2007;372:1009–1021. doi: 10.1016/j.jmb.2007.07.011. [DOI] [PubMed] [Google Scholar]
- 38.Sharov VS, Galeva NA, Dremina ES, Williams TD, Schöneich C. Arch Biochem Biophys. 2009;484:155–166. doi: 10.1016/j.abb.2008.12.012. [DOI] [PMC free article] [PubMed] [Google Scholar]
- 39.Ryberg H, Caidahl K. J Chromatogr B. 2007;851:160–171. doi: 10.1016/j.jchromb.2007.02.001. [DOI] [PubMed] [Google Scholar]
- 40.Bigelow DJ, Qian WJ. Methods Enzymol. 2008;440:192–205. doi: 10.1016/S0076-6879(07)00811-7. [DOI] [PubMed] [Google Scholar]
- 41.Schöneich C, Sharov VS. Free Radic Biol Med. 2006;41:1507–1520. doi: 10.1016/j.freeradbiomed.2006.08.013. [DOI] [PubMed] [Google Scholar]
- 42.Sharov VS, Schöneich C. Expert Rev Proteomics. 2007;4:309–321. doi: 10.1586/14789450.4.2.309. [DOI] [PubMed] [Google Scholar]