

Abstract
The peroxisome proliferator-activated receptor alpha (PPARα) activator fenofibrate efficiently decreases plasma triglycerides (TG), which is generally attributed to enhanced very low density lipoprotein (VLDL)-TG clearance and decreased VLDL-TG production. However, because data on the effect of fenofibrate on VLDL production are controversial, we aimed to investigate in (more) detail the mechanism underlying the TG-lowering effect by studying VLDL-TG production and clearance using APOE*3-Leiden.CETP mice, a unique mouse model for human-like lipoprotein metabolism. Male mice were fed a Western-type diet for 4 weeks, followed by the same diet without or with fenofibrate (30 mg/kg bodyweight/day) for 4 weeks. Fenofibrate strongly lowered plasma cholesterol (−38%) and TG (−60%) caused by reduction of VLDL. Fenofibrate markedly accelerated VLDL-TG clearance, as judged from a reduced plasma half-life of glycerol tri[3H]oleate-labeled VLDL-like emulsion particles (−68%). This was associated with an increased post-heparin lipoprotein lipase (LPL) activity (+110%) and an increased uptake of VLDL-derived fatty acids by skeletal muscle, white adipose tissue, and liver. Concomitantly, fenofibrate markedly increased the VLDL-TG production rate (+73%) but not the VLDL-apolipoprotein B (apoB) production rate. Kinetic studies using [3H]palmitic acid showed that fenofibrate increased VLDL-TG production by equally increasing incorporation of re-esterified plasma fatty acids and liver TG into VLDL, which was supported by hepatic gene expression profiling data. We conclude that fenofibrate decreases plasma TG by enhancing LPL-mediated VLDL-TG clearance, which results in a compensatory increase in VLDL-TG production by the liver.
Keywords: Lipolysis, Lipoprotein, Lipoprotein Secretion, PPAR, Triacylglycerol, VLDL, Fenofibrate
Introduction
The lipid-lowering agent fenofibrate reduces plasma triglyceride (TG)2 levels and increases high density lipoprotein-cholesterol (HDL-C) levels, which generates a less atherogenic lipid phenotype (1, 2). Fenofibrate acts through activation of peroxisome proliferator-activated receptor alpha (PPARα) thereby altering the expression of genes involved in lipid metabolism (3, 4, 5). Several mechanisms of action have been proposed through which fenofibrate lowers TG levels, including increased very low density lipoprotein (VLDL)-TG clearance and decreased hepatic TG production (5).
VLDL-TG clearance is governed by lipoprotein lipase (LPL), of which the expression is potently induced by PPARα (6). In addition, it has been shown that PPARα agonists down-regulate the expression of the LPL inhibitor apolipoprotein CIII (apoCIII) and up-regulate the expression of the LPL activator apoAV (7). Altogether this results in an increase in LPL-mediated lipolysis and clearance of VLDL. Indeed, two human studies show that fenofibrate increases the fractional catabolic rate (FCR) of VLDL-apoB in patients with hypertriglyceridemia without or with type 2 diabetes (8, 9), which is associated with increased LPL activity (9).
Hepatic VLDL production is dependent on the availability of fatty acids (FA) which is determined by de novo FA synthesis, FA/TG uptake from the circulation and β-oxidation of FA in the liver. PPARα has been shown to influence VLDL production in mice. PPARα deficiency in mice increased hepatic VLDL-TG production (10, 11), and the selective PPARα agonist Wy14643 lowered VLDL-TG production, at least in severely hypertriglyceridemic angiopoietin-like protein 4 (Angptl4) transgenic mice (12). Limited data exist on the specific effect of fenofibrate on hepatic VLDL production. Although in vitro experiments using cultured hepatocytes show that fenofibrate, among other fibrates, decreases the production of both VLDL-TG and apoB (13, 14), in vivo data on the effects of fenofibrate on VLDL production are scarce. A single human study showed that fenofibrate had no effect on the VLDL-apoB production rate (8), but the effect of fenofibrate on VLDL-TG production has not been reported.
Our aim was to investigate in detail the mechanism underlying the VLDL-TG lowering effect of fenofibrate in vivo. We used APOE*3-Leiden.CETP (E3L.CETP) mice (15, 16) that express human CETP under control of its natural flanking regions (17). These mice have an attenuated clearance of apoB-containing lipoproteins and, therefore, show a human-like lipoprotein profile on a cholesterol-rich Western-type diet as characterized by increased plasma levels of cholesterol and TG (16, 18). Our data show that treatment of E3L.CETP mice on a Western-type diet with fenofibrate decreases plasma VLDL-TG as explained by increased VLDL-TG clearance resulting from enhanced LPL activity, but increases VLDL-TG production by increasing lipidation of apoB with TG that is equally derived from esterification of plasma FA and hepatic stores.
EXPERIMENTAL PROCEDURES
Animals
Hemizygous human CETP transgenic mice, expressing a human CETP minigene under the control of its natural flanking regions (17) were purchased from the Jackson Laboratory (Bar Harbor, ME) and crossbred with hemizygous E3L mice (15) at our Institutional Animal Facility to obtain E3L.CETP mice (16). In this study, male E3L.CETP and wild-type mice (both C57Bl/6 background) were used, housed under standard conditions in conventional cages with free access to food and water. At the age of 12 weeks, mice were fed a semi-synthetic cholesterol-rich diet, containing 0.25% (w/w) cholesterol, 1% (w/w) corn oil, and 14% (w/w) bovine fat (Western-type diet) (Hope Farms, Woerden, The Netherlands) for 4 weeks. Upon randomization according to plasma total cholesterol (TC) and triglyceride (TG) levels, mice received Western-type diet without or with 30 mg/kg bodyweight/day (0.03%, w/w) fenofibrate (Sigma). This dose is relevant to the human situation, as it corresponds with 210 mg fenofibrate per day for a 70 kg person taking into account a 10-fold higher (drug) metabolism in mice. Experiments were performed after 4 h of fasting at 12:00 pm with food withdrawn at 8:00 am. The Institutional Ethical Committee on Animal Care and Experimentation has approved all experiments.
Plasma Lipid and Lipoprotein Analysis
Plasma was obtained via tail vein bleeding as described (19) and assayed for TC and TG, using the commercially available enzymatic kits 236691 and 11488872 (Roche Molecular Biochemicals), respectively. The distribution of lipids over plasma lipoproteins was determined using fast protein liquid chromatography (FPLC). Plasma was pooled per group, and 50 μl of each pool was injected onto a Superose 6 PC 3.2/30 column (Äkta System, Amersham Biosciences) and eluted at a constant flow rate of 50 μl/min in PBS, 1 mm EDTA, pH 7.4. Fractions of 50 μl were collected and assayed for TC and TG as described above. HDL was isolated after precipitation of apoB-containing lipoproteins from 20 μl of EDTA plasma by adding 10 μl of heparin (LEO Pharma, The Netherlands; 500 units/ml) and 10 μl of 0.2 m MnCl2. The mixtures were incubated for 20 min at room temperature and centrifuged for 15 min at 13,000 rpm at 4 °C. HDL-C was measured in the supernatant using enzymatic kit 236691 (Roche Molecular Biochemicals).
In Vivo Clearance of VLDL-like Emulsion Particles
Glycerol tri[3H]oleate (triolein, TO)- and [1α,2α(n)-14C]cholesteryl oleate (CO)-double labeled VLDL-like emulsion particles (80 nm) were prepared as described by Rensen et al. (20). In short, radiolabeled emulsions were obtained by adding 100 μCi of [3H]TO and 10 μCi of [14C]CO to 100 mg of emulsion lipids before sonication (isotopes obtained from GE Healthcare, Little Chalfont, UK). Mice were fasted for 4 h, sedated with 6.25 mg/kg acepromazine (Alfasan), 6.25 mg/kg midazolam (Roche), and 0.3125 mg/kg fentanyl (Janssen-Cilag) and injected with the radiolabeled emulsion particles (1.0 mg of TG in 200 μl PBS) via the tail vein. At indicated time points after injection, blood was taken from the tail vein to determine the serum decay of [3H]TO and [14C]CO. At 30 min after injection, plasma was collected by orbital puncture, and mice were sacrificed by cervical dislocation. Organs were harvested and saponified to determine [3H]TO and [14C]CO uptake.
Hepatic Lipase and Lipoprotein Lipase Assay
To liberate LPL from endothelium, 4-h fasted mice were injected intraperitoneally with heparin (0.5 units/g bodyweight; Leo Pharmaceutical Products BV., Weesp, The Netherlands), and blood was collected after 20 min. Total hepatic lipase (HL) and LPL activity was analyzed as modified from Zechner (21). In short, 10 μl of post-heparin plasma was incubated with 0.2 ml of TG substrate mixture containing triolein (4.6 mg/ml) and [3H]TO (2.5 μCi/ml) (19) for 30 min at 37 °C in the presence or absence of 1 m NaCl, which completely inhibits LPL activity, to estimate both the HL and LPL activity. The LPL activity was calculated as the fraction of total triacylglycerol hydrolase activity that was inhibited by the presence of 1 m NaCl and is expressed as the amount of free FA released per hour per ml of plasma.
Hepatic VLDL-TG and VLDL-apoB Production
Mice were fasted for 4 h prior to the start of the experiment. During the experiment, mice were sedated as described above. At t = 0 min blood was taken via tail bleeding and mice were i.v. injected with 100 μl of phosphate-buffered saline containing 100 μCi of Trans35S label to measure de novo total apoB synthesis. After 30 min, the animals received 500 mg of tyloxapol (Triton WR-1339, Sigma-Aldrich) per kg body weight as a 10% (w/w) solution in sterile saline, to prevent systemic lipolysis of newly secreted hepatic VLDL-TG (22). Additional blood samples were taken at t = 15, 30, 60, and 90 min after tyloxapol injection and used for determination of plasma TG concentration. At 120 min, the animals were sacrificed, and blood was collected by orbital puncture for isolation of VLDL by density gradient ultracentrifugation. [35S]apoB was measured in the VLDL fraction after apoB-specific precipitation with isopropanol (23, 24, 25). Particle size and homogeneity of isolated VLDL was measured by dynamic light scattering (DLS) with a Malvern Zetasizer Nano ZS (Malvern, Herrenberg, Germany) equipped with a 633 nm He-Ne laser and operating at an angle of 173° and temperature of 25 °C. Data were collected and analyzed to yield distribution of number and polydispersity index by Dispersion Technology Software version 6.01 from Malvern.
Hepatic Lipid Analysis
Livers were isolated and partly homogenized (30 s at 5,000 rpm) in saline (∼10% wet w/v) using a mini-bead beater (Biospec Products, Inc., Bartlesville, OK). Lipids were extracted as described (26) and separated by high performance thin layer chromatography (HPTLC). Lipid spots were stained with color reagent (5 g of MnCl2·4H2O, 32 ml of 95–97% H2SO4 added to 960 ml of CH3OH:H2O 1:1 v/v) and quantified using TINA® version 2.09 software (Raytest, Straubenhardt, Germany).
Hepatic Gene Expression Analysis
Total RNA was extracted from individual livers using RNA-Bee (Bio-Connect, Huissen, The Netherlands) and glass beads according to the manufacturer's instructions. The RNA was further purified using the nucleospin RNA II kit (Machery-Nagel, Düren, Germany) according to the manufacturer's instructions. The integrity of each RNA sample obtained was examined by Agilent Lab-on-a-chip technology using a RNA 6000 Nano LabChip kit and a Bioanalyzer 2100 (Agilent Technologies, Amstelveen, The Netherlands). The Affymetrix 3′ IVT-Express labeling kit (901229) and the protocols optimized by Affymetrix were used to synthesize Biotin-labeled cRNA (from 100 ng of total RNA) for microarray hybridization. For the hybridization 15 μg of cRNA was used for further fragmentation and finally 10 μg for the hybridizations. The quality of intermediate products (that is, biotin-labeled cRNA and fragmented cRNA) was again checked. Microarray analysis was carried out using an Affymetrix technology platform and Affymetrix GeneChip® mouse genome 430 2.0 arrays. Briefly, fragmented cRNA was mixed with spiked controls and hybridized with murine GeneChip® 430 2.0 arrays. The hybridization, probe array washing, and staining, and washing procedures were executed as described in the Affymetrix protocols, and probe arrays were scanned with a Hewlett-Packard Gene Array Scanner (ServiceXS, Leiden, The Netherlands). Quality control of microarray data were performed using BioConductor packages (including simpleaffy and affyplm), through the NuGO pipeline that is available as a Genepattern procedure (27). All samples passed the QC. Raw signal intensities (from CEL-files) were normalized using the GCRMA algorithm (gc-rma slow). For annotation of probes and summarization of signals from probes representing one gene the custom MNBI CDF-file was used (based on EntrezGene, version 11.0.2). This resulted in expression values for 16331 genes, represented by unique Entrez gene identifiers. Genes were filtered for expression above 5 in 3 or more samples, resulting in a set of 11587 genes that was used for further analysis. Gene expression data were log-transformed (base 2). Statistical analysis on resulting data was performed using the moderated t test (Limma) with correction for multiple testing (28). Cut-off for statistically significant changes was set at corrected p value (q-value) <0.05 (GEO accession number GSE21211). In addition, T-profiler analysis (29) was performed using expression values corrected for mean expression in the control group. This analysis resulted in scores (t-scores) and significance values for functional gene sets and biological processes (based on gene ontology annotation). Gene sets and biological processes with significant scores (>4 or <-4) in 5 or 6 animals per group were selected. A hierarchical clustering of these pathways and biological processes and their scores in all samples was generated in GenePattern (Broad Institute, MIT) (30).
Analysis of Pathways Contributing to Hepatic VLDL-TG Secretion
Mice were fasted for 2 h with food withdrawn at 8:00 AM prior to the start of the experiment. During the experiment, mice were sedated as described above. At t = −2 h mice received a continuous i.v. infusion of 3H-labeled FA ([9,10(n)-3H]palmitic acid in sterile saline with 2% bovine serum albumin) at a rate of 100 μl/h (1.6 μCi/h). Blood samples were taken at t = −30 and 0 min, and the mice received 500 mg of tyloxapol (Triton WR-1339, Sigma-Aldrich) per kg body weight as a 10% (w/w) solution in sterile saline. Additional blood samples were taken at t = 15, 30, 60, and 90 min after tyloxapol injection. All blood samples were taken using chilled paraoxon-coated capillaries. Plasma TG and FA were determined as described above. The amount of 3H activity in the FA and TG fraction of all plasma samples was determined after lipid extraction from plasma according to Bligh and Dyer (26). The lipid fraction was dried under nitrogen, dissolved into chloroform/methanol (5:1, v/v) and subjected to thin layer chromatography (TLC) on silica gel plates by using hexane/diethylether/acetic acid (83:16:1, v/v/vol) as resolving solution. Triolein and palmitic acid were used as internal standards. Plasma samples obtained at t = −30 and 0 min were used to ensure steady state was reached for the specific activity (SA) of both [3H]FA as well as [3H]TG prior to the tyloxapol injection. The production rate of [3H]TG and TG was calculated from the slope of the curve from t = 0 to t = 90 min and expressed as dpm/min and nmol/min, respectively. As the production rate of [3H]TG represents the rate of FA produced as TG, the production rate of FA within TG was calculated by multiplying the TG production rate by 3. This production rate represents the total rate of FA incorporation into VLDL-TG. The specific activity (SA) of the VLDL precursor pool (pTG) is given by the ratio of [3H]TG production and TG production (Equation 1; production rate is indicated with an accent '). The relative contribution of plasma FA to the VLDL-TG precursor pool can be estimated by dividing the SA of the pTG pool by the average SA of plasma FFA (Equation 2; average was taken over the time interval t = −30 to +60 min). Equation 2 gives the ratio of the rate of incorporation of FA in VLDL-TG, that is directly derived from plasma (V1), and the total rate of FA incorporation into VLDL-TG (V1+V2; see also Fig. 5C); the contribution of liver TG to VLDL-TG is represented by V2. By Equations 1 and 2 and the definition (TG)′ = V1+V2, we obtain an expression for V1 (Equation 3).
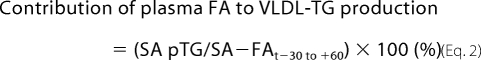 |
FIGURE 5.

Fenofibrate equally increases the incorporation of both plasma FA and liver TG in VLDL-TG in E3L.CETP mice. Mice received a Western-type diet without or with fenofibrate (0.03%, w/w). Mice were continuously infused with [3H]palmitic acid after 2 h of fasting and received tyloxapol after 4 h of fasting, and the increase in plasma TG (A) and [3H]TG (B) was subsequently measured. According to the equations as schematically represented (C), the relative contribution of re-esterified plasma FA to VLDL-TG production was calculated (D). Data are means ± S.E. (n = 5). *, p < 0.05. V1, incorporation rate of plasma FA in VLDL-TG; V2, incorporation rate of liver TG in VLDL-TG; pTG, VLDL precursor pool.
Statistical Analysis
All data are presented as means ± S.E. unless indicated otherwise. Data were analyzed using the unpaired Student's t test. p values less than 0.05 were considered statistically significant.
RESULTS
Fenofibrate Decreases VLDL and Increases HDL in E3L.CETP Mice
To confirm that fenofibrate decreases VLDL-TG in E3L.CETP mice, mice were fed a cholesterol-rich Western-type diet for 4 weeks (t0). Mice were randomized, and fed the same diet without (time-matched control group) or with fenofibrate (30 mg/kg bodyweight/day) for another 4 weeks (t4). At both t0 and t4, plasma was assayed for lipids (supplemental Fig. S1). As compared with the time-matched control group, fenofibrate decreased plasma cholesterol (−38%; 5.0 ± 0.2 versus 8.0 ± 0.7 mmol/liter; p < 0.001) (supplemental Fig. S1A). Lipoprotein profiling showed that this was the net effect of a large reduction of VLDL-C (∼85%) and an increase in HDL-C (∼55%) (supplemental Fig. S1B). The increase in HDL-C was confirmed by directly measuring HDL-C in plasma after precipitation of apoB-containing lipoproteins (+52%; 2.1 ± 0.1 versus 1.4 ± 0.1 mmol/liter; p < 0.001) (supplemental Fig. S1C). The decrease in VLDL-C was accompanied by a large reduction in plasma TG (−60%; 0.7 ± 0.2 versus 1.9 ± 0.2; p < 0.001) (supplemental Fig. S1D), which was specific for VLDL (not shown).
Fenofibrate Increases VLDL-TG Clearance by Enhancing VLDL-TG Hydrolysis and Hepatic Uptake of VLDL Remnants
Plasma VLDL-TG levels are determined by the balance between VLDL-TG production and VLDL-TG clearance. To evaluate whether an increased VLDL-TG clearance may contribute to the fenofibrate-mediated reduction in VLDL-TG levels, control, and fenofibrate-treated E3L.CETP mice were injected with [3H]TO- and [14C]CO-labeled VLDL-like emulsion particles and the plasma clearance was determined (Fig. 1). Fenofibrate reduced the plasma half-life of [3H]TO as compared with time-matched control mice by −68% (t1/2 = 6.8 ± 0.9 min versus 21.0 ± 6.3 min; p < 0.005) (Fig. 1A) as reflected by an increase in uptake of [3H]TO-derived activity by liver, skeletal muscle and white adipose tissue (Fig. 1B). Likewise, fenofibrate reduced the plasma half-life of [14C]CO by −80% (t1/2 = 11.0 ± 1.7 min versus 56.6 ± 11.7 min; p < 0.005) (Fig. 1C), as mainly reflected by an increased uptake of [14C]CO by the liver (Fig. 1D).
FIGURE 1.

Fenofibrate increases the clearance of VLDL-like emulsion particles in E3L.CETP mice. Mice received a Western-type diet without or with fenofibrate (0.03% w/w). After 4 h of fasting, mice were injected with [3H]TO and [14C]CO-labeled VLDL-like emulsion particles (1 mg of TG), and plasma samples were taken at indicated time points to determine the plasma clearance of [3H]TO (A) and [14C]CO (C). At 30 min after injection, the uptake of 3H-activity (B) and 14C activity (D) was determined in liver, heart, skeletal muscle, and gonadal white adipose tissue (gWAT). Data are means ± S.E. (n = 5). *, p < 0.05; **, p < 0.01; ***, p < 0.001.
To determine whether the accelerated clearance of VLDL-like emulsion particles was due to an increase in the lipolytic activity of plasma, HL and LPL activity was determined in plasma after heparin injection (Fig. 2). Fenofibrate increased postheparin plasma HL activity by +67% (12.3 ± 1.4 versus 7.4 ± 0.9 μmol FFA/h/ml; p < 0.0001) as well as postheparin plasma LPL activity by +110% (25.1 ± 3.1 versus 12.0 ± 2.5 μmol of FFA/h/ml; p < 0.0001).
FIGURE 2.

Fenofibrate increases hepatic lipase and lipoprotein lipase activity in postheparin plasma of E3L.CETP mice. Mice received a Western-type diet without or with fenofibrate (0.03% w/w). After 4 h of fasting, heparin was injected, and postheparin plasma was collected. Plasma was incubated with a [3H]TO-containing substrate mixture in the absence or presence of 1 m NaCl, to estimate both the HL and LPL activity. Data are means ± S.E. (n = 8). ****, p < 0.0001.
Fenofibrate Increases VLDL-TG Production but Not VLDL-apoB Production
To determine the effect of fenofibrate on VLDL-TG production by the liver, control, and fenofibrate-treated E3L.CETP mice were injected with Trans35S and tyloxapol and VLDL production was determined (Fig. 3). Surprisingly, fenofibrate caused an increase in the accumulation of plasma TG (Fig. 3A). The VLDL-TG production rate, as determined from the slope of the curve, was increased by +73% (11.8 ± 0.6 versus 6.8 ± 0.5 μmol of TG/h; p < 0.0001) (Fig. 3B). The rate of VLDL-apoB production was not altered (Fig. 3C), indicating that fenofibrate increases the lipidation of VLDL particles in the liver rather than the number of VLDL particles secreted from the liver. Fenofibrate thus increased the amount of TG per mg of VLDL protein by +58% (48.3 ± 4.0 versus 30.9 ± 2.7 μmol/mg; p < 0.01) (Fig. 3D). In line with these data, fenofibrate increased the mean particle size of VLDL (74 ± 6 versus 66 ± 2 nm; p < 0.05), without adversely affecting particle homogeneity (polydispersity index 0.11 ± 0.02 versus 0.15 ± 0.02) as assessed by dynamic light scattering.
FIGURE 3.

Fenofibrate increases hepatic VLDL-TG production in E3L.CETP mice. Mice received a Western-type diet without or with fenofibrate (0.03% w/w). After 4 h of fasting, mice were consecutively injected with Trans35S label (t = −30 min) and tyloxapol (t = 0 min), and blood samples were drawn up to 90 min after tyloxapol injection. Plasma TG concentrations were determined and plotted as the increase in plasma TG as compared with baseline (A). The rate of TG production was calculated from the slopes of the curves from the individual mice (B). After 120 min, the total VLDL fraction was isolated by ultracentrifugation and the rate of newly synthesized VLDL-35S-apoB (C) as well as the amount of triglycerides (TG), total cholesterol (TC), and phospholipids (PL) per mg VLDL protein (D) was measured. Data are means ± S.E. (n = 9). *, p < 0.05; **, p < 0.01; ***, p < 0.001; ****, p < 0.0001.
To exclude the possibility that the paradoxical increase VLDL-TG production was specific for E3L.CETP mice, we also determined the effect of fenofibrate on VLDL production in wild-type mice (supplemental Fig. S2). Like in E3L.CETP mice, fenofibrate increased the VLDL-TG production rate (10.0 ± 0.3 versus 7.3 ± 0.3 μmol TG/h; p < 0.0001) (supplemental Fig. S2, A and B). Furthermore, fenofibrate slightly decreased the VLDL-apoB production rate (32.2 ± 1.7 versus 37.3 ± 1.6; p < 0.05) (supplemental Fig. S2C) and increased the amount of TG per mg of VLDL protein (28.4 ± 0.7 versus 25.4 ± 0.8 μmol/mg; p < 0.05) (supplemental Fig. S2D).
Fenofibrate Decreases Hepatic Lipid Content
Because an increase in VLDL production may result from an increased hepatic TG content (31, 32), we determined the effect of fenofibrate on hepatic lipid levels (Fig. 4). However, fenofibrate in fact tended to reduce the hepatic TG content by −20% (59.9 ± 6.5 versus 74.5 ± 7.2 mg/mg protein; p = 0.162) (Fig. 4A). In addition, fenofibrate decreased the hepatic-free cholesterol content by −19% (11.7 ± 0.3 versus 14.3 ± 0.6 mg/mg protein; p < 0.01) (Fig. 4B) as well as the hepatic cholesteryl ester content by −51% (11.9 ± 0.6 versus 24.6 ± 1.4; p < 0.0001) (Fig. 4C).
FIGURE 4.

Fenofibrate decreases hepatic lipid content in E3L.CETP mice. Mice received a Western-type diet without or with fenofibrate (0.03% w/w). Livers were collected after a 4-h fast, and lipids were extracted. TG (A), free cholesterol (FC) (B), and cholesteryl esters (CE) (C) were quantified. Data are means ± S.E. (n = 6). **, p < 0.01; ***, p < 0.001.
Fenofibrate Increases Expression of Hepatic Genes Involved in FA Uptake and Transport
To further investigate the mechanism(s) by which fenofibrate affects VLDL-TG metabolism, we determined the hepatic expression profile of 16331 well characterized mouse genes. As compared with the control group, fenofibrate resulted in 2924 differentially expressed genes. Pathway analysis, based on gene ontology annotation, revealed that fenofibrate up-regulated gene sets related to PPAR activation and lipid/energy metabolism and down-regulated gene sets related to inflammation (supplemental Fig. S3).
A selection of genes involved in VLDL metabolism is depicted in Table 1. As expected, fenofibrate up-regulated genes involved in FA oxidation including Cpt1a, Cpt1b, Acox1, Acaa1a, Acaa1b, and Acaa2. In line with our observation that fenofibrate increases VLDL-TG clearance and LPL activity in postheparin plasma, fenofibrate largely up-regulated Lpl and slightly decreased Apoc3. Fenofibrate did not largely affect FA/TG synthesis genes, apart from increasing Dgat1. Rather, fenofibrate up-regulated genes involved in FA uptake (Cd36, Ldlr), FA transport (Slc27a1, Slc27a2, Slc27a4, and Slc27a5), FA binding (Fabp1, Fabp2, Fabp4, and Fabp7), FA activation (Acsl1, Acsl3, Acsl4, and Acsl5), and VLDL assembly (Mttp). Taken together, these data suggest that fenofibrate increases hepatic VLDL-TG secretion through increased hepatic uptake, intracellular trafficking and secretion of excess FA derived from extrahepatic LPL-derived lipolysis, rather than by increased de novo FA synthesis.
TABLE 1.
Effect of fenofibrate on hepatic expression of genes involved in VLDL metabolism
Mice received a Western-type diet without or with fenofibrate (0.03%, w/w). Livers were collected after a 4-h fast, total RNA was extracted from livers of individual mice, and gene expression analysis was performed using Affymetrix GeneChip® mouse genome 430 2.0 arrays. Data are expressed as mean fold change as compared to the control group (n = 6 per group). Values in bold are considered significant (corrected p value or q-value <0.05).
| Protein | Gene | Fold change (vs control) | Corrected p value |
|---|---|---|---|
| FA oxidation | |||
| CPT1a | Cpt1a | +1.28 | 0.010 |
| CPT1b | Cpt1b | +6.08 | <0.001 |
| ACO | Acox1 | +1.51 | <0.001 |
| Thiolase | Acaa1a | +1.89 | <0.001 |
| Thiolase | Acaa1b | +1.29 | <0.001 |
| Thiolase | Acaa2 | +1.21 | <0.001 |
| Lipolysis | |||
| LPL | Lpl | +4.63 | <0.001 |
| ApoCI | Apoc1 | −1.03 | 0.235 |
| ApoCII | Apoc2 | −1.04 | 0.402 |
| ApoCIII | Apoc3 | −1.08 | 0.014 |
| ApoAV | Apoa5 | −1.15 | 0.065 |
| GPIHBP1 | Gpihbp1 | 1.08 | 0.344 |
| FA/TG synthesis | |||
| SREBP1a/c | Srebf1 | −1.11 | 0.350 |
| FAS | Fasn | +1.90 | 0.068 |
| DGAT1 | Dgat1 | +1.48 | 0.002 |
| DGAT2 | Dgat2 | −1.17 | 0.046 |
| SCD1 | Scd1 | +1.24 | 0.207 |
| SCD2 | Scd2 | +1.09 | 0.247 |
| FA uptake and transport | |||
| FATPa1 | Slc27a1 | +4.59 | <0.001 |
| FATPa2 | Slc27a2 | +1.15 | 0.001 |
| FATPa4 | Slc27a4 | +3.30 | <0.001 |
| FATPa5 | Slc27a5 | −1.07 | 0.181 |
| CD36 | Cd36 | +3.42 | <0.001 |
| LDLR | Ldlr | +1.52 | 0.016 |
| PCSK9 | Pcsk9 | +1.64 | 0.110 |
| FA binding and activation | |||
| FABP1 | Fabp1 | +1.10 | 0.012 |
| FABP2 | Fabp2 | +1.36 | 0.006 |
| FABP4 | Fabp4 | +2.19 | <0.001 |
| FABP6 | Fabp6 | +1.05 | 0.412 |
| FABP7 | Fabp7 | −3.48 | <0.001 |
| ACSL1 | Acsl1 | +2.15 | <0.001 |
| ACSL3 | Acsl3 | +3.07 | <0.001 |
| ACSL4 | Acsl4 | +1.58 | <0.001 |
| ACSL5 | Acsl5 | +1.49 | 0.001 |
| VLDL assembly | |||
| ApoB | Apob | −1.02 | 0.374 |
| ApoBEC | Apobec1 | 1.00 | 0.515 |
| MTP | Mttp | +1.42 | <0.001 |
Fenofibrate Increases VLDL-TG Production by Equally Increasing Incorporation of Re-esterified Plasma FA and Liver-derived TG into VLDL
We next investigated whether the increase in VLDL-TG production is solely the result of an increased flux of plasma FA toward the liver, and subsequent incorporation into nascent VLDL after re-esterification into TG. Hereto, we continuously infused [3H]palmitic acid while measuring the linear accumulation of VLDL-derived TG and [3H]TG in plasma after injection of tyloxapol (Fig. 5).
Fenofibrate not only increased the production rate of both VLDL-TG (+31%; p < 0.05) (Fig. 5A), which is consistent with Fig. 3A, but also increased the production rate of VLDL-[3H]TG (+63%; p < 0.05) (Fig. 5B). Fig. 5C schematically represents the model used to determine the contribution of plasma FA (V1) as compared with contribution of liver TG (V2) to the VLDL-TG production (V1 + V2). Calculating the ratio of V1 over V1+V2 shows that the estimated contribution of re-esterification of plasma FA to the total VLDL production was equal for both control and fenofibrate treated mice (46 ± 15% versus 49 ± 11%; n.s.) (Fig. 5D). These data imply that fenofibrate increases VLDL-TG production by equally increasing incorporation of re-esterified plasma FA and liver-derived TG. Indeed, fenofibrate increased VLDL-TG production by an increased incorporation of plasma FA (+38%) as well as liver TG (+25%).
DISCUSSION
We investigated the mechanisms underlying the effect of fenofibrate on VLDL metabolism. Our data show that fenofibrate decreases plasma TG levels in E3L.CETP mice, which is solely explained by an increased LPL-mediated TG clearance from plasma. Despite the generally accepted dogma that fenofibrate reduces VLDL-TG production thereby contributing to the plasma TG-lowering effect, fenofibrate in fact increases VLDL-TG production as caused in part by an increased flux of FA to the liver.
In this study, we have used E3L.CETP mice to study the effect of fenofibrate on VLDL metabolism, at a dose relevant to clinical practice in humans. We have previously observed that these mice show a human-like response to drug interventions aimed at reducing plasma levels of apoB-containing lipoproteins, including atorvastatin (33), niacin (34) and fenofibrate (18). In the present study, we confirmed that fenofibrate effectively reduces plasma TG levels (−60%) and cholesterol levels (−38%), which was the combined result of a decrease in VLDL-C (∼85%) and an increase in HDL-C (∼55%). Recently, we have shown that the HDL-raising effect of fenofibrate is explained by a reduction in hepatic cholesterol levels, which decreases hepatic CETP expression and consequently reduces plasma CETP levels (18), an effect that has also been observed in humans (35).
Because plasma VLDL-TG levels are determined by the balance between VLDL-TG production and VLDL-TG clearance, we evaluated the individual contribution of both pathways to the TG-lowering effect of fenofibrate. We observed that the TG-lowering effect of fenofibrate can be fully explained by an accelerated TG clearance from plasma. Fenofibrate appeared to increase the total triacylglycerol hydrolase capacity of plasma, as evidenced by increased HL activity (+67%) and LPL activity (+110%) in post-heparin plasma, which is likely due to increased whole-body expression of the lipase genes as reflected by a large 4.6-fold increase in hepatic Lpl mRNA. It is likely that fenofibrate further increases TG clearance by indirectly enhancing LPL activity via reduced hepatic mRNA expression of the main LPL inhibitor apoCIII. These changes are consistent with previous observations on the effects of fibrates on LPL (6) and apoCIII (7) in rodents. Likewise, fibrates have been shown to increase LPL activity (9, 36) and decrease apoCIII synthesis (7, 8, 37) in humans.
In contrast to the generally accepted view that a reduction of the VLDL-TG production contributes to the TG-lowering effect of fenofibrate, we now clearly demonstrate that fenofibrate in fact increases the VLDL-TG production in E3L.CETP mice. To exclude that this effect would be genotype-specific, we confirmed that fenofibrate increases VLDL-TG production in wild-type mice. In both mouse types, fenofibrate did not increase the VLDL-apoB production rate, implying that fenofibrate increases the lipidation of VLDL particles rather than affecting the VLDL particle production rate.
It is tempting to speculate about the mechanism(s) underlying the increasing effect of fenofibrate on VLDL-TG production. VLDL-TG production is determined by the balance between hepatic FA β-oxidation, FA/TG entry into the liver, hepatic FA/TG synthesis and hepatic TG stores. Fenofibrate increased hepatic genes involved in FA β-oxidation, which was expected from its PPARα agonistic activity (38, 39, 40). Affymetrix analysis indicated that hepatic genes involved in FA/TG synthesis were generally not affected. However, many genes involved in FA uptake and transport (Slc27a, Cd36, Ldlr), FA binding and activation (Fabp, Acsl) and FA esterification (Dgat1) were up-regulated, in addition to Mttp that is crucial for VLDL assembly. In general, these data are in line with previous reports that PPARα induces genes involved in TG synthesis and apoB lipidation (41, 42). Collectively, these data suggest that fenofibrate may increase the uptake of FA by the liver, followed by the intrahepatic binding, activation, esterification, and ultimately secretion of FA as VLDL-TG. Indeed, by performing kinetic analyses using intravenously injected [3H]FA, we demonstrated that fenofibrate increased the incorporation rate of plasma FA into nascent VLDL-TG. At the same time, fenofibrate also increased the incorporation rate of a hepatic pool of FA/TG into nascent VLDL-TG. The observed tendency toward a reduction in liver TG content can thus be explained by a combination of an increased FA β-oxidation as well as an increased secretion of hepatic TG stores incorporated in VLDL.
Taken together, the effect of fenofibrate with respect to reduction of plasma TG levels is primarily caused by an enhanced TG hydrolysis in the capillary bed of LPL-expressing tissues such as skeletal muscle and white adipose tissue. Liberated FA are not only taken up by these tissues, but also redirected toward the liver as bound to albumin (43). An increased FA flux toward the liver may then drive increased lipidation of nascent VLDL particles without influencing the VLDL particle production rate as judged from an unaltered VLDL-apoB production rate. Although the effect of fenofibrate on the VLDL-TG production rate has not been studied in humans, fenofibrate has been shown to reduce VLDL-apoB levels without affecting the VLDL-apoB production rate (8, 44), which is in agreement with our data.
So, how can we reconcile our data with the accepted dogma that fenofibrate would decrease VLDL-TG production? First, it has been generally assumed that, via increased FA β-oxidation, fenofibrate reduces the amount of FA available for VLDL-TG output (5). However, we previously showed that specific inhibition of FA β-oxidation using methyl palmoxirate does not affect VLDL-TG production despite increasing hepatic TG content (45). Moreover, this simplified assumption does not take into account that fenofibrate in fact increases the liver-directed flux of FA/TG. Second, a few models have suggested that fenofibrate reduces VLDL-TG production (10, 11, 46, 47). For example, mice deficient for PPARα have increased VLDL-TG production (10, 11). However, this could easily be caused by compensatory changes resulting from complete deficiency of PPARα. It would thus be more relevant to study PPARα activation instead of complete PPARα deficiency. Activation of PPARα has been shown to inhibit VLDL-TG secretion by primary rat hepatocytes in vitro (47). This can indeed be explained by an increase in FA β-oxidation, but it should be realized that such a study set-up obviously does not take into account an increased FA flux from peripheral tissues toward hepatocytes. A single in vivo study in mice, which were deficient for the LDL receptor (LDLr) and fed a high fat diet, showed that fenofibrate reduced VLDL-TG production (46). It is likely that the absence of the LDLr may have prevented the efficient hepatic uptake of VLDL remnants in that study. We observed that fenofibrate increased both the plasma clearance and liver uptake of VLDL core remnants. Furthermore, fenofibrate decreased the hepatic cholesterol content (which was also observed in the LDLr-deficient mice (46)) and resulted in an expected increase in hepatic LDLr expression in our study. It is thus conceivable that the LDLr plays an important role in the influx of remnant-TG upon treatment with fenofibrate. In addition, an alternative uptake route of VLDL remnants, in case of LDLr deficiency, may result in a different intracellular distribution of remnant-derived TG that is a less accessible source for VLDL-TG production.
Interestingly, during the review process of this work, a report was published investigating the effects of fenofibrate on VLDL-TG and VLDL-apoB metabolism in obese patients with nonalcoholic fatty liver disease (48). In agreement with our observations in mice, the TG-lowering effect of fenofibrate in humans could be fully explained by increased VLDL-TG clearance. Fenofibrate did not increase VLDL-TG production, which may be related to the steatotic state of the liver, already providing maximum substrate availability for VLDL-TG production. However, fenofibrate increased the molar ratio of VLDL-TG to VLDL-apoB secretion rates, suggesting the production of TG-rich nascent VLDL particles, consistent with our present observations in mice.
In conclusion, our data demonstrate that fenofibrate decreases plasma TG by enhancing LPL-mediated VLDL-TG clearance. As a consequence, fenofibrate increases VLDL-TG production by the liver as caused by 1) enhanced hepatic FA/TG uptake resulting from strongly accelerated peripheral LPL-mediated VLDL-TG hydrolysis, and 2) increased incorporation of TG from a separate pool in the liver resulting from de novo FA/TG synthesis and/or lipoprotein uptake. Because the primary mechanism of action underlying the lipid-lowering effect of fibrates (i.e. increased LPL-mediated VLDL-TG clearance) is different as compared with that of statins (i.e. decreased hepatic VLDL-TG and VLDL-C output), future studies addressing the combined action of these two drug classes on lipid metabolism and their combined effect on atherosclerosis development are thus warranted.
Supplementary Material
Acknowledgments
We thank Marian Bekkers, Simone van der Drift-Droog, and Karin Toet for excellent technical assistance.
This work was supported by the Leiden Center for Cardiovascular Research LUMC-TNO and supported by grants from the Nutrigenomics Consortium/Top Institute Food and Nutrition (TiFN), the Center for Medical Systems Biology (CMSB), and the Netherlands Consortium for Systems Biology (NCSB), within the framework of the Netherlands Genomics Initiative (NGI/NWO), the Netherlands Organization for Health Care Research Medical Sciences (ZON-MW Project nr. 948 000 04), and the Netherlands Organization for Scientific Research (NWO VIDI Grant 917.36.351, to P. C. N. R.).

The on-line version of this article (available at http://www.jbc.org) contains supplemental Figs. S1–S3.
- TG
- triglyceride(s)
- apo
- apolipoprotein
- CETP
- cholesteryl ester transfer protein
- CO
- cholesteryl oleate
- E3L
- APOE*3-Leiden
- FA
- fatty acid
- HDL
- high density lipoprotein
- LDLr
- low density lipoprotein receptor
- LPL
- lipoprotein lipase
- PPAR
- peroxisome proliferator-activated receptor
- TO
- triolein
- VLDL
- very low density lipoprotein.
REFERENCES
- 1.Boden W. E. (2000) Am. J. Cardiol. 86, 19L–22L [DOI] [PubMed] [Google Scholar]
- 2.Nordestgaard B. G., Benn M., Schnohr P., Tybjaerg-Hansen A. (2007) JAMA 298, 299–308 [DOI] [PubMed] [Google Scholar]
- 3.Chapman M. J. (2003) Atherosclerosis 171, 1–13 [DOI] [PubMed] [Google Scholar]
- 4.Schoonjans K., Staels B., Auwerx J. (1996) Biochim. Biophys. Acta. 1302, 93–109 [DOI] [PubMed] [Google Scholar]
- 5.Staels B., Dallongeville J., Auwerx J., Schoonjans K., Leitersdorf E., Fruchart J. C. (1998) Circulation 98, 2088–2093 [DOI] [PubMed] [Google Scholar]
- 6.Schoonjans K., Peinado-Onsurbe J., Lefebvre A. M., Heyman R. A., Briggs M., Deeb S., Staels B., Auwerx J. (1996) EMBO J. 15, 5336–5348 [PMC free article] [PubMed] [Google Scholar]
- 7.Staels B., Vu-Dac N., Kosykh V. A., Saladin R., Fruchart J. C., Dallongeville J., Auwerx J. (1995) J. Clin. Invest. 95, 705–712 [DOI] [PMC free article] [PubMed] [Google Scholar]
- 8.Watts G. F., Ji J., Chan D. C., Ooi E. M., Johnson A. G., Rye K. A., Barrett P. H. (2006) Clin. Sci. 111, 193–199 [DOI] [PubMed] [Google Scholar]
- 9.Hogue J. C., Lamarche B., Deshaies Y., Tremblay A. J., Bergeron J., Gagné C., Couture P. (2008) Metabolism 57, 246–254 [DOI] [PubMed] [Google Scholar]
- 10.Lindén D., Alsterholm M., Wennbo H., Oscarsson J. (2001) J. Lipid Res. 42, 1831–1840 [PubMed] [Google Scholar]
- 11.Tordjman K., Bernal-Mizrachi C., Zemany L., Weng S., Feng C., Zhang F., Leone T. C., Coleman T., Kelly D. P., Semenkovich C. F. (2001) J. Clin. Invest. 107, 1025–1034 [DOI] [PMC free article] [PubMed] [Google Scholar]
- 12.Kersten S. (2008) PPAR Res. (2008) 132960 [DOI] [PMC free article] [PubMed] [Google Scholar]
- 13.Hahn S. E., Goldberg D. M. (1992) Biochem. Pharmacol. 43, 625–633 [DOI] [PubMed] [Google Scholar]
- 14.Lamb R. G., Koch J. C., Bush S. R. (1993) Biochim. Biophys. Acta. 1165, 299–305 [DOI] [PubMed] [Google Scholar]
- 15.van den Maagdenberg A. M., Hofker M. H., Krimpenfort P. J., de Bruijn I., van Vlijmen B., van der Boom H., Havekes L. M., Frants R. R. (1993) J. Biol. Chem. 268, 10540–10545 [PubMed] [Google Scholar]
- 16.Westerterp M., van der Hoogt C. C., de Haan W., Offerman E. H., Dallinga-Thie G. M., Jukema J. W., Havekes L. M., Rensen P. C. (2006) Arterioscler. Thromb. Vasc. Biol. 26, 2552–2559 [DOI] [PubMed] [Google Scholar]
- 17.Jiang X. C., Agellon L. B., Walsh A., Breslow J. L., Tall A. (1992) J. Clin. Invest. 90, 1290–1295 [DOI] [PMC free article] [PubMed] [Google Scholar]
- 18.van der Hoogt C. C., de Haan W., Westerterp M., Hoekstra M., Dallinga-Thie G. M., Romijn J. A., Princen H. M., Jukema J. W., Havekes L. M., Rensen P. C. (2007) J. Lipid Res. 48, 1763–1771 [DOI] [PubMed] [Google Scholar]
- 19.Berbée J. F., van der Hoogt C. C., Sundararaman D., Havekes L. M., Rensen P. C. (2005) J. Lipid Res. 46, 297–306 [DOI] [PubMed] [Google Scholar]
- 20.Rensen P. C., Herijgers N., Netscher M. H., Meskers S. C., van Eck M., van Berkel T. J. (1997) J. Lipid Res. 38, 1070–1084 [PubMed] [Google Scholar]
- 21.Zechner R. (1990) Biochim. Biophys. Acta. 1044, 20–25 [DOI] [PubMed] [Google Scholar]
- 22.Aalto-Setälä K., Fisher E. A., Chen X., Chajek-Shaul T., Hayek T., Zechner R., Walsh A., Ramakrishnan R., Ginsberg H. N., Breslow J. L. (1992) J. Clin. Invest. 90, 1889–1900 [DOI] [PMC free article] [PubMed] [Google Scholar]
- 23.Egusa G., Brady D. W., Grundy S. M., Howard B. V. (1983) J. Lipid Res. 24, 1261–1267 [PubMed] [Google Scholar]
- 24.Li X., Catalina F., Grundy S. M., Patel S. (1996) J. Lipid Res. 37, 210–220 [PubMed] [Google Scholar]
- 25.Pietzsch J., Subat S., Nitzsche S., Leonhardt W., Schentke K. U., Hanefeld M. (1995) Biochim. Biophys. Acta. 1254, 77–88 [DOI] [PubMed] [Google Scholar]
- 26.Bligh E. G., Dyer W. J. (1959) Can J. Biochem. Physiol. 37, 911–917 [DOI] [PubMed] [Google Scholar]
- 27.de Groot P. J., Reiff C., Mayer C., Müller M. (2008) Genes Nutr. 3, 143–146 [DOI] [PMC free article] [PubMed] [Google Scholar]
- 28.Storey J. D., Tibshirani R. (2003) Proc. Natl. Acad. Sci. U.S.A. 100, 9440–9445 [DOI] [PMC free article] [PubMed] [Google Scholar]
- 29.Boorsma A., Foat B. C., Vis D., Klis F., Bussemaker H. J. (2005) Nucleic Acids Res. 33, W592–W595 [DOI] [PMC free article] [PubMed] [Google Scholar]
- 30.Reich M., Liefeld T., Gould J., Lerner J., Tamayo P., Mesirov J. P. (2006) Nat. Genet. 38, 500–501 [DOI] [PubMed] [Google Scholar]
- 31.Adiels M., Taskinen M. R., Packard C., Caslake M. J., Soro-Paavonen A., Westerbacka J., Vehkavaara S., Häkkinen A., Olofsson S. O., Yki-Järvinen H., Borén J. (2006) Diabetologia. 49, 755–765 [DOI] [PubMed] [Google Scholar]
- 32.Fisher E. A., Ginsberg H. N. (2002) J. Biol. Chem. 277, 17377–17380 [DOI] [PubMed] [Google Scholar]
- 33.de Haan W., van der Hoogt C. C., Westerterp M., Hoekstra M., Dallinga-Thie G. M., Princen H. M., Romijn J. A., Jukema J. W., Havekes L. M., Rensen P. C. (2008) Atherosclerosis 197, 57–63 [DOI] [PubMed] [Google Scholar]
- 34.van der Hoorn J. W., de Haan W., Berbée J. F., Havekes L. M., Jukema J. W., Rensen P. C., Princen H. M. (2008) Arterioscler. Thromb. Vasc. Biol. 28, 2016–2022 [DOI] [PubMed] [Google Scholar]
- 35.Guérin M., Bruckert E., Dolphin P. J., Turpin G., Chapman M. J. (1996) Arterioscler. Thromb. Vasc. Biol. 16, 763–772 [DOI] [PubMed] [Google Scholar]
- 36.Heller F., Harvengt C. (1983) Eur. J. Clin. Pharmacol. 25, 57–63 [DOI] [PubMed] [Google Scholar]
- 37.Malmendier C. L., Lontie J. F., Delcroix C., Dubois D. Y., Magot T., De Roy L. (1989) Atherosclerosis. 77, 139–149 [DOI] [PubMed] [Google Scholar]
- 38.Gulick T., Cresci S., Caira T., Moore D. D., Kelly D. P. (1994) Proc. Natl. Acad. Sci. U.S.A. 91, 11012–11016 [DOI] [PMC free article] [PubMed] [Google Scholar]
- 39.Aoyama T., Peters J. M., Iritani N., Nakajima T., Furihata K., Hashimoto T., Gonzalez F. J. (1998) J. Biol. Chem. 273, 5678–5684 [DOI] [PubMed] [Google Scholar]
- 40.Shiri-Sverdlov R., Wouters K., van Gorp P. J., Gijbels M. J., Noel B., Buffat L., Staels B., Maeda N., van Bilsen M., Hofker M. H. (2006) J. Hepatol. 44, 732–741 [DOI] [PubMed] [Google Scholar]
- 41.Duval C., Müller M., Kersten S. (2007) Biochim. Biophys. Acta. 1771, 961–971 [DOI] [PubMed] [Google Scholar]
- 42.Améen C., Edvardsson U., Ljungberg A., Asp L., Akerblad P., Tuneld A., Olofsson S. O., Lindén D., Oscarsson J. (2005) J. Biol. Chem. 280, 1224–1229 [DOI] [PubMed] [Google Scholar]
- 43.Teusink B., Voshol P. J., Dahlmans V. E., Rensen P. C., Pijl H., Romijn J. A., Havekes L. M. (2003) Diabetes 52, 614–620 [DOI] [PubMed] [Google Scholar]
- 44.Watts G. F., Barrett P. H., Ji J., Serone A. P., Chan D. C., Croft K. D., Loehrer F., Johnson A. G. (2003) Diabetes 52, 803–811 [DOI] [PubMed] [Google Scholar]
- 45.Duivenvoorden I., Teusink B., Rensen P. C., Kuipers F., Romijn J. A., Havekes L. M., Voshol P. J. (2005) J. Lipid Res. 46, 988–993 [DOI] [PubMed] [Google Scholar]
- 46.Srivastava R. A., Jahagirdar R., Azhar S., Sharma S., Bisgaier C. L. (2006) Mol. Cell Biochem. 285, 35–50 [DOI] [PubMed] [Google Scholar]
- 47.Lindén D., Lindberg K., Oscarsson J., Claesson C., Asp L., Li L., Gustafsson M., Borén J., Olofsson S. O. (2002) J. Biol. Chem. 277, 23044–23053 [DOI] [PubMed] [Google Scholar]
- 48.Fabbrini E., Mohammed B. S., Korenblat K. M., Magkos F., McCrea J., Patterson B. W., Klein S. (2010) J. Clin. Endocrin. Metab. 95, 2727–2735 [DOI] [PMC free article] [PubMed] [Google Scholar]
Associated Data
This section collects any data citations, data availability statements, or supplementary materials included in this article.