

Abstract
The high incidence of cancer and its aggressive progression is a common and major problem in patients receiving immunosuppressive therapy. The calcineurin inhibitors (CNIs) may have protumorigenic effects and can promote the overexpression of several molecules inducing tumor growth. We have recently demonstrated that CNIs can mediate the transcriptional activation of the angiogenic cytokine vascular endothelial growth factor (VEGF) and promote a rapid progression of human renal cancer. Here, we investigated whether the CNI cyclosporine (CsA) and the mTOR inhibitor rapamycin (RAPA) could alter the mRNA stability of VEGF in 786-0 and Caki-1 renal cancer cells. Following actinomycin D treatment, we observed that CsA increased, whereas RAPA decreased the VEGF mRNA stability as observed by real time PCR. It is established that the mRNA-binding protein HuR may play a critical role in VEGF mRNA stability. By using HuR-siRNA, we found that the knockdown of HuR significantly decreased the CNI-induced VEGF mRNA stability. By Western blot analysis, it has been observed that CNI treatment induced the translocation of HuR from the nucleus to the cytoplasm; CNIs also induced the association between HuR and PKC-δ and promoted the phosphorylation of HuR. Finally, we found that the inhibition of PKC-δ using a dominant negative plasmid significantly decreased the CsA-induced cytoplasmic translocation of HuR and VEGF mRNA stability. Together, targeting the pathways that promote CNI-induced transcription as well as the mRNA stability of VEGF might serve as novel therapeutics for the prevention and treatment of cancer in immunosuppressed patients.
Keywords: Calcineurin, Cancer Tumor Promoter, Cytokine, Immunosuppressor, mTOR, Calcineurin Inhibitor
Introduction
The development of cancer is a critical problem in patients treated with immunosuppressive agents (1–3). The reasons for the high incidence of cancer in these individuals, including patients with organ transplant, are unknown, but have been postulated to include impaired immune surveillance, viral infections, or the direct effects of immunosuppressive agents (2, 4, 5). Nevertheless, some clues to the mechanisms underlying the development of posttransplantation cancer have recently emerged from clinical findings, including the observation that transplant patients receiving the mTOR2 inhibitor rapamycin (RAPA) do not develop cancer at the same rate as those receiving other immunosuppressive agents such as calcineurin inhibitors (CNIs) (5–9).
Vascular endothelial growth factor (VEGF) is a 34–45-kDa cytokine expressed by tumor cells, endothelial cells, leukocytes, and different other cell types (10–12). It plays a major role in regulating the process of angiogenesis for the growth and progression of tumors (10). We have recently reported that CNIs may promote the overexpression of VEGF in human renal cancer, one of the major cancers in transplant patients (13). We have observed that CNI-induced VEGF overexpression is mediated through the transcriptional activation mechanism and can lead to a rapid progression of renal tumors (13).
The regulation of VEGF expression in tumor cells is complex, involving both transcriptional and posttranscriptional processes (14, 15). An important mechanism of posttranscriptional gene regulation involves a rapid degradation of messenger RNAs (mRNAs) signaled by AU-rich elements in their 3′-untranslated regions (14, 16). However, stabilization of the RNA transcripts of different genes, including VEGF, may play a critical role in tumor growth and progression. HuR, a ubiquitously expressed member of the embryonic lethal abnormal vision family of RNA-binding proteins, can play an important role in regulating VEGF mRNA stability through its binding to the AU-rich elements in the 3′-untranslated regions (16, 17). Although predominantly nuclear, HuR shuttles between the nucleus and the cytoplasm via a novel shuttling sequence, located in the hinge region between its second and third RNA recognition motifs (18, 19). The ability of HuR to shuttle has led to the suggestion that HuR may initially bind mRNAs in the nucleus and accompany them into the cytoplasm, providing an ongoing protection from the degradation machinery.
In the present study, we show that the CNI-induced protumorigenic effects as observed in our previous findings may involve increased VEGF mRNA stability through HuR. In contrast, the mTOR inhibitor RAPA may decrease the stability of VEGF mRNA in renal cancer cells and may thus promote an antitumorigenic effect.
EXPERIMENTAL PROCEDURES
Reagents
CsA (Novartis) was purchased from the Children's Hospital Boston pharmacy, and RAPA was purchased from LC laboratories. Actinomycin D was obtained from Sigma-Aldrich. The gene-specific siRNAs for HuR along with its control were purchased from Qiagen. The kinase-inactive (dominant negative, DN) PKC-δ plasmid (PKC-δ KR) was a generous gift from R. Dutta (Dana-Farber Cancer Institute, Boston, MA) (20).
Antibodies
The antibodies against HuR, PKC-δ, phosphoserine, and Sp1 were purchased from Santa Cruz Biotechnology. The antibodies against GAPDH and β-actin were obtained from Sigma-Aldrich. The control normal rabbit IgG was purchased from Santa Cruz Biotechnology.
Cell Culture
The human renal cancer cell lines (786-0 and Caki-1) were obtained from the American Type Culture Collection. The cells were grown in RPMI 1640 medium supplemented with 10% fetal bovine serum (Hyclone Laboratories).
VEGF mRNA Stability Experiments
Subconfluent cells were first preincubated with 5.0 μg/ml actinomycin D for 1 h; cells were then treated with immunosuppressive agents for different time intervals (0–6 h) in the presence of actinomycin D. Total RNA was prepared using the RNeasy isolation kit (Qiagen), and cDNA was synthesized using cloned avian myeloblastosis virus first-strand synthesis kit (Invitrogen). To analyze VEGF expression, real-time PCR was performed using the Assays-on-Demand Gene Expression product (TaqMan, Mammalian Gene Collection probes) according to the manufacturer's instructions (Applied Biosystems). As an internal control, GAPDH mRNA was amplified. Gene-specific primers were obtained from Applied Biosystems. Ct value (the cycle number at which emitted fluorescence exceeded an automatically determined threshold) for gene of interest (VEGF) was corrected by the Ct value for GAPDH and expressed as ΔCt. The fold change in mRNA amount was calculated as described before (13). The data were represented as percentage decrease in mRNA levels using a semilogarithmic scale.
Preparation of Cytoplasmic and Nuclear Extracts
Cytoplasmic and nuclear extracts were prepared using a nuclear extract kit (Active Motif). The purities of cytoplasmic and nuclear fractions were confirmed by checking the expression of a cytoplasmic protein GAPDH and a nuclear protein Sp1.
Immunoprecipitation Assays
Immunoprecipitations were performed with 0.5 mg of total protein at antibody excess. Immunocomplexes were captured with protein A-Sepharose beads (GE Healthcare), and bead-bound proteins were subjected to Western blot analysis using specific antibody.
Western Blot Analysis
Protein samples were run on SDS-polyacrylamide gel and transferred to a polyvinylidene difluoride membrane (Millipore Corporation). The membrane was probed with specific primary antibody and subsequently incubated with peroxidase-linked secondary antibody. The reactive band was detected by chemiluminescent substrate (Pierce).
Statistical Analyses
For mRNA stability experiments, changes in VEGF expression over the 6-h time period were compared between treatments using a repeated-measures mixed model regression analysis with the F test used to evaluate overall slope differences and t tests for multiple pairwise comparisons (21). The first-order autoregressive correlation structure was chosen to minimize the Akaike information criterion and provide the best fit to the measurements of VEGF mRNA expression over the time course. Data analysis was performed using SPSS version 16.0 (SPSS Inc./IBM, Chicago, IL). Two-tailed p values < 0.05 were considered statistically significant.
For other experiments, statistical evaluation for data analysis was determined by Student's t test. Differences with p values < 0.05 were considered statistically significant.
RESULTS
Cyclosporine Increases, whereas Rapamycin Decreases VEGF mRNA Stability in Renal Cancer Cells
In our recent study (13), we have demonstrated that the CNI CsA can promote a rapid progression of human renal cancer through the transcriptional activation of the angiogenic cytokine VEGF. Here, we tried to determine whether CsA could also regulate the mRNA stability of VEGF in renal cancer cells. To this end, 786-0 and Caki-1 cells were incubated with actinomycin D (to block de novo mRNA synthesis) and then treated with either CsA or the vehicle alone for different time points; VEGF mRNA levels were measured by real-time PCR. As shown in Fig. 1, the rate of VEGF mRNA degradation was much slower in the CsA-treated group compared with vehicle-treated controls; the VEGF mRNA half-life for the CsA-treated group was ∼6 h, whereas that of the control group was ∼4 h. This observation suggests that the CsA treatment may increase VEGF mRNA stability in renal cancer cells. We also examined whether CsA treatment could increase the mRNA stability of transforming growth factor-β and basic fibroblast growth factor, two other cytokines also known to regulate angiogenesis. However, we could not detect any significant change (data not shown) in the mRNA stability of these two cytokines following CsA treatment in renal cancer cells.
FIGURE 1.

CsA treatment increases VEGF mRNA stability. 786-0 (A) and Caki-1 (B) cells were preincubated with actinomycin D (5.0 μg/ml) and then treated with different combinations of CsA (5.0 μg/ml) and RAPA (10.0 ng/ml) or the vehicle alone (Control) for different time intervals (0–6 h). The cells were harvested at designated time points, and total RNA was isolated and reverse transcribed. The fold change in VEGF mRNA expression was measured by real-time PCR as described under “Experimental Procedures” and is represented as percentage decrease in mRNA levels using a semilogarithmic scale. The mRNA level at zero time point (before the treatment with immunosuppressive agents) was considered as 100%. Results are representative of three independent experiments from triplicate readings of the samples. Points, average value of VEGF mRNA expression; error bars, S.D. In 786-0 cells (A), ANOVA indicated a significant change in percent VEGF mRNA expression during the 6-h period with highly significant overall slope differences between treatment groups (F test = 215.8, p < 0.0001). There was a significantly slower rate of decline for CsA-treated group versus control (t = 2.63, p = 0.014), whereas the rate of change was faster for CsA + RAPA-treated group compared with CsA alone (t = 7.69, p < 0.001). RAPA alone showed a faster rate of decline in mRNA expression than the control group (t = 4.52, p < 0.0001). In Caki-1 cells (B), ANOVA indicated a significant change in percent VEGF mRNA expression during the 6-h period with highly significant overall slope differences between the treatment groups (F = 938.8, p < 0.0001). Specifically, CsA treatment alone showed a slower rate of decline compared with control (t = 10.77, p < 0.0001); RAPA treatment had a significantly faster rate of decline compared with control (t = 2.48, p = 0.022) and CsA-treated group (t = 13.25, p < 0.0001).
We next studied the effect of the mTOR inhibitor RAPA on VEGF mRNA stability in renal cancer cells. In contrast to our findings with CsA treatment, we observed that RAPA decreased the stability of VEGF mRNA in both 786-0 and Caki-1 cells compared with vehicle-treated controls (Fig. 1); the VEGF mRNA half-life for the RAPA-treated group was ∼3 h, whereas that of the control group was ∼4 h. In addition, the combination treatment with CsA and RAPA significantly decreased CsA-induced VEGF mRNA stability (Fig. 1A). Together, these observations suggest that the protumorigenic effect of CsA might involve the increased mRNA stability of the angiogenic cytokine VEGF. On the other hand, the antiangiogenic effect of RAPA might involve decreased VEGF mRNA stability.
HuR May Play an Important Role in CsA-induced VEGF mRNA Stability
As discussed earlier, HuR may play a significant role in VEGF mRNA stability (16, 17). Here, we sought to determine whether CsA-induced VEGF mRNA stability involves HuR. We first transfected 786-0 cells with either HuR-specific siRNA or control siRNA. The siRNA-transfected cells were then incubated with actinomycin D, treated with either CsA or vehicle alone for different time points, and then VEGF mRNA levels were measured by real-time PCR. As shown in Fig. 2A, in control siRNA-transfected cells, CsA treatment significantly increased VEGF mRNA stability (half-life ∼6 h) compared with vehicle-treated controls (half-life ∼4 h); however, transfection of the cells with HuR siRNA significantly decreased CsA-induced VEGF mRNA stability (half-life ∼2 h). The knockdown (∼70%) of HuR following siRNA transfection was confirmed by Western blot analysis (Fig. 2B). This finding suggests that HuR may play a critical role in CsA-induced VEGF mRNA stability in renal cancer cells.
FIGURE 2.

HuR plays a critical role in CsA-induced VEGF mRNA stability. A, 786-0 cells were transfected with either HuR siRNA (25 nmol/liter) or control siRNA for 72 h. The cells were then preincubated with actinomycin D (5.0 μg/ml) and treated with CsA (5.0 μg/ml) or the vehicle alone for different time intervals (0–6 h). The cells were harvested at designated time points, and total RNA was isolated and reverse transcribed. The fold change in VEGF mRNA expression was measured by real-time PCR as described under “Experimental Procedures” and is represented as percentage decrease in mRNA levels using a semilogarithmic scale. The mRNA level at zero time point (before CsA treatment) was considered as 100%. Results are representative of three independent experiments from triplicate readings of the samples. Points, average value of VEGF mRNA expression; error bars, S.D. ANOVA indicated a significant change in percent VEGF mRNA expression during the 6-h period with highly significant slope differences between the treatment groups (F = 197.1, p < 0.0001). Control siRNA + CsA group showed a slower rate of decline compared with control siRNA group (t = 2.51, p = 0.019). HuR siRNA alone showed a faster rate of decline in mRNA compared with control siRNA group (t = 5.11, p < 0.0001). Slopes for mRNA expression were significantly more rapid in HuR siRNA (t = 7.61, p < 0.0001) and HuR siRNA + CsA group (t = 8.88, p < 0.0001) compared with control siRNA + CsA group. B, knockdown of HuR (36 kDa) in 786-0 cells was confirmed by Western blot analysis after 72 h of siRNA transfection. The lanes were grouped from different parts of the same gel and same blot. Results are representative of two different experiments.
Cyclosporine Treatment Does Not Alter the Expression Level of HuR
We tried to examine whether CsA treatment can alter the mRNA and protein expression of HuR in renal cancer cells. The 786-0 cells were treated with CsA for different time intervals. Vehicle-treated cells served as controls. Following treatment, HuR mRNA and protein expression were measured by real-time PCR and Western blot analysis, respectively. As shown in Fig. 3, there was no significant change in the expression of HuR mRNA and protein following CsA treatment compared with controls. Thus, although CsA-induced VEGF mRNA stability is dependent on HuR, CsA treatment does not alter the expression level of this RNA-binding protein.
FIGURE 3.

CsA treatment does not alter the mRNA and protein expression of HuR. A, 786-0 cells were treated with CsA (5.0 μg/ml) for different time intervals (3.0 and 6.0 h). The vehicle-treated cells served as control. The fold change in HuR mRNA expression was measured by real-time PCR (as described within mRNA stability experiments under “Experimental Procedures”) using HuR-specific primers. Results are representative of three independent experiments from triplicate readings of the samples. Columns, average value of HuR mRNA expression; error bars, S.D. B, 786-0 cells were treated with CsA (5.0 μg/ml) for different time intervals (12 and 24 h). The vehicle-treated cells served as control. Cells were lysed and Western blotting (Blot) was performed using either anti-HuR (upper panel) or anti-β-actin (lower panel) to quantitate the expression of HuR (36 kDa) and β-actin (42 kDa), respectively. Results are representative of three independent experiments.
Cyclosporine Treatment Promotes the Shuttling of HuR from the Nucleus to the Cytoplasm
It has been reported that the stimulus-induced stabilization of many AU-rich element-containing mRNAs by HuR is attributable to an increased shuttling of HuR from the nucleus to the cytoplasm, which in turn is controlled by different signaling molecules/pathways, including PKC (22). Here, we tested whether the treatment of human renal cancer cells with CsA could promote any changes in the subcellular localization of endogenous HuR. We treated the 786-0 and Caki-1 cells with CsA for different time points. Vehicle-treated cells served as controls. Following treatment, the cytoplasmic and the nuclear fractions were isolated from the cells, and the expression of HuR was measured by Western blot analysis. As shown in Fig. 4, CsA treatment indeed increased the expression level of cytoplasmic HuR in both the cell types compared with controls. As expected, there was also a decrease in the expression level of nuclear HuR following CsA treatment (supplemental Fig. 1). This result suggests that CsA treatment can promote the translocation of HuR from the nucleus to the cytoplasm of renal cancer cells.
FIGURE 4.

CsA treatment induces the cytoplasmic translocation of HuR. 786-0 (A) and Caki-1 (B) cells were treated with CsA (5.0 μg/ml) for different time intervals (1–3 h). The vehicle-treated cells served as control. Cytoplasmic extracts were prepared from these cells, and Western blotting (Blot) was performed using either anti-HuR (top panels) or anti-β-actin (second panels) to quantitate the expression of HuR (36 kDa) and β-actin (42 kDa), respectively. The purities of cytoplasmic extracts were determined through Western blotting using anti-GAPDH (third panels) and anti-Sp1 (bottom panels) to quantitate the expression of GAPDH (36 kDa) (positive control) and Sp1 (106 kDa) (negative control), respectively. Results are representative of three independent experiments. The bar graphs beside the Western blots illustrate the relative expression of HuR by densitometry, where the signals were standardized to the expression of the internal control β-actin. Columns, average of the relative intensity of HuR expression from three different blots; error bars, S.D. *, p < 0.01 compared with control.
Cyclosporine Promotes the Association between HuR and PKC-δ and Induces the Phosphorylation of HuR
In our previous report (13), we have demonstrated that the CsA treatment can induce the phosphorylation of PKC-δ. It has also been shown that the increased nucleocytoplasmic shuttling of HuR is dependent on PKC-δ (22). As we observed that CsA promotes the shuttling of HuR from the nucleus to the cytoplasm, we next examined whether CsA treatment could induce the association between HuR and PKC-δ. Through immunoprecipitation using anti-PKC-δ, and Western blot analysis with ant-HuR, we observed that the CsA treatment markedly increased the association between HuR and PKC-δ in 786-0 cells compared with controls (Fig. 5A, upper left and right panels); we confirmed that HuR was not co-immunoprecipitated when we performed the immunoprecipitation with a control IgG (negative control) (Fig. 5A, bottom panel). We also had a similar observation (data not shown) in Caki-1 cells. In contrast, there was either no significant change or some decrease in the basal association between HuR and PKC-δ following treatment of the renal cancer cells with RAPA (Fig. 5B).
FIGURE 5.

CsA treatment promotes the association of HuR with PKC-δ. 786-0 cells were treated with CsA (5.0 μg/ml) (A) and RAPA (10.0 ng/ml) (B) for different time intervals (1–3 h). The vehicle-treated cells served as control. The cells were lysed, and the extracts were immunoprecipitated with anti-PKC-δ. Immunoprecipitates (IP) were captured by protein A-Sepharose beads, boiled in SDS buffer, and separated by SDS-PAGE. Western blotting (Blot) was performed using either anti-HuR or anti-PKC-δ to quantitate the expression of HuR (36 kDa) and PKC-δ (78 kDa), respectively. For negative controls, the extracts from vehicle- and CsA-treated cells were immunoprecipitated with a control IgG, and Western blotting was performed using anti-HuR as described above. Results are representative of three independent experiments. The bar graph beside the Western blot (in A) illustrates the quantification of the expression of PKC-δ-bound HuR by densitometry, where the signals were standardized to the expression of PKC-δ in immunoprecipitates. Columns, average of the relative intensity of HuR expression from three different blots; error bars, S.D. *, p < 0.05 compared with control.
Next, we tested whether the CsA treatment could lead to the phosphorylation of HuR. To this end, we treated the 786-0 cells with CsA, and the cell lysates were subjected to immunoprecipitation using an anti-HuR antibody, and subsequently Western blot analysis was performed with antibody against phosphoserine. As shown in Fig. 6, CsA treatment indeed increased the phosphorylation of HuR compared with controls. Together, these findings suggest that the CsA treatment induces the association between HuR and PKC-δ, which may probably lead to the phosphorylation of HuR.
FIGURE 6.
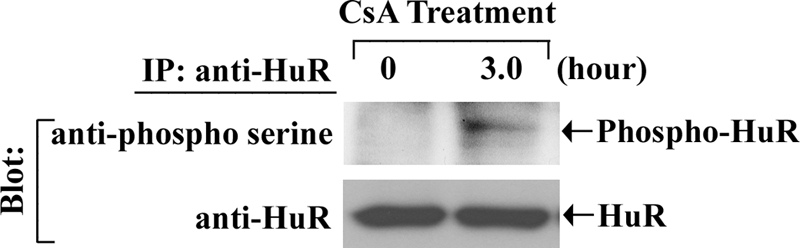
CsA treatment induces the phosphorylation of HuR. 786-0 cells were treated with CsA (5.0 μg/ml) for 3 h. The vehicle-treated cells served as control. The cells were lysed, and the extracts were immunoprecipitated with anti-HuR. Immunoprecipitates (IP) were captured by protein A-Sepharose beads, boiled in SDS buffer, and separated by SDS-PAGE. Western blotting (Blot) was performed with either anti-phosphoserine (upper panel) or anti-HuR (lower panel). Results are representative of three independent experiments.
Cyclosporine Treatment Promotes the Cytoplasmic Translocation of HuR through PKC-δ
Here, we tried to dissect whether CsA-mediated cytoplasmic translocation of HuR involves PKC-δ. The 786-0 cells were first transfected with either a specific DN plasmid of PKC-δ or the empty expression vector; the cells were then treated with CsA for different time intervals. Vehicle-treated cells served as controls. Following treatment, the cytoplasmic fractions were isolated, and the expression of HuR was measured by Western blot analysis. In empty vector-transfected cells, CsA treatment markedly increased the expression level of cytoplasmic HuR compared with controls (Fig. 7, upper left panel); there was also a decrease in the expression level of nuclear HuR in these cells following CsA treatment (data not shown). In contrast, in PKC-δ DN-transfected cells, CsA treatment could not promote any significant change in the expression level of cytoplasmic HuR compared with controls (Fig. 7, lower left panel). These observations suggest that PKC-δ may play an important role in CsA-induced cytoplasmic translocation of HuR.
FIGURE 7.

CsA-induced cytoplasmic translocation of HuR is mediated through PKC-δ. 786-0 cells were transfected with either a specific dominant negative plasmid of PKC-δ (PKC-δ DN) or the empty expression vector for 20 h. Both groups of cells were then treated with CsA (5.0 μg/ml) for different time intervals (1–3 h). The vehicle-treated cells served as control. Cytoplasmic extracts were prepared from these cells, and Western blotting (Blot) was performed using either anti-HuR (top panels) or anti-β-actin (second panels) to quantitate the expression of HuR (36 kDa) and β-actin (42 kDa), respectively. The purities of cytoplasmic extracts were determined through Western blotting using anti-GAPDH (third panels) and anti-Sp1 (bottom panels) to quantitate the expression of GAPDH (36 kDa) (positive control) and Sp1 (106 kDa) (negative control), respectively. Results are representative of three different experiments. The bar graph beside the Western blot illustrates the relative expression of HuR by densitometry, where the signals were standardized to the expression of the internal control β-actin. Columns, average of the relative intensity of HuR expression from three different blots; error bars, S.D. *, p < 0.01 compared with control.
Signaling through PKC-δ Is Critical for CsA-induced VEGF mRNA Stability
Our earlier experiments demonstrated that CsA-induced VEGF mRNA stability is dependent on HuR, and PKC-δ plays an important role in the cytoplasmic translocation of HuR. Here, we wished to examine the role of PKC-δ in CsA-induced VEGF mRNA stability. The 786-0 cells were transfected with either the specific DN plasmid of PKC-δ or the empty expression vector. The cells were then incubated with actinomycin D and treated with either CsA or the vehicle alone for different time points. As shown in Fig. 8, in empty vector-transfected cells, CsA treatment increased VEGF mRNA stability compared with vehicle-treated control, and the transfection with PKC-δ DN plasmid significantly decreased CsA-induced VEGF mRNA stability. These results suggest that PKC-δ-mediated signaling events may play an important role in CsA-induced VEGF mRNA stability.
FIGURE 8.

PKC-δ plays important role in CsA-induced VEGF mRNA stability. 786-0 cells were transfected with either PKC-δ DN or the empty expression vector for 20 h. The cells were then preincubated with actinomycin D (5.0 μg/ml) and treated with CsA (5.0 μg/ml) or the vehicle alone for different time intervals (0–6 h). The cells were harvested at designated time points, and total RNA was isolated and reverse transcribed. The fold change in VEGF mRNA expression was measured by real-time PCR as described under “Experimental Procedures” and is represented as percentage decrease in mRNA levels using a semilogarithmic scale. The mRNA level at zero time point (before CsA treatment) was considered as 100%. Results are representative of three independent experiments from triplicate readings of the samples. Points, average value of VEGF mRNA expression; error bars, S.D. ANOVA indicated a significant change in percent VEGF mRNA expression during the 6-h period with highly significant overall slope differences between the treatment groups (F = 189.9, p < 0.0001). Specifically, empty vector + CsA group showed a slower rate of decline compared with empty vector group (t = 3.25, p = 0.003). Compared with empty vector + CsA group, the slopes were significantly faster for PKC-δ DN (t = 5.92, p < 0.0001) and PKC-δ DN + CsA group (t = 6.55, p < 0.0001). In addition, the PKC-δ DN group showed a faster rate of decline in mRNA compared with the empty vector group (t = 2.67, p = 0.013).
DISCUSSION
It is now well established that the patients treated with various immunosuppressive agents often develop different types of cancer, including renal cancer. We have previously reported that the CNIs may play a critical role in the rapid progression of human renal cancer through the transcriptional activation of VEGF (13). In this study, we show that CNIs may also promote VEGF overexpression by increasing its mRNA stability through the mRNA-binding protein HuR; the PKC-δ may act as a critical intermediary signaling molecule in this process. In contrast, we find that the mTOR inhibitor RAPA can decrease VEGF mRNA stability.
The calcineurin complex consists of three subunits, the catalytic A, the regulatory B, and calmodulin (23). The cellular calcium activates the catalytic subunit for its function as serine/threonine phosphatase, resulting in the activation of the nuclear factor of activated T cells family of transcription factors (24, 25). The CNI CsA binds to cyclophylin, a cytoplasmic protein, and the resultant complex binds to the regulatory B subunit of calcineurin and prevents the activation of nuclear factor of activated T cells (26). However, apart from inhibiting nuclear factor of activated T cells, the CNIs may also regulate other signaling molecules involved in the expression of VEGF and other genes (13, 27–29). We have recently demonstrated that CNIs can activate the oncogenic Ras signaling pathway in renal cancer cells (30). We have also shown that CNIs can promote VEGF overexpression through the activation of PKC-ζ and PKC-δ (13). Chen et al. (31) have recently reported that CsA-induced oxidative stress can up-regulate and activate PKC-ζ in Epstein-Barr virus-infected human B cells; and CsA-induced PKC-ζ activation may act as an important signaling step in Epstein-Barr virus-induced lymphoproliferative disorders in transplant patients. In this study, we have shown that the PKC-δ pathway may play a significant role in CsA-induced VEGF mRNA stability in renal cancer cells.
The expression of VEGF is regulated by a tight control of both transcriptional and posttranscriptional mechanisms (14, 15). The posttranscriptional events are generally attributable to the 3′-untranslated region containing the AU-rich elements functionally involved in the regulation of mRNA decay (14, 16). Several transactivating RNA-binding factors recognize the AU-rich cis-elements. HuR is one of the most important RNA-binding proteins playing a critical role in VEGF mRNA stability (16, 17). Our observations show that the CNI-induced VEGF mRNA stability is mediated through HuR. The activation process of HuR within the cell is regulated by different factors, including PKC. In support to our findings, Doller et al. (22) have demonstrated that PKC-δ can activate HuR and promote angiotensin II-induced mRNA stability of cyclooxygenase-2. Our observations suggest that CsA treatment induces the binding of HuR with PKC-δ and to a lesser extent with PKC-ζ (data not shown) and promotes HuR phosphorylation. We found that CsA-induced and PKC-δ-mediated phosphorylation of HuR is associated with the nucleocytoplasmic shuttling of this mRNA-binding protein, as evident by an increase in the expression level of cytoplasmic HuR and a decrease in nuclear HuR. However, the detectable change for the decrease in nuclear HuR always varied in the range of ∼20–50%, possibly due to the predominant and abundant nuclear localization of this protein. We suggest that CsA-induced nucleocytoplasmic shuttling of HuR may finally lead to increased VEGF mRNA stability. These findings again indicate a direct tumorigenic effect of CsA, which is independent of its function as an immunosuppressive agent.
Interestingly, in contrast to CNIs, the mTOR inhibitor RAPA has been shown to have antitumorigenic effects. Guba et al. (7) have demonstrated that RAPA inhibits tumor angiogenesis by blocking VEGF production and VEGF-induced vascular endothelial cell stimulation. Koehl et al. (8) have reported that RAPA can protect allografts from rejection while simultaneously attacking tumors in immunosuppressed animals. Cho et al. (32) have reported that RAPA can antagonize CsA- and FK506-mediated augmentation of linker for activation of T cell expression; it has been suggested that as CsA, unlike FK506 and RAPA, does not bind to the intracellular immunophilin FK-binding protein, the antagonism between these drugs is not simply due to competition for intracellular FK-binding protein. Our results in this study suggest that RAPA can significantly inhibit VEGF mRNA stability even in the presence of CsA. It has been reported that the effective doses of RAPA for immunosuppression coincide with doses required for its antiangiogenic effects (6). This allows RAPA to be considered for the effective treatment of organ rejection, autoimmune diseases, and cancer. In addition, RAPA may also be used in a combination therapy with CsA and other CNIs to prevent tumor growth in immunosuppressed patients.
In summary, although the CNIs are widely used in patients for preventing allograft rejection and autoimmune diseases, they may have various adverse effects, including the development of cancer. Thus, the mechanism(s) of CNI-mediated cancer development should be thoroughly investigated. Our previous work and the present study clearly demonstrate that the CNI treatment may play a significant role in the rapid progression of human renal cancer through VEGF overexpression; CNIs can regulate the VEGF gene expression at both transcriptional and posttranscriptional levels. However, the relative contribution of transcription versus mRNA stability on CNI-induced VEGF overexpression still needs to be determined. Targeting these pathways or the intermediary signaling molecules may serve as novel therapeutics for the prevention of cancer in patients receiving CNIs as immunosuppressive therapy.
Supplementary Material
Acknowledgment
We thank Tobias Schatton for generous help in graphic plotting of some of our data.
This work was supported, in whole or in part, by National Institutes of Health Grant R01 CA131145 and John-Merrill Grant ASN-AST (to S. P.).

The on-line version of this article (available at http://www.jbc.org) contains supplemental Fig. 1.
- mTOR
- mammalian target of rapamycin
- ANOVA
- analysis of variance
- CNI
- calcineurin inhibitor
- CsA
- cyclosporine
- DN
- dominant negative
- RAPA
- rapamycin.
REFERENCES
- 1.Kasiske B. L., Snyder J. J., Gilbertson D. T., Wang C. (2004) Am. J. Transplant. 4, 905–913 [DOI] [PubMed] [Google Scholar]
- 2.Bustami R. T., Ojo A. O., Wolfe R. A., Merion R. M., Bennett W. M., McDiarmid S. V., Leichtman A. B., Held P. J., Port F. K. (2004) Am. J. Transplant. 4, 87–93 [DOI] [PubMed] [Google Scholar]
- 3.Wimmer C. D., Rentsch M., Crispin A., Illner W. D., Arbogast H., Graeb C., Jauch K. W., Guba M. (2007) Kidney Int. 71, 1271–1278 [DOI] [PubMed] [Google Scholar]
- 4.Jamil B., Nicholls K., Becker G. J., Walker R. G. (1999) Transplantation 68, 1597–1603 [DOI] [PubMed] [Google Scholar]
- 5.Hojo M., Morimoto T., Maluccio M., Asano T., Morimoto K., Lagman M., Shimbo T., Suthanthiran M. (1999) Nature 397, 530–534 [DOI] [PubMed] [Google Scholar]
- 6.Guba M., Graeb C., Jauch K. W., Geissler E. K. (2004) Transplantation 77, 1777–1782 [DOI] [PubMed] [Google Scholar]
- 7.Guba M., von Breitenbuch P., Steinbauer M., Koehl G., Flegel S., Hornung M., Bruns C. J., Zuelke C., Farkas S., Anthuber M., Jauch K. W., Geissler E. K. (2002) Nat. Med. 8, 128–135 [DOI] [PubMed] [Google Scholar]
- 8.Koehl G. E., Andrassy J., Guba M., Richter S., Kroemer A., Scherer M. N., Steinbauer M., Graeb C., Schlitt H. J., Jauch K. W., Geissler E. K. (2004) Transplantation 77, 1319–1326 [DOI] [PubMed] [Google Scholar]
- 9.Dantal J., Soulillou J. P. (2005) N. Engl. J. Med. 352, 1371–1373 [DOI] [PubMed] [Google Scholar]
- 10.Dvorak H. F., Brown L. F., Detmar M., Dvorak A. M. (1995) Am. J. Pathol. 146, 1029–1039 [PMC free article] [PubMed] [Google Scholar]
- 11.Folkman J. (1995) Nat. Med. 1, 27–31 [DOI] [PubMed] [Google Scholar]
- 12.Flaxenburg J. A., Melter M., Lapchak P. H., Briscoe D. M., Pal S. (2004) J. Immunol. 172, 7503–7509 [DOI] [PubMed] [Google Scholar]
- 13.Basu A., Contreras A. G., Datta D., Flynn E., Zeng L., Cohen H. T., Briscoe D. M., Pal S. (2008) Cancer Res. 68, 5689–5698 [DOI] [PMC free article] [PubMed] [Google Scholar]
- 14.Dibbens J. A., Miller D. L., Damert A., Risau W., Vadas M. A., Goodall G. J. (1999) Mol. Biol. Cell 10, 907–919 [DOI] [PMC free article] [PubMed] [Google Scholar]
- 15.Nabors L. B., Gillespie G. Y., Harkins L., King P. H. (2001) Cancer Res. 61, 2154–2161 [PubMed] [Google Scholar]
- 16.Brennan C. M., Steitz J. A. (2001) Cell Mol. Life Sci. 58, 266–277 [DOI] [PMC free article] [PubMed] [Google Scholar]
- 17.Levy N. S., Chung S., Furneaux H., Levy A. P. (1998) J. Biol. Chem. 273, 6417–6423 [DOI] [PubMed] [Google Scholar]
- 18.Fan X. C., Steitz J. A. (1998) EMBO J. 17, 3448–3460 [DOI] [PMC free article] [PubMed] [Google Scholar]
- 19.Fan X. C., Steitz J. A. (1998) Proc. Natl. Acad. Sci. U.S.A. 95, 15293–15298 [DOI] [PMC free article] [PubMed] [Google Scholar]
- 20.Pal S., Claffey K. P., Cohen H. T., Mukhopadhyay D. (1998) J. Biol. Chem. 273, 26277–26280 [DOI] [PubMed] [Google Scholar]
- 21.Vittinghoff E., Glidden D. V., Shiboski S. C., McCulloch C. E. (2005) Regression Methods in Biostatistics, pp. 253–289, Springer-Verlag New York Inc., New York [Google Scholar]
- 22.Doller A., Akool el-S., Huwiler A., Müller R., Radeke H. H., Pfeilschifter J., Eberhardt W. (2008) Mol. Cell. Biol. 28, 2608–2625 [DOI] [PMC free article] [PubMed] [Google Scholar]
- 23.Klee C. B., Crouch T. H., Krinks M. H. (1979) Proc. Natl. Acad. Sci. U.S.A. 76, 6270–6273 [DOI] [PMC free article] [PubMed] [Google Scholar]
- 24.Klee C. B., Ren H., Wang X. (1998) J. Biol. Chem. 273, 13367–13370 [DOI] [PubMed] [Google Scholar]
- 25.Graef I. A., Chen F., Chen L., Kuo A., Crabtree G. R. (2001) Cell 105, 863–875 [DOI] [PubMed] [Google Scholar]
- 26.Liu J., Farmer J. D., Jr., Lane W. S., Friedman J., Weissman I., Schreiber S. L. (1991) Cell 66, 807–815 [DOI] [PubMed] [Google Scholar]
- 27.Cho C. S., Elkahwaji J., Chang Z., Scheunemann T. L., Manthei E. R., Hamawy M. M. (2003) Cell. Signal. 15, 85–93 [DOI] [PubMed] [Google Scholar]
- 28.Murakami R., Kambe F., Mitsuyama H., Okumura K., Murohara T., Niwata S., Yamamoto R., Seo H. (2003) Arterioscler. Thromb. Vasc. Biol. 23, 2034–2040 [DOI] [PubMed] [Google Scholar]
- 29.Sindermann J. R., Skaletz-Rorowski A., Bartels A., Hohage H., Plenz G., Schmidt A., Breithardt G. (2002) Basic Res. Cardiol. 97, 125–131 [DOI] [PubMed] [Google Scholar]
- 30.Datta D., Contreras A. G., Basu A., Dormond O., Flynn E., Briscoe D. M., Pal S. (2009) Cancer Res. 69, 8902–8909 [DOI] [PMC free article] [PubMed] [Google Scholar]
- 31.Chen C., Johnston T. D., Jeon H., Gedaly R., McHugh P., Ranjan D. (2009) J. Surg. Res. 153, 156–161 [DOI] [PubMed] [Google Scholar]
- 32.Cho C. S., Chang Z., Elkahwaji J., Scheunemann T. L., Manthei E. R., Colburn M., Knechtle S. J., Hamawy M. M. (2003) Int. Immunol. 15, 1369–1378 [DOI] [PubMed] [Google Scholar]
Associated Data
This section collects any data citations, data availability statements, or supplementary materials included in this article.