Abstract
Approximately 90% of cases of Lafora disease, a fatal teenage-onset progressive myoclonus epilepsy, are caused by mutations in either the EPM2A or the EPM2B genes that encode, respectively, a glycogen phosphatase called laforin and an E3 ubiquitin ligase called malin. Lafora disease is characterized by the formation of Lafora bodies, insoluble deposits containing poorly branched glycogen or polyglucosan, in many tissues including skeletal muscle, liver, and brain. Disruption of the Epm2b gene in mice resulted in viable animals that, by 3 months of age, accumulated Lafora bodies in the brain and to a lesser extent in heart and skeletal muscle. Analysis of muscle and brain of the Epm2b−/− mice by Western blotting indicated no effect on the levels of glycogen synthase, PTG (type 1 phosphatase-targeting subunit), or debranching enzyme, making it unlikely that these proteins are targeted for destruction by malin, as has been proposed. Total laforin protein was increased in the brain of Epm2b−/− mice and, most notably, was redistributed from the soluble, low speed supernatant to the insoluble low speed pellet, which now contained 90% of the total laforin. This result correlated with elevated insolubility of glycogen and glycogen synthase. Because up-regulation of laforin cannot explain Lafora body formation, we conclude that malin functions to maintain laforin associated with soluble glycogen and that its absence causes sequestration of laforin to an insoluble polysaccharide fraction where it is functionally inert.
Keywords: E3 Ubiquitin Ligase, Glycogen, Glycogen Storage Disease, Glycogen Synthase, Neurological Diseases, Lafora Disease, PTG, Laforin, Malin
Introduction
Lafora disease (EPM2; OMIM254780) is an autosomal recessive progressive myoclonus epilepsy with onset in adolescence followed by gradual decline and death usually within 10 years (1–4). A characteristic of Lafora disease is the accumulation of Lafora bodies, insoluble periodic acid-Schiff-positive deposits that contain polyglucosan, a poorly branched form of glycogen. In the disease, Lafora bodies develop in many tissues, including muscle, liver, and neurons, but it is generally believed that Lafora body accumulation ultimately leads to neuronal cell death and the neurological sequelae (4). Lafora disease would then be a non-classical type of glycogenosis. Glycogen is a branched storage polymer of glucose, present in many tissues including muscle, liver, and brain. Glycogen synthesis is mediated by the actions of glycogen synthase, which catalyzes the elongation of the polyglucose chains, and branching enzyme, which introduces the branch points (5, 6). Glycogen synthase is negatively regulated by phosphorylation, which renders the enzyme dependent on the allosteric activator glucose-6-phosphate (G6P)4 for activity (5). The −/+ G6P activity ratio is thus used as a kinetic index of the activation state of the enzyme (7). Degradation of glycogen in the cytosol is mediated by glycogen phosphorylase and the debranching enzyme (AGL). One mechanism for the formation of polyglucosan is an imbalance between elongating and branching activities, as occurs in adult polyglucosan disease, in which branching enzyme is mutated (8), or Tarui disease, in which mutation of phosphofructokinase is thought to cause a buildup of glycolytic intermediates and inappropriate activation of glycogen synthase by G6P (9).
Recently, there has been substantial progress in understanding the genetics of Lafora disease. About 90% of Lafora cases can now be attributed to loss of function mutations in two genes, EPM2A (epilepsy progressive myoclonus type 2A) (10) and EPM2B (epilepsy progressive myoclonus type 2B) (11). EPM2A encodes laforin, a protein with a C-terminal dual specificity protein phosphatase domain and an N-terminal CBM20 carbohydrate-binding domain. EPM2B encodes malin, a protein composed of an N-terminal E3 ubiquitin ligase domain and a C-terminal series of NHL repeats (11). Most recent Lafora research has focused on understanding the functions of laforin and malin and their relationship to the development of the disease.
The search for protein substrates of laforin led to a proposal that it dephosphorylated the inhibitory N-terminal phosphorylation site of glycogen synthase kinase-3 (GSK-3) (12), a negative regulator of glycogen synthase (5). If EPM2A mutation increased the phosphorylation and inactivation of GSK-3, the end result would be activation of glycogen synthase and an enzymic imbalance favoring polyglucosan formation. However, several studies argue against GSK-3 being a laforin substrate (13–16), perhaps most importantly the fact that its phosphorylation state is unchanged in two different genetic mouse models of Lafora disease in which either the Epm2a gene is disrupted (14) or a dominant-negative laforin is overexpressed (15). Measurements of glycogen synthase and branching enzyme activities in these mice also argued against the “branching imbalance” hypothesis. Much stronger evidence supports the proposal that laforin is actually a glycogen phosphatase, removing the small amount of covalent phosphate known to be present in glycogen (14). Epm2a−/− mice have elevated glycogen phosphate and develop abnormally structured glycogen, consistent with Lafora body formation (16).
Malin has been shown to exhibit ubiquitin ligase activity in vitro and in cells (17). It has been suggested that malin and laforin interact (17) and that a laforin-malin complex is required for normal function (18, 19). In this way, laforin, via its glycogen-binding module, could recruit malin to the glycogen particle. Several proteins have been proposed to be subject to malin-mediated ubiquitylation, which would then lead to their degradation. These targets include glycogen synthase (18), glycogen debranching enzyme (20), the type 1 protein phosphatase glycogen-targeting subunit, PTG (18, 19), and laforin (17). We have shown that in Epm2a−/− mice, there are no differences in the levels of debranching enzyme or PTG, arguing against the hypothesis that an obligate malin-laforin complex directs degradation of these proteins (16). One group has also suggested that laforin is phosphorylated by the AMP-activated protein kinase (AMPK), thereby regulating its interaction with malin and hence malin function (21). However, most of these interesting conclusions derive from studies of cultured cell models and protein overexpression systems.
We report here the generation of Epm2b knock-out mice. From analysis of 3-month-old animals, we show that the absence malin leads to a redistribution of brain laforin from the soluble, low speed supernatant to the insoluble, low speed pellet, where we propose that it is functionally ineffective.
EXPERIMENTAL PROCEDURES
Chemicals and Reagents
Amyloglucosidase (Aspergillus niger) was from Fluka. Diastase was from Fisher. Antibody sources were as follows. Anti-glycogen synthase, anti-glycogen synthase PhosphoSite 3a, anti-phospho-GSK-3, anti-phospho- and non-phospho-AMPK, and anti-phospho-eIF2α were from Cell Signaling Technology; anti-laforin was from Abnova; anti-GSK-3 was from Invitrogen; anti-glyceraldehyde-3-phosphate dehydrogenase antibody was from Biodesign; and anti-AGL antibody was from Abgent. Antibodies against RGL are as described previously (22). Anti-PTG antibodies were a generous gift from Dr. Alan Saltiel (University of Michigan, Ann Arbor MI). Oligonucleotides were from Invitrogen. Radioactively labeled substrate UDP-[U-14C]glucose was from PerkinElmer Life Sciences, and [14C]glucose-1-phosphate was from Moravek Biochemicals, Inc. Other chemicals and reagents were from Sigma, Bio-Rad, Invitrogen, or New England Biolabs.
Generation of Epm2b Knock-out Mice
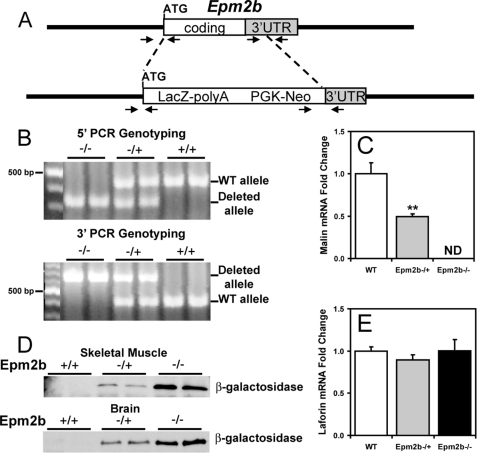
Epm2b disrupted ES C57BL/6N (10571D-E2) cells were purchased from the Knockout Mouse Project Repository (KOMP), University of California, Davis, CA. The strategy for the disruption was to replace the complete Epm2b coding region plus 391 nucleotides of 3′-untranslated region with a cassette containing the LacZ and the neo genes. The LacZ gene was fused in-frame at the Epm2b ATG (see Fig. 1A). After expansion and confirmation of targeting by PCR analyses (see Fig. 1B), the cells were injected into C57Bl/6J blastocysts, and the injected blastocysts were implanted in the uterus of pseudo-pregnant C57Bl/6J females for generation of chimeric mice. PCR genotyping of the chimeric mice showed that one male was positive for the disruption and was mated with C57Bl/6J females to test for germline transmission. Heterozygous F1 mice were intercrossed to generate the animals used in this study. Wild type (WT), heterozygous (+/−) and homozygous null (−/−) mice were identified by PCR genotyping using oligonucleotide primers that straddle both the 5′-end and the 3′-end of the Epm2b disrupted region (see Fig. 1B). Further confirmation of the disruption was obtained by quantitative Real Time-PCR of Epm2b mRNA (see Fig. 1C) and by analyzing expression of β-galactosidase (see Fig. 1D).
FIGURE 1.
Targeted disruption of Epm2b. A, strategy for the disruption of the Epm2b gene. A diagram of the Epm2b locus and targeted disruption of the coding region is shown. Arrowheads indicate the position of the oligonucleotide primers used for PCR genotyping. UTR, untranslated region. B, 5′- and 3′-PCR genotyping. The wild type and the disrupted alleles are indicated. C and E, malin and laforin transcript levels. Malin and laforin mRNA levels were determined in skeletal muscle of 3-month-old mice as described under “Experimental Procedures.” n = 4. *, p < 0.01 versus WT. ND indicates not detectable. D, β-galactosidase expression. Shown is a representative Western blot of β-galactosidase expression in skeletal muscle and brain of WT, heterozygous, and homozygous null Epm2b mice (n = 8).
The Epm2b mice were generated at the Indiana University Transgenic and Knockout Core Facility. All mice were maintained in temperature- and humidity-controlled conditions with a 12:12-h light-dark cycle, fed a standard chow (Harlan Teklad global diet 2018SX), and allowed food and water ad libitum. All studies utilized 3-month-old males, were conducted in accordance with federal guidelines, and were approved by the Institutional Animal Use and Care Committee of Indiana University.
RNA Isolation and Quantitative Real Time-PCR
RNA was isolated from 50 mg of tissue with TRIzol reagent. Four μg of RNA were subjected to reverse transcription using the SuperScript III reverse transcriptase kit. Primers and probes for mouse Epm2a and Epm2b were designed using the Universal probe library tool from Roche Applied Science. Information on the amplicons used is available on request. The real-time PCR reactions were performed using the LightCycler 480 probes master reagent (Roche Applied Science). The -fold change in the target mRNA contents with respect to baseline and normalized by the reference gene (18 S) was calculated as described (23) using a relative standard curve.
Tissue Staining
Sections were prepared from 3-month-old mouse tissues fixed in 10% formalin and embedded in paraffin. Slices of 5 μm were deparaffinized, treated with 0.1% diastase in 20 mm sodium acetate (pH 6.0) to degrade glycogen, or treated with buffer, for 1 h at 40 °C. Sections were oxidized with 0.5% periodic acid for 5 min, stained with Schiff reagent for 15 min, and counterstained in hematoxylin and eosin for 15 min. Tissue sectioning and staining was performed by the Histology Core in the Department of Anatomy and Cell Biology, Indiana University School of Medicine.
Exercise Protocol
Exercise to exhaustion was performed on 3-month-old male C57Bl/6J mice using a treadmill (Exer6M, Columbus Instruments) following the procedure described previously (24), with minor modifications. Immediately after exhaustion, mice were sacrificed by cervical dislocation, and tissues were immediately collected in liquid nitrogen and stored at −80 °C until use.
Glycogen Synthase and Glycogen Phosphorylase Activity Assays
Random fed male mice 3 months of age were sacrificed by cervical dislocation followed by decapitation. The heads were immediately dropped in liquid nitrogen, and skeletal muscle was dissected and immersed in liquid nitrogen. Samples were stored at −80 °C until use. Homogenates were centrifuged at 6,500 × g for 10 min, the supernatant (LSS) was removed, and the low speed pellet (LSP) was resuspended in the initial volume of buffer. Glycogen synthase (GS) and phosphorylase (Ph) activities were determined in the LSS and LSP by measuring the incorporation of [14C]glucose from UDP-[U-14C]glucose into glycogen as described by Thomas et al. (25) in the absence or presence of 7.2 mm G6P and by measuring the incorporation of [14C]glucose from [14C]glucose-1-phosphate into glycogen in the absence or presence of 2 mm AMP (26), respectively. Activity ratios represent the activity measured in the absence divided by that in the presence of the allosteric effectors G6P for glycogen synthase or AMP for phosphorylase and provide an index of the activation state, and hence, phosphorylation of the enzymes. Glycogen synthase activity is expressed as nmol/min/mg, and phosphorylase activity is expressed as μmol/min/mg. Protein content was determined by the method of Bradford (27) using bovine serum albumin as a standard. More details are in the supplemental material.
Glycogen Determination
Glycogen content in skeletal muscle and brain was measured as described previously by Suzuki et al. (28). Briefly, samples of frozen tissues (30–50 mg) or LSS and LSP were hydrolyzed in 30% (w/v) KOH in a boiling water bath for 60 min. After repeated ethanol precipitations, the glycogen was digested with amyloglucosidase, and glucose equivalents were determined by the method of Bergmeyer (29). Glycogen content is expressed as μmol of glucosyl units/g of wet weight.
Western Blotting
Samples from the LSS and LSP described above were used for Western blot analyses. For skeletal muscle, comparable amounts of LSS and LSP were loaded. The brain homogenates of the samples used for Western blots of laforin were prepared in the absence of added glycogen. Brain LSPs were enriched with respect to the LSS because of the low protein concentration in the fraction. However, all quantitations were normalized for comparable amounts of samples. More details are in the supplemental material.
Statistical Analyses
The data are presented as the mean ± S.E. Statistical significance was evaluated by an unpaired Student's t test and was considered significant at p < 0.05.
RESULTS
Generation of Epm2b−/− Mice
ES cells, targeted for deletion of the single exon of the Epm2b/NHLRC1 gene (Fig. 1A), were obtained from KOMP and used to generate mice as described under “Experimental Procedures.” Germline transmission of the disrupted allele gave heterozygous Epm2b−/+ mice in a C57/Bl6 background. Progeny from crosses of heterozygous mice generated animals for characterization. Homozygous mice were born at the expected frequency for Mendelian inheritance. Because we have been unable to obtain usable antibodies against mouse malin, we adopted several independent approaches to assure deletion. Standard PCR directed at both the 5′-end and the 3′-end of the insertion clearly distinguished the wild type and mutant alleles (Fig. 1B). Quantitative PCR was applied to determine message levels and did not detect malin message in Epm2b−/− mice (Fig. 1C). Finally, the gene disruption strategy places β-galactosidase under the control of the malin promoter. Therefore, the presence of β-galactosidase marks the targeted deletion of Epm2b in tissues that express malin. Samples from brain and muscle of Epm2b−/+ and Epm2b−/− mice were positive for β-galactosidase by Western blotting, whereas no signal was detected in the wild type mice (Fig. 1D). From all of these criteria, we conclude that the Epm2b−/− mice indeed carry a disruption in both alleles of the gene. We also used quantitative PCR to analyze the laforin mRNA level and found no change in the Epm2b−/− mice (Fig. 1E).
Lafora Bodies in Epm2b−/− Mice
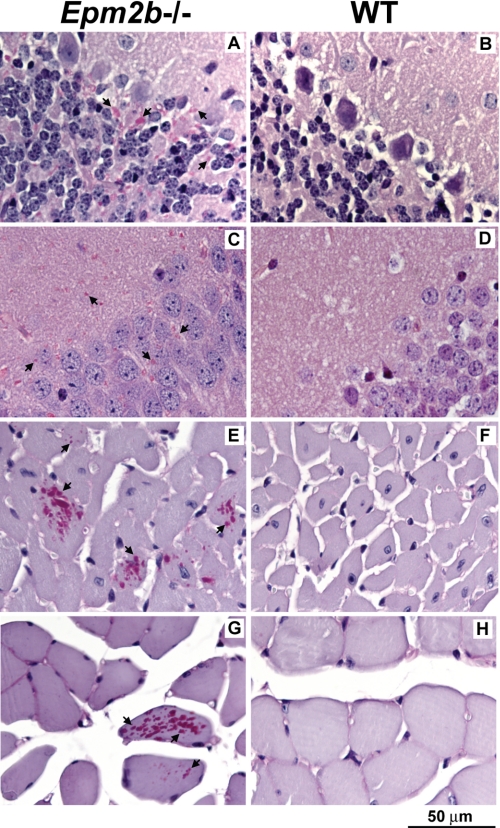
A characteristic feature of Lafora disease is the presence of Lafora bodies in tissues. Therefore, we analyzed various tissues for their presence. Sections from brain, skeletal muscle, heart, and liver of 3-month-old wild type and knock-out mice were treated with diastase and then stained with periodic acid-Schiff to visualize α-amylase resistant polysaccharide. Periodic acid-Schiff/diastase-positive structures, indicative of Lafora bodies, were visible in most areas of the brain. They were most abundant in the cerebellum (Fig. 2A) and were also plentiful in the hippocampus (Fig. 2C) and cortex (not shown) of Epm2b−/− animals. Comparable structures were absent in corresponding sections from wild type littermates (Fig. 2, B and D). Although less abundant than in brain, Lafora bodies were also readily detectable in heart muscle from knock-out mice (Fig. 2E) but not wild type littermates (Fig. 2F). We have yet to complete a systematic survey of skeletal muscle, but it is apparent that Lafora bodies are much more scarce in muscle than in brains or even hearts from Epm2b−/− mice at this age. We found some Lafora bodies in soleus muscle (Fig. 2G) but not in wild type controls (Fig. 2H). The lower incidence of Lafora bodies in skeletal muscle as compared with brain is consistent with the lesser degree of glycogen synthase and laforin redistribution to the insoluble LSP in these tissues (see below). No Lafora bodies were detected in the livers of Epm2b−/− mice (not shown).
FIGURE 2.
Lafora bodies in tissues of Epm2b−/− mice. Sections of brain, heart, and skeletal muscle were stained with periodic acid-Schiff/diastase to visualize α-amylase resistant polysaccharide, indicated by arrows. A, cerebellum, Epm2b−/−; B, cerebellum, wild type; C, hippocampus, Epm2b−/−; D, hippocampus, wild type; E, heart, Epm2b−/−; F, heart, wild type; G, soleus muscle, Epm2b−/−; H, soleus muscle, wild type.
Although Lafora bodies were present in the brains of 3-month-old Epm2b−/− mice, we observed no obvious movement disorder or spontaneous seizures. Photostimulation using a strobe light source did not elicit any abnormal response. However, based on the studies of Epm2a−/− mice (30), we might not expect to observe any neurological or behavioral abnormalities in mice this young. Also, there is some evidence that Lafora disease caused by malin mutation has a somewhat milder course than that due to laforin mutation (31).
Glycogen, Glycogen-metabolizing Enzymes, and Related Proteins in Epm2b−/− Mice
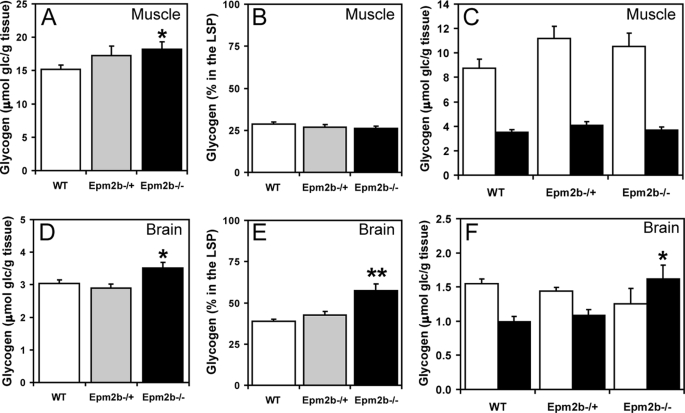
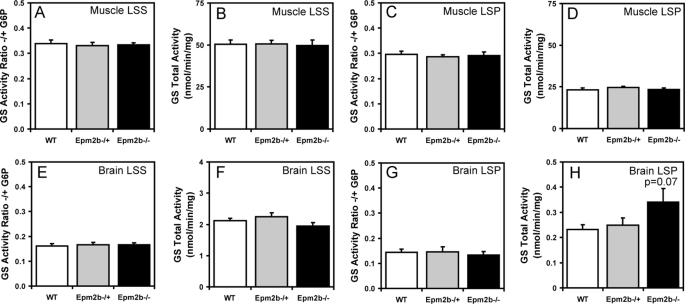
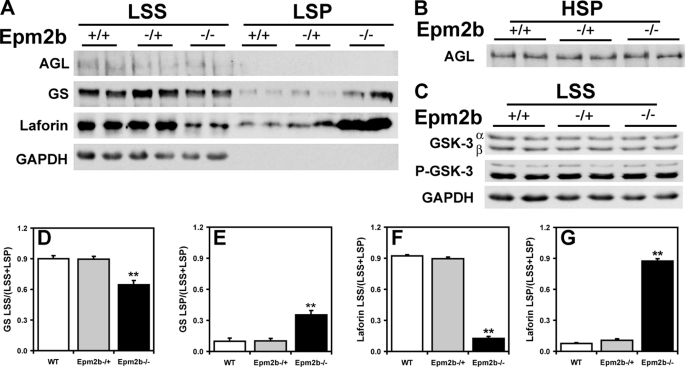
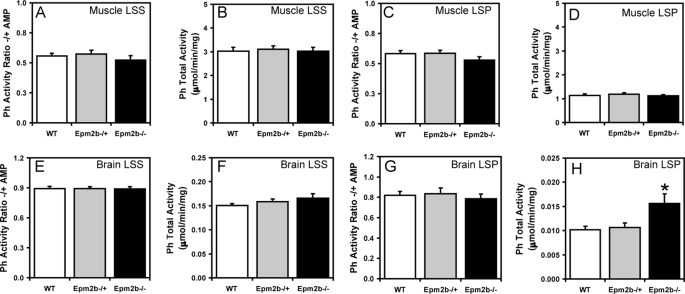
Because Lafora disease is associated with abnormal glycogen metabolism, it was important to analyze glycogen and associated proteins in the Epm2b−/− mice, also because several of these proteins have been proposed to be targets of malin action, as described in the Introduction. A small but significant increase in total glycogen was observed in muscle and brain from Epm2b−/− mice (Fig. 3, A and D). Low speed centrifugation of tissue extracts separates glycogen into the soluble supernatant (LSS) and the insoluble pellet (LSP). In muscle, the distribution of glycogen was unchanged, but in brain, there was a significant increase in the proportion of insoluble glycogen in tissue from Epm2b−/− mice (Fig. 3, compare B and C and E and F). Glycogen synthase total activity and −/+ G6P activity ratios were unchanged in the knock-out animals (Fig. 4, A–H), although in brain, there was a trend to increased total activity in the LSP (Fig. 4H). These results were confirmed by Western blotting with anti-glycogen synthase antibodies (see Figs. 6A and 7A), and in the case of brain, the increased proportion of glycogen synthase in the LSP was statistically significant. Glycogen phosphorylase total activity, activation state (−/+ AMP activity ratio), and distribution between soluble and insoluble fractions in muscle and brain were unaffected by loss of the Emp2b gene (Fig. 5, A–H). The knock-out animals did, however, display a significant increase in total phosphorylase activity in the LSP (Fig. 5H). The level of the other metabolic enzyme analyzed, debranching enzyme, was also unaltered in knock-out animals (Figs. 6A and 7A). In brain extracts, the AGL signal by Western blotting was weak, and so the enzyme was enriched by high speed centrifugation of the LSS to produce a glycogen pellet. AGL levels in this pellet were the same in wild type and knock-out mice (Fig. 7B). Therefore, the only potentially significant changes associated with Epm2b disruption in these analyses was a slight increase in total glycogen and an enrichment of glycogen and glycogen synthase in the insoluble fraction in brain.
FIGURE 3.
Glycogen levels in skeletal muscle and brain of Epm2b−/− mice. A, total skeletal muscle glycogen levels, expressed as glucose (glc) equivalents per g of tissue. *, p < 0.05 versus WT (n = 8). B, the percentage of skeletal muscle glycogen in the LSP (n = 4). C, skeletal muscle glycogen levels in the LSS (open bars) and LSP (filled bars) (n = 4). D, total brain glycogen levels. *, p < 0.05 versus WT (n = 8). E, the percentage of brain glycogen in the LSP. **, p < 0.01 versus WT and Epm2b−/+ (n = 6). F, brain glycogen levels in the LSS (open bars) and LSP (filled bars). *, p < 0.05 versus WT LSP (n = 6).
FIGURE 4.
Glycogen synthase activity in skeletal muscle and brain of Epm2b−/− mice. Skeletal muscle and brain from 3-month-old male WT, Epm2b−/+, and Epm2b−/− mice were analyzed. A, skeletal muscle GS −/+ G6P activity ratio in the LSS (n = 8). B, total skeletal muscle GS activity measured in the presence of G6P in the LSS (n = 8). C, skeletal muscle GS −/+ G6P activity ratio in the LSP (n = 8). D, total skeletal muscle GS activity in the LSP measured in the presence of G6P (n = 8). E, brain GS −/+ G6P activity ratio in the LSS (n = 8). F, total brain GS activity in the LSS measured in the presence of G6P (n = 8). G, brain GS activity ratio in the LSP −/+ G6P (n = 8). H, total brain GS activity in the LSP measured in the presence of G6P (n = 8).
FIGURE 6.
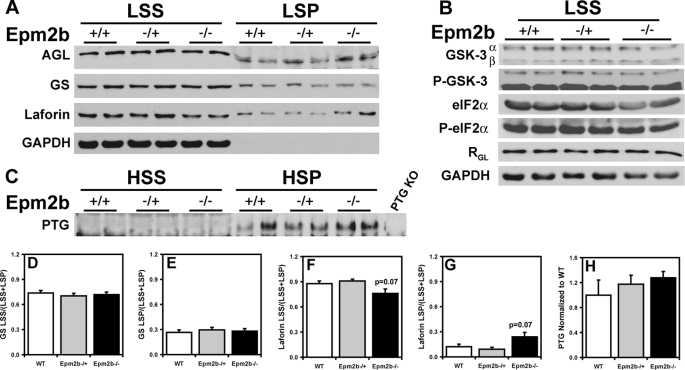
Glycogen-metabolizing enzymes and related proteins in skeletal muscle of Epm2b−/− mice. Skeletal muscle from 3-month-old male WT, Epm2b−/+, and Epm2b−/− mice was analyzed. A, distribution of AGL, GS, and laforin protein levels in skeletal muscle LSS and LSP. Representative Western blots are shown from n = 8. Comparable amounts of samples of the LSS and LSP were loaded. GAPDH, glyceraldehyde-3-phosphate dehydrogenase. B, GSK-3, phospho-GSK-3 (P-GSK-3), eIF2α, phospho-eIF2α (P-eIF2α), and RGL protein levels in the LSS. Representative Western blots are shown from n = 4. Comparable amounts of samples were loaded. Glyceraldehyde-3-phosphate dehydrogenase was used as loading control. C, PTG protein levels in the HSS and the HSP. Samples in the HSP pellet were enriched five times with respect to the HSS to allow detection. KO, knock-out. D, quantitation of GS protein levels in the LSS, expressed as the ratio of protein in the LSS to the total protein (LSS + LSP) (n = 8). E, quantitation of GS protein levels in the LSP, expressed as the ratio of protein in the LSS to the total protein (LSS + LSP) (n = 8). F, quantitation of laforin protein levels in the LSS, expressed as the ratio of protein in the LSS to the total protein (LSS + LSP) (n = 8). G, quantitation of laforin protein levels in the LSP, expressed as the ratio of protein in the LSS to the total protein (LSS + LSP) (n = 8). H, quantitation of PTG protein levels in the HSP normalized to WT protein levels (n = 4).
FIGURE 7.
Glycogen-metabolizing enzymes and related proteins in brain of Epm2b−/− mice. Skeletal muscle from 3-month-old male WT, Epm2b+/−, and Epm2b−/− mice was analyzed. A, distribution of AGL, GS, and laforin protein levels in brain LSS and LSP. Representative Western blots are shown from n = 5–8). LSP of AGL and GS are enriched ∼2.5-fold as compared with LSS because of the low protein concentration in the pellet fraction, whereas LSP of laforin are enriched only by 50%. GAPDH, glyceraldehyde-3-phosphate dehydrogenase. B, AGL protein levels in the HSP enriched 2.5-fold with respect to the LSS (n = 4). C, GSK-3 and phospho-GSK-3 (P-GSK-3) protein levels in the LSS (n = 4). D, quantitation of GS protein levels in the LSS, expressed as the ratio of protein in the LSS to the total protein (LSS + LSP). **, p = 0.0002 (n = 8), normalized for equal sample loading. E, quantitation of GS protein levels in the LSP, expressed as the ratio of protein in the LSS to the total protein (LSS + LSP), normalized for equal sample loading. **, p = 0.0002 (n = 8). F, quantitation of laforin protein levels in the LSS, expressed as the ratio of protein in the LSS to the total protein (LSS + LSP). **, p < 0.0001 (n = 5), normalized for equal sample loading. G, quantitation of laforin protein levels in the LSP, expressed as the ratio of protein in the LSS to the total protein (LSS + LSP). **, p < 0.0001 (n = 5), normalized for equal sample loading.
FIGURE 5.
Glycogen phosphorylase activity in skeletal muscle and brain of Epm2b−/− mice. Skeletal muscle and brain from 3-month-old male WT, Epm2b−/+, and Epm2b−/− mice were analyzed. A, skeletal muscle Ph −/+ AMP activity ratio in the LSS (n = 8). B, total skeletal muscle Ph activity in the LSS, measured in the presence of AMP (n = 8). C, skeletal muscle Ph −/+ AMP activity ratio in the LSP (n = 8). D, total skeletal muscle Ph activity in the LSP, measured in the presence of AMP (n = 8). E, brain Ph −/+ AMP activity ratio in the LSP (n = 8). F, total brain Ph activity in the LSS, measured in the presence of AMP (n = 8). G, brain Ph −/+ AMP activity ratio in the LSP (n = 8). H, total brain Ph activity in the LSP, measured in the presence of AMP. *, p < 0.05 versus WT (n = 8).
The type 1 protein phosphatase glycogen-binding subunit, PTG, has been proposed to be a target for malin-mediated ubiquitylation and degradation (18, 19). To detect PTG, it was necessary to prepare a high speed glycogen pellet. From analysis of this fraction, there was no change in PTG level in the Epm2b−/− mice (Fig. 6C). We also analyzed the level of another glycogen-associated PP1-targeting subunit, RGL/GM (28), that is found in striated muscle and observed no alteration in the Epm2b−/− mice (Fig. 6B). As noted in the Introduction, GSK-3 was also considered a candidate to be a laforin substrate (12). We therefore analyzed GSK-3 total protein and phosphorylation of the inhibitory N-terminal site. Neither parameter was affected by loss of the Epm2b gene, in either muscle or brain extracts (Figs. 6B and 7C). We also analyzed the phosphorylation state of the eukaryotic initiation factor α (eIF2α), a marker for endoplasmic reticulum stress. No detectable changes were observed in the Epm2b−/− animals (Fig. 6C).
Previous work has implicated laforin as a malin target (17) and has also suggested that malin and laforin function as a complex (32). Analysis of muscle extracts indicated a trend toward an increased distribution of laforin to the insoluble LSP (Fig. 6A). However, from analysis of brain, there was a large increase in total laforin protein and a major, statistically significant redistribution of laforin to the LSP accompanied by clear depletion of the soluble LSS fraction in the Epm2b−/− mice (Fig. 7A). In wild type animals, more than 90% of the laforin was in the soluble LSS fraction (Fig. 7F), but in the knock-out animals, ∼90% of the laforin was present in the insoluble LSP fraction (Fig. 7G). This result is the most striking biochemical difference that we have observed so far from study of the Epm2b knock-out mice.
Effect of AMPK Activation on Glycogen-metabolizing Enzymes
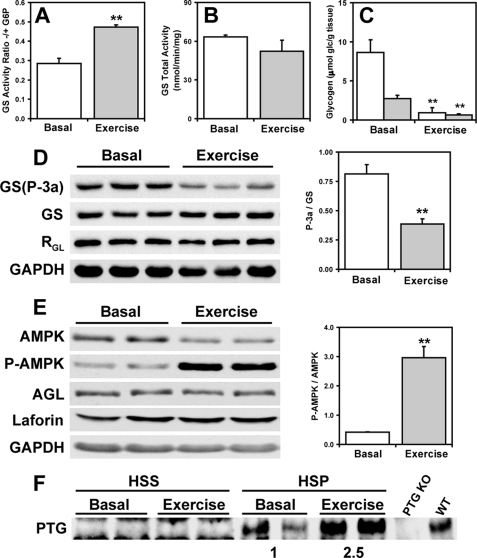
Solaz-Fuster et al. (21) have proposed that AMPK phosphorylates laforin, controls its association with malin, and thereby regulates laforin and malin targets. AMPK was also reported to phosphorylate the PTG protein phosphatase subunit and target it for degradation by the malin-laforin complex (33). Muscle AMPK was therefore activated in vivo by exercising wild type mice to exhaustion on a treadmill. Glycogen was significantly depleted by this exercise regimen (Fig. 8C) with concomitant activation of glycogen synthase, as judged by the −/+ G6P activity ratio (Fig. 8A) and Western analysis of the phosphorylation of site 3a (Fig. 8D). A 6-fold increase in the activation state of AMPK was observed, as judged by the ratio of phospho-AMPK to total AMPK (Fig. 8E). Under these conditions, no changes were observed in the protein levels of glycogen synthase, debranching enzyme, laforin, and RGL (Fig. 8, D and E). Interestingly, PTG protein levels were increased in response to exercise, opposite to what would be expected if AMPK phosphorylation targeted it for degradation (Fig. 8F). This result is also consistent with activation of glycogen synthase (Fig. 8A). We therefore find no evidence to support a role for AMPK in degradation of these proteins via malin or any other mechanism.
FIGURE 8.
Effect of AMPK activation on glycogen-metabolizing enzymes and related proteins in skeletal muscle of exercised mice. Skeletal muscle of 3-month-old WT male mice exercised to exhaustion was analyzed. A, GS −/+ G6P activity ratio in the LSS of basal and exercised mice. **, p < 0.01 (n = 3). B, total GS activity in the LSS measured in the presence of G6P of basal and exercised mice (n = 3). C, skeletal muscle glycogen levels in the LSS (open bars) and LSP (filled bars) of basal and exercised mice (n = 3). D, Western blots of phosphorylated GS (site 3a) (GS-P-3a), total GS, and RGL in basal and exercised mice and quantitation of GS site 3a phosphorylation **, p < 0.01 (n = 3). GAPDH, glyceraldehyde-3-phosphate dehydrogenase. E, Western blots of phosphorylated AMPK (P-AMPK), total AMPK, AGL, and laforin and quantitation of AMPK phosphorylation in basal and exercised mice **, p < 0.01 (n = 3). F, PTG protein levels in the HSS and HSP of basal and exercised mice. HSP samples are enriched 4-fold with respect to the HSS. KO, knock-out.
DISCUSSION
Given that the large majority of Lafora disease cases are caused by mutations to the EPM2A and EPM2B genes, the challenge for understanding the molecular mechanism underlying the development of the disease is to comprehend the functions of the respective gene products, laforin and malin. Our understanding of laforin function is more developed, and the hypothesis that laforin serves to remove covalent phosphate from glycogen (14) is supported by the observation that glycogen isolated from Epm2a knock-out animals has elevated covalent phosphate over wild type and has abnormal physico-chemical properties, with reduced solubility in water, as would be expected for the formation of Lafora bodies (16). Lafora bodies in patients have also been reported to have elevated phosphate content (34). Our current model is that laforin acts in a damage control mechanism to maintain the level of glycogen phosphorylation within tolerated limits to allow its normal cytosolic metabolism and to prevent glycogen from becoming insoluble and metabolically inert (16). The argument that laforin dephosphorylates glycogen is strengthened by the functional analogy between laforin and the plant Sex4 protein, which has a well established role as a starch phosphatase (35). Nonetheless, it remains possible that laforin might have additional functions in addition to being a glycogen phosphatase.
The function of malin is less clear, and several different proposals have been advanced to explain its mechanism of action. Biochemically, malin has been shown to act as an E3 ubiquitin ligase (17), and studies with cultured cells have implicated multiple proteins as targets for malin action, including glycogen synthase, debranching enzyme, PTG, and laforin (17–20). If malin targets these proteins for degradation by ubiquitylation, as proposed, one would expect their levels to be elevated when malin activity is defective, as in EPM2B patients or in mice with the Epm2b gene disrupted. From the results of the present study, we find no evidence for changes in the levels of glycogen synthase, debranching enzyme, or PTG in the Epm2b−/− mice. In the case of glycogen synthase, there is no change in the glycogen synthase activation state. It therefore seems quite unlikely that malin regulates these proteins in vivo. Nonetheless, the Epm2b−/− mice do accumulate Lafora bodies.
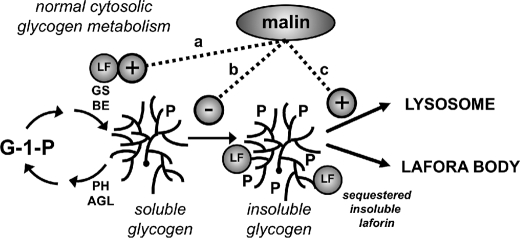
The results with laforin in the Epm2b−/− mice are more complex and perhaps more informative. At only 3 months of age, there is a trend to increased laforin in the insoluble LSP fraction of tissue extracts from muscle of Epm2b−/− mice. In brain, however, there is an almost complete redistribution of laforin from the soluble LSS fraction to the insoluble LSP fraction, together with a clear increase in total laforin protein. This is accompanied by statistically significant increases in the proportion of glycogen and glycogen synthase present in the LSP. The increase in laforin protein would be consistent with malin causing degradation of laforin in wild type mice, as has been proposed by Gentry et al. (17). An alternative mechanism, which we favor, is that defects in malin promote the accumulation of insoluble glycogen and the consequent sequestration of laforin in a non-functional compartment where it is also protected from proteolytic degradation (Fig. 9).
FIGURE 9.
Possible roles for malin in glycogen metabolism. Normal, cytosolic glycogen metabolism involves synthesis by GS and branching enzyme (BE) and degradation by Ph and debranching enzyme (AGL). In this model, active, soluble laforin (LF) is viewed as a necessary component of normal glycogen metabolism, preventing hyperphosphorylation that can lead to insoluble, poorly branched glycogen. Malin could act positively to up-regulate or at least maintain soluble laforin activity simply by forming a complex with laforin or by some other mechanism (pathway a). An alternative possibility would be prevention of the formation of aberrantly structured glycogen by an as yet unknown pathway independent of laforin (pathway b). Finally, malin might act to promote the lysosomal disposal of any aberrantly structured glycogen as it is formed (pathway c).
Genetically, it has always been a problem reconciling the model of malin-mediated laforin degradation with the fact that mutation of either malin or laforin causes the same phenotype in patients. If the primary function of malin were to down-regulate laforin, why would elevated laforin cause the same phenotype as impairment of laforin activity in patients? We hypothesize that only the laforin in the LSS fraction can participate in normal glycogen metabolism and that in the Epm2b−/− mice, the absence of malin results in depletion of the soluble laforin pool by its sequestration with glycogen in the insoluble LSP fraction. This model would explain how defective malin could cause down-regulation of laforin even in the face of increased total laforin protein in the Epm2b−/− brain. The process would appear to have an earlier onset in brain than heart and skeletal muscle, consistent with the fact that we have observed relatively few Lafora bodies in skeletal muscle and heart at this age. This tissue difference is interesting and may represent fundamental tissue-specific differences in glycogen metabolism, although what these may be is not obvious at this time.
Potential explanations for how malin prevents laforin sequestration in an insoluble fraction are more speculative at this time. Simple binding of malin and laforin could be sufficient to maintain laforin in the soluble compartment. Malin could actively oppose the formation of abnormally structured glycogen as a positive regulator of laforin activity (Fig. 9, pathway a) or by an unknown laforin-independent mechanism (Fig. 9, pathway b). Alternatively, rather than affecting the formation of abnormal glycogen, malin could prevent accumulation by promoting its disposal to lysosomes (Fig. 9, pathway c). During preparation of this study, Aguado et al. (36) reported that autophagy was suppressed in Epm2a−/− mice, which could be consistent with this last possibility. In any event, the accumulation of structurally aberrant glycogen would disproportionately bind laforin, which is known to interact preferentially with poorly branched polysaccharides like amylopectin (37) and polyglucosan (38).
In conclusion, knock-out of the Epm2b gene generates viable mice with homozygotes produced at the expected Mendelian frequency. However, the mice develop Lafora bodies early in life in brain, and to a lesser degree in skeletal muscle and heart, and should provide a robust model of Lafora disease. It will be interesting to monitor the progression of Lafora body formation and associated neurological function as the mice age. From our results, malin does not directly regulate glycogen metabolism by controlling the levels of glycogen synthase, the glycogen debranching enzyme, or the phosphatase glycogen-targeting subunit PTG. Lack of malin does affect laforin total protein level and controls its distribution between soluble LSS and insoluble LSP compartments. We propose that in Epm2b−/− mice, laforin becomes sequestered with insoluble glycogen, resulting in an effective loss of function of laforin.
Supplementary Material
Acknowledgments
We thank William Carter for help with generation of the Epm2b−/− mice and Dr. Keith W. Condon for help with histology.
This work was supported, in whole or in part, by National Institutes of Health Grants NS05645 and DK27221 (to P. J. R.).

The on-line version of this article (available at http://www.jbc.org) contains supplemental Experimental Procedures and references.
- G6P
- glucose-6-phosphate
- GS
- glycogen synthase
- Ph
- glycogen phosphorylase
- eIF2α
- eukaryotic initiation factor α
- AGL
- amylo-1,6-glucosidase,4-α-glucanotransferase
- PTG
- protein targeting to glycogen
- RGL
- striated muscle-specific protein phosphatase 1 glycogen-targeting subunit
- GSK-3
- glycogen synthase kinase-3
- AMPK
- adenosine monophosphate-activated protein kinase
- LSS
- low speed supernatant
- LSP
- low speed pellet
- HSS
- high speed supernatant
- HSP
- high speed pellet
- WT
- wild type.
REFERENCES
- 1.Delgado-Escueta A. V. (2007) Curr. Neurol. Neurosci. Rep. 7, 428–433 [DOI] [PubMed] [Google Scholar]
- 2.Gentry M. S., Dixon J. E., Worby C. A. (2009) Trends Biochem. Sci. 34, 628–639 [DOI] [PMC free article] [PubMed] [Google Scholar]
- 3.Ganesh S., Puri R., Singh S., Mittal S., Dubey D. (2006) J. Hum. Genet. 51, 1–8 [DOI] [PubMed] [Google Scholar]
- 4.Ramachandran N., Girard J. M., Turnbull J., Minassian B. A. (2009) Epilepsia 50, Suppl. 5, 29–36 [DOI] [PubMed] [Google Scholar]
- 5.Roach P. J. (2002) Curr. Mol. Med. 2, 101–120 [DOI] [PubMed] [Google Scholar]
- 6.Graham T. E. (2009) Appl. Physiol. Nutr. Metab. 34, 488–492 [DOI] [PubMed] [Google Scholar]
- 7.Roach R. J., Larner J. (1977) Mol. Cell. Biochem. 15, 179–200 [DOI] [PubMed] [Google Scholar]
- 8.Moses S. W., Parvari R. (2002) Curr. Mol. Med. 2, 177–188 [DOI] [PubMed] [Google Scholar]
- 9.Nakajima H., Raben N., Hamaguchi T., Yamasaki T. (2002) Curr. Mol. Med. 2, 197–212 [DOI] [PubMed] [Google Scholar]
- 10.Minassian B. A., Lee J. R., Herbrick J. A., Huizenga J., Soder S., Mungall A. J., Dunham I., Gardner R., Fong C. Y., Carpenter S., Jardim L., Satishchandra P., Andermann E., Snead O. C., 3rd, Lopes-Cendes I., Tsui L. C., Delgado-Escueta A. V., Rouleau G. A., Scherer S. W. (1998) Nat. Genet. 20, 171–174 [DOI] [PubMed] [Google Scholar]
- 11.Chan E. M., Young E. J., Ianzano L., Munteanu I., Zhao X., Christopoulos C. C., Avanzini G., Elia M., Ackerley C. A., Jovic N. J., Bohlega S., Andermann E., Rouleau G. A., Delgado-Escueta A. V., Minassian B. A., Scherer S. W. (2003) Nat. Genet. 35, 125–127 [DOI] [PubMed] [Google Scholar]
- 12.Lohi H., Ianzano L., Zhao X. C., Chan E. M., Turnbull J., Scherer S. W., Ackerley C. A., Minassian B. A. (2005) Hum. Mol. Genet. 14, 2727–2736 [DOI] [PubMed] [Google Scholar]
- 13.Worby C. A., Gentry M. S., Dixon J. E. (2006) J. Biol. Chem. 281, 30412–30418 [DOI] [PMC free article] [PubMed] [Google Scholar]
- 14.Tagliabracci V. S., Turnbull J., Wang W., Girard J. M., Zhao X., Skurat A. V., Delgado-Escueta A. V., Minassian B. A., Depaoli-Roach A. A., Roach P. J. (2007) Proc. Natl. Acad. Sci. U.S.A. 104, 19262–19266 [DOI] [PMC free article] [PubMed] [Google Scholar]
- 15.Wang W., Lohi H., Skurat A. V., DePaoli-Roach A. A., Minassian B. A., Roach P. J. (2007) Arch. Biochem. Biophys. 457, 264–269 [DOI] [PMC free article] [PubMed] [Google Scholar]
- 16.Tagliabracci V. S., Girard J. M., Segvich D., Meyer C., Turnbull J., Zhao X., Minassian B. A., Depaoli-Roach A. A., Roach P. J. (2008) J. Biol. Chem. 283, 33816–33825 [DOI] [PMC free article] [PubMed] [Google Scholar]
- 17.Gentry M. S., Worby C. A., Dixon J. E. (2005) Proc. Natl. Acad. Sci. U.S.A. 102, 8501–8506 [DOI] [PMC free article] [PubMed] [Google Scholar]
- 18.Vilchez D., Ros S., Cifuentes D., Pujadas L., Vallès J., García-Fojeda B., Criado-García O., Fernández-Sánchez E., Medraño-Fernández I., Domínguez J., García-Rocha M., Soriano E., Rodríguez de Córdoba S., Guinovart J. J. (2007) Nat. Neurosci. 10, 1407–1413 [DOI] [PubMed] [Google Scholar]
- 19.Worby C. A., Gentry M. S., Dixon J. E. (2008) J. Biol. Chem. 283, 4069–4076 [DOI] [PMC free article] [PubMed] [Google Scholar]
- 20.Cheng A., Zhang M., Gentry M. S., Worby C. A., Dixon J. E., Saltiel A. R. (2007) Genes Dev. 21, 2399–2409 [DOI] [PMC free article] [PubMed] [Google Scholar]
- 21.Solaz-Fuster M. C., Gimeno-Alcañiz J. V., Ros S., Fernandez-Sanchez M. E., Garcia-Fojeda B., Criado Garcia O., Vilchez D., Dominguez J., Garcia-Rocha M., Sanchez-Piris M., Aguado C., Knecht E., Serratosa J., Guinovart J. J., Sanz P., Rodriguez de Córdoba S. (2008) Hum. Mol. Genet. 17, 667–678 [DOI] [PubMed] [Google Scholar]
- 22.Savage D. B., Zhai L., Ravikumar B., Choi C. S., Snaar J. E., McGuire A. C., Wou S. E., Medina-Gomez G., Kim S., Bock C. B., Segvich D. M., Solanky B., Deelchand D., Vidal-Puig A., Wareham N. J., Shulman G. I., Karpe F., Taylor R., Pederson B. A., Roach P. J., O'Rahilly S., DePaoli-Roach A. A. (2008) PLoS Med. 5, e27. [DOI] [PMC free article] [PubMed] [Google Scholar]
- 23.Pfaffl M. W. (2001) Nucleic Acids Res. 29, e45. [DOI] [PMC free article] [PubMed] [Google Scholar]
- 24.Irimia J. M., Meyer C. M., Peper C. L., Zhai L., Bock C. B., Previs S. F., McGuinness O. P., DePaoli-Roach A., Roach P. J. (2010) J. Biol. Chem. 285, 12851–12861 [DOI] [PMC free article] [PubMed] [Google Scholar]
- 25.Thomas J. A., Schlender K. K., Larner J. (1968) Anal. Biochem. 25, 486–499 [DOI] [PubMed] [Google Scholar]
- 26.Gilboe D. P., Larson K. L., Nuttall F. Q. (1972) Anal. Biochem. 47, 20–27 [DOI] [PubMed] [Google Scholar]
- 27.Bradford M. M. (1976) Anal. Biochem. 72, 248–254 [DOI] [PubMed] [Google Scholar]
- 28.Suzuki Y., Lanner C., Kim J. H., Vilardo P. G., Zhang H., Yang J., Cooper L. D., Steele M., Kennedy A., Bock C. B., Scrimgeour A., Lawrence J. C., Jr., DePaoli-Roach A. A. (2001) Mol. Cell Biol. 21, 2683–2694 [DOI] [PMC free article] [PubMed] [Google Scholar]
- 29.Bergmeyer H. U. (1974) Methods of Enzymatic Analysis, 2nd English Ed., pp. 1128–1131, Verlag Chemie; Academic Press, New York [Google Scholar]
- 30.Ganesh S., Delgado-Escueta A. V., Sakamoto T., Avila M. R., Machado-Salas J., Hoshii Y., Akagi T., Gomi H., Suzuki T., Amano K., Agarwala K. L., Hasegawa Y., Bai D. S., Ishihara T., Hashikawa T., Itohara S., Cornford E. M., Niki H., Yamakawa K. (2002) Hum. Mol. Genet. 11, 1251–1262 [DOI] [PubMed] [Google Scholar]
- 31.Singh S., Ganesh S. (2009) Hum. Mutat. 30, 715–723 [DOI] [PubMed] [Google Scholar]
- 32.Garyali P., Siwach P., Singh P. K., Puri R., Mittal S., Sengupta S., Parihar R., Ganesh S. (2009) Hum. Mol. Genet. 18, 688–700 [DOI] [PubMed] [Google Scholar]
- 33.Vernia S., Solaz-Fuster M. C., Gimeno-Alcañiz J. V., Rubio T., García-Haro L., Foretz M., de Córdoba S. R., Sanz P. (2009) J. Biol. Chem. 284, 8247–8255 [DOI] [PMC free article] [PubMed] [Google Scholar]
- 34.Sakai M., Austin J., Witmer F., Trueb L. (1970) Neurology 20, 160–176 [DOI] [PubMed] [Google Scholar]
- 35.Gentry M. S., Dowen R. H., 3rd, Worby C. A., Mattoo S., Ecker J. R., Dixon J. E. (2007) J. Cell Biol. 178, 477–488 [DOI] [PMC free article] [PubMed] [Google Scholar]
- 36.Aguado C., Sarkar S., Korolchuk V. I., Criado O., Vernia S., Boya P., Sanz P., Rodriguez de Cordoba S., Knecht E., Rubinsztein D. C. (2010) Hum. Mol. Genet. 19, 2867–2876 [DOI] [PMC free article] [PubMed] [Google Scholar]
- 37.Wang W., Roach P. J. (2004) Biochem. Biophys. Res. Commun. 325, 726–730 [DOI] [PubMed] [Google Scholar]
- 38.Chan E. M., Ackerley C. A., Lohi H., Ianzano L., Cortez M. A., Shannon P., Scherer S. W., Minassian B. A. (2004) Hum. Mol. Genet. 13, 1117–1129 [DOI] [PubMed] [Google Scholar]
Associated Data
This section collects any data citations, data availability statements, or supplementary materials included in this article.


