Abstract
The adhesive plaques of Mytilus byssus are investigated increasingly to determine the molecular requirements for wet adhesion. Mfp-2 is the most abundant protein in the plaques, but little is known about its function. Analysis of Mfp-2 films using the surface forces apparatus detected no interaction between films or between a film and bare mica; however, addition of Ca2+ and Fe3+ induced significant reversible bridging (work of adhesion Wad ≈ 0.3 mJ/m2 to 2.2 mJ/m2) between two films at 0.35 m salinity. The strongest observed Fe3+-mediated bridging approaches the adhesion of oriented avidin-biotin complexes. Raman microscopy of plaque sections supports the co-localization of Mfp-2 and iron, which interact by forming bis- or tris-DOPA-iron complexes. Mfp-2 adhered strongly to Mfp-5, a DOPA-rich interfacial adhesive protein, but not to another interfacial protein, Mfp-3, which may in fact displace Mfp-2 from mica. In the presence of metal ions or Mfp-5, Mfp-2 adhesion was fully reversible. These results suggest that plaque cohesiveness depends on Mfp-2 complexation of metal ions, particularly Fe3+ and also by Mfp-2 interaction with Mfp-5 at the plaque-substratum interface.
Keywords: Adhesion, Calcium, Confocal Microscopy, Iron, Ligand Binding Protein, Raman Spectroscopy, DOPA-Containing Proteins, Mussel Adhesive, Surface Force Apparatus
Introduction
The mussel holdfast or byssus is emerging as an effective model system for studying the requirements for opportunistic underwater adhesion (1). The 3,4-dihydroxyphenylalanine (DOPA)4-rich mussel foot proteins (MFPs) of the adhesive footprint, namely Mfp-3 and Mfp-5, have been subjected to particular scrutiny (2–3) given the recent demonstration that DOPA is capable of mediating reversible adhesion to titania surfaces at forces of nearly 1 nanonewton/DOPA (4). Mussel-inspired catecholic polymers are engineered increasingly for moisture-resistant adhesive and coating applications (5–8).
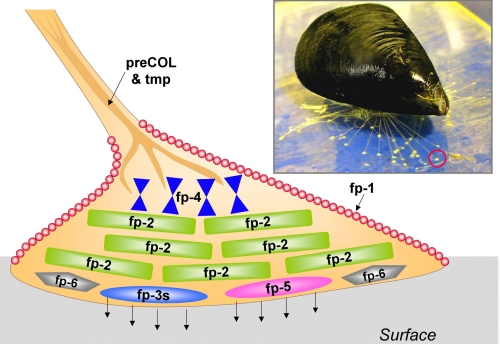
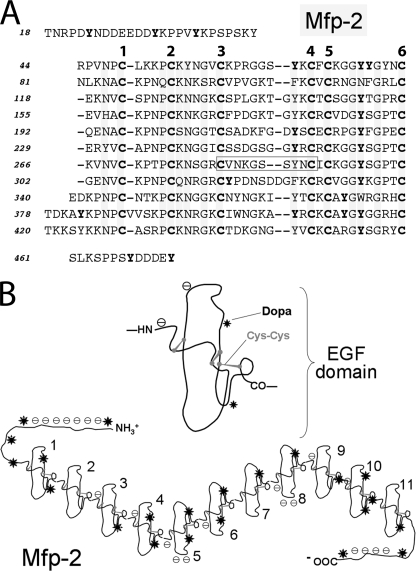
At least five other proteins known mostly as MFPs are present in the byssal plaque and contribute presumably to its adhesive performance: Mfp-1, Mfp-2, Mfp-4, Mfp-6, the prepepsinized collagens (9), and thread matrix protein (Fig. 1) (10). Of these, only two have reasonably well established functions: Mfp-1 complexed to Fe3+ provides a protective outer coating for the plaque and thread (11–12), and the prepepsinized collagens are fiber-forming collagens that mediate the fusion of thread and plaque (13). Other proteins have been partially characterized and sequenced, but their role in byssal structure is largely speculative. Mfp-2 is particularly intriguing because it is the most abundant protein of byssal plaques comprising >25% of the plaque by weight (14). Mfp-2 has a mass of 45 kDa and consists of 11 tandem repeats of an EGF motif, each of which resembles a knot-like structure stabilized by three disulfide bonds (Fig. 2) (15–16). DOPA content is comparatively low at 3–5 mol % with an average of two residues per EGF repeat and three to four residues at the N- and C-terminal ends of Mfp-2. Surface binding studies of Mfp-2 using attenuated total reflectance Fourier transform infrared spectrometry showed the protein to be adsorbed rapidly to a variety of surfaces, but it was displaced effectively by Mfp-1 (17). In vitro, in the absence of protein cross-linkers such as tyrosinase, Mfp-2 exhibits little tendency for interaction with Mfp-1 (18).
FIGURE 1.
Byssal plaque proteins of Mytilus. A mussel (M. galloprovincialis, inset) is shown attached to a sheet of mica. One of its plaques (red circle) is enlarged as a schematic drawing to illustrate the approximate distribution of known proteins.
FIGURE 2.
Mfp-2. A, sequence is based on Mfp-2 from M. galloprovincialis (UniProtKB/Swiss-Prot entry Q25464) (13, 14). The 11 EGF repeats are aligned according to the invariant six cysteine residues/EGF. Tyrosine residues known to be occasionally or always modified to DOPA are denoted in bold. The boxed sequence in EGF repeat 7 is a calcium binding motif. Mfp-2 from M. edulis is 90% identical and is listed as (UniProtKB/Swiss-Prot entries Q1XBT6–Q1XBT8) but was never submitted as a published report. B, structure of one EGF domain based on Ref. 15, showing the cysteine residues paired for disulfides, charges, and location of the DOPA residues (*). Below the structure is a complete string of 11 EGF repeats showing the DOPA and acidic clusters.
To better understand the role of Mfp-2 in the byssal adhesive plaque, we tested its adhesion alone and in the presence of added cations and other MFPs using the surface forces apparatus (SFA). SFA is suited ideally to distinguish the proteins that coat surfaces from those that bridge from one surface to another, an important distinction in adhesion (9). Our studies show that Mfp-2 by itself coats mica but tends not to bridge between two mica surfaces. However, addition of Ca2+ and Fe3+ can mediate bridge formation between films of Mfp-2, and Mfp-2 can bind directly to Mfp-5 films. The strongest bridging between two adsorbed Mfp-2 films was induced by addition of low micromolar Fe3+. High resolution resonance Raman microprobe analysis of plaques supports the co-localization of iron and Mfp-2 and suggests that iron binding may be necessary for cohesion of Mfp-2 in plaque.
MATERIALS AND METHODS
MFP Purification from Mussel Feet
Blue mussel (Mytilus edulis L.) feet were obtained in 500-g flash-frozen lots from Northeast Transport of Union, Maine. Mussel foot proteins Mfp-1, Mfp-2, Mfp-3, and Mfp-5 were purified from frozen M. edulis feet according to published procedures (19–21) and are summarized in the supplemental Scheme S1. Sample purity was assessed by acid urea-PAGE, amino acid analysis, and MALDI time-of-flight mass spectrometry. The mol % DOPA in purified Mfp-1, Mfp-2, Mfp-3, and Mfp-5 was ∼12, ∼2, 22, and 28%, respectively, determined by amino acid analysis after a 1-h hydrolysis in 6 n HCl at 158 °C. Purified samples were freeze-dried, resuspended in 50 mm acetic acid, and thereafter divided into convenient aliquot volumes for storage in vials at −70 °C prior to testing. Low pH and protection from light were necessary to reduce DOPA losses during handling and storage. Milli-Q water (Millipore, Bedford, MA) was used for all glassware cleaning and solution preparation.
Force Versus Distance Profiles Measurement by the SFA
The SFA technique has been used for many years to measure both normal and lateral forces between surfaces in vapors and liquids, e.g. van der Waals forces, electrostatic forces, adhesion forces, friction and lubrication forces, hydrophobic interactions, and specific and nonspecific biological interactions (22–25). A diagram of the instrument and description of the underlying theory can be found in the supplemental “Materials and Methods.” SFA can measure accurately the normal (attractive adhesion or repulsive) forces F as low as 10 nanonewtons as a function of surface separation distance D with a resolution of <1 Å determined using multiple beam interferometry.
The normal force-distance profiles and adhesion forces (Fad) of Mfp-2 were determined using an SFA in a configuration reported previously (9). Briefly, a thin mica sheet of 1–5 μm was glued onto a cylindrical silica disk (radius, r = 2 cm). 100 μl of a stock Mfp-2 solution (20 μg/ml) diluted in 0.1 m sodium acetate with 0.25 m potassium nitrate at pH 5.5, was injected onto one mica surface. (Note that in SFA, potassium nitrate is used in place of NaCl to reduce chloride ion-induced corrosion of the semireflecting silver layers under the mica substrates. Salt concentration was adjusted to half that of salinity of seawater.)
For experiments with iron, 1 mm bis-tris was added to stabilize the solubility of Fe3+ (26). Although the test pH is significantly lower than seawater (pH 8.2), it was necessitated by the poor solubility of iron and the mussel proteins at higher pH in the SFA. The two curved and coated mica surfaces were then mounted in the SFA chamber in a crossed-cylinder geometry, which corresponds roughly to a sphere of radius R on a flat surface based on the Derjaguin approximation: F(D) = 2πRW(D), where F(D) is the force between the two curved surfaces, and W(D) is the interaction energy per unit area between two flat surfaces. The measured adhesion or “pull-off” force Fad is related to the adhesion energy per unit area Wad by Fad = 2πRWad for rigid (undeformable) surfaces with weakly adhesive interactions, and by Fad = 1.5πRWad (used in this study) for soft deformable surfaces with strong adhesive contact (27, 28). In a typical experiment, the separation distance D is monitored in situ using the fringes of equal chromatic order in multiple beam interferometry. All experiments were performed at room temperature (23 °C).
Protein film deposition to one or both mica surfaces was determined by whether asymmetric or symmetric testing was planned. In the asymmetric mode, protein was applied to one mica surface only. In contrast, protein was applied to both mica surfaces in symmetric mode.
Raman Spectroscopic Studies
Plaques from Mytilus galloprovincialis were embedded in PEG-2000 (Carl Roth Gmbh), and 20-μm thick longitudinal sections were microtomed. Plaque sections were washed thoroughly with several changes in distilled water to remove any remaining PEG, positioned on a quartz slide in distilled water and fixed under a quartz coverslip. For Raman microspectroscopy, a continuous laser beam was focused on the sample through a confocal Raman microscope (model CRM200, WITec, Ulm, Germany) equipped with a piezo scanner (model P-500, Physik Instrumente, Karlsruhe, Germany). The diode-pumped, 785-nm near-infrared laser excitation (Toptica Photonics AG, Graefelfing, Germany) was used in combination with a 100× oil immersed (Nikon, NA = 1.25) microscope objective. Laser power ranging between 15 and 30 milliwatts was used for all measurements. The spectra were acquired using an air-cooled charge-coupled device (DU401A-DR-DD, Andor, Belfast, North Ireland) behind a grating (300 g mm−1) spectrograph (Acton, Princeton Instruments Inc., Trenton, NJ) with a 6 cm−1 spectral resolution. Software ScanCtrlSpectroscopyPlus (version 1.38, Witec) was used for measurement setup. Raman spectra were processed and analyzed with Witec Project software (version 2.02). Raman spectra were background-subtracted and lightly smoothed using the first order polynomial function and 9-point Savitzky-Golay filter (4th order polynomial), respectively. More details on background subtraction are available in the supplemental “Materials and Methods.”
Color images were obtained from Witec Project software using the basis analysis and image color combination functions. In the case of basis analysis, the algorithm fits each spectrum of the multigraph data object with a linear combination of the basis spectra (tree spectra, see Fig. 9E) using the least squares method. To solve the problem of differing fluorescence background in various parts of the sample, the first derivative of both multigraph data object and basis spectra was performed. The weighting factors of various components obtained by fitting were stored in an image and combined in a false color bitmap using the image color combination function.
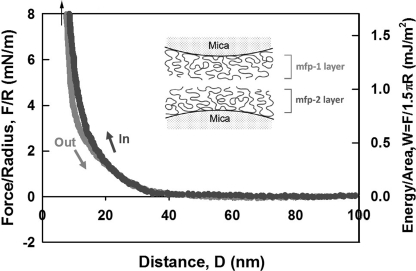
FIGURE 9.
Interaction between Mfp-1 and Mfp-2 films adsorbed to mica. Separation (out) following a brief contact. Prolonged contact did not improve adhesion. An arrow (top left) denotes a hard wall.
A purified solution of Mfp-2 (1 mg/ml) in 0.1 m sodium acetate with 0.25 m KNO3 and 1 mm bis-tris (pH 5.5) was mixed with a small volume of 1 mm FeCl3 in 10 mm bis-tris (pH 5.5) and equilibrated for 10 min. The added iron was adjusted to achieve DOPA:Fe3+ ratios of 2:1 and 20:1. The pH was then raised to ∼8.0 with 0.1 m NaOH, and a droplet of the solution was dried by evaporation on a glass slide. Raman spectra were taken of the protein-iron film at the edge of the film and of Mfp-2 solutions prior to iron complexation.
RESULTS
Self-interaction of Mfp-2
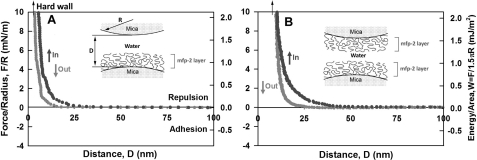
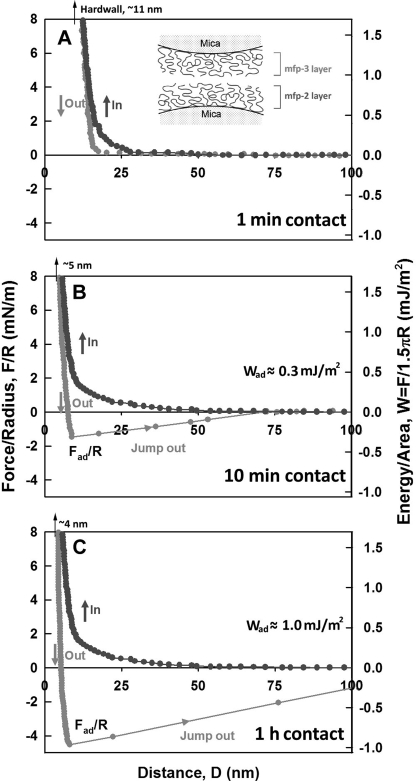
As the dominant plaque protein between the byssal thread and adhesive interface (14), Mfp-2 needs to be able to interact strongly with interfacial proteins at the substratum, with itself, and with various proteins within the mussel adhesive plaque (Fig. 1). We tested the adhesion of Mfp-2 to bare mica (asymmetric) and of two opposing Mfp-2 films on mica (symmetric) using the surface forces apparatus. The ability of Mfp-2 to coat or bridge on mica surfaces is revealed in the force-distance (F versus D) profile and by the repulsion associated with an initial approach to the “hard wall” followed by separation of the surfaces (note that the hard wall is defined as the mica-mica separation at which the thickness of the confined proteins becomes asymptotic with increased normal load or pressure). Adsorption of Mfp-2 to mica was confirmed by the hard wall distance shift from 5 to 10 nm evident from the fringes of equal chromatic order signal shift and shape changes as shown previously (9). No apparent adhesion was measured between Mfp-2 and bare mica, nor could adhesion be detected between two Mfp-2 films (Fig. 3, A and B). Even a 1-h contact time failed to induce adhesion in Mfp-2.
FIGURE 3.
Interaction between Mfp-2 films adsorbed to mica relative to their separation distance (D). A, (asymmetric) Mfp-2 adsorbed to one mica surface only; B, (symmetric) Mfp-2 adsorbed to both mica surfaces. Black, approach; gray, separation. The y axis on the left gives the measured force, F/R (normalized by the radius of the surface), whereas the y axis on the right gives the corresponding adhesion energy per unit area (W) between two flat surfaces, defined by W = F/1.5πR (27, 28). The hard wall corresponds to the thickness of the protein films and is indicated by an arrow (top left). Separation was after a brief (∼1–2 min) contact; interactions were unchanged by longer contacts.
Interaction of Mfp-2 with Ca2+ and Fe3+
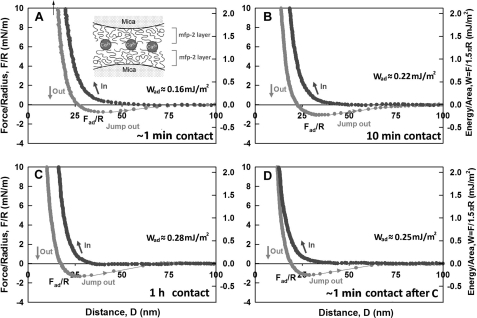
As significant levels of calcium and iron have been detected in byssal plaques (∼0.1% (w/w) (29)), it seemed appropriate to test the effect of these ions on Mfp-2 adhesion. Weak adhesion between two symmetric Mfp-2 coated surfaces occurred after adding 5 μm Ca2+ (Fig. 4A). Adhesion improved slightly to ∼0.28 mJ/m2 by increasing the contact time for Mfp-2 films (Fig. 4B). Ca2+-mediated bridging of Mfp-2 films was further subjected to five cycles of approach and separation without significant loss in adhesion energy (Fig. 4D).
FIGURE 4.
Influence of added Ca2+ (5 μm) on interaction between two symmetric Mfp-2 films adsorbed to mica. Contact times in A, B, and C were as shown. In D, another approach, brief contact, and separation was performed after C. Black, approach; gray, separation. The hard wall corresponds to the thickness of protein films and is denoted by an arrow (top left).
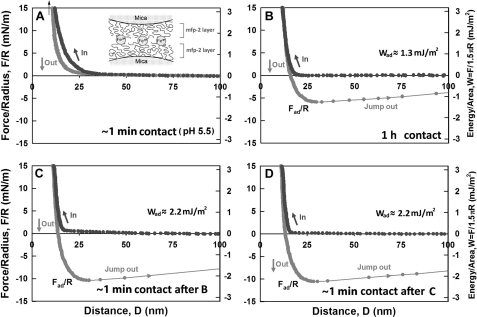
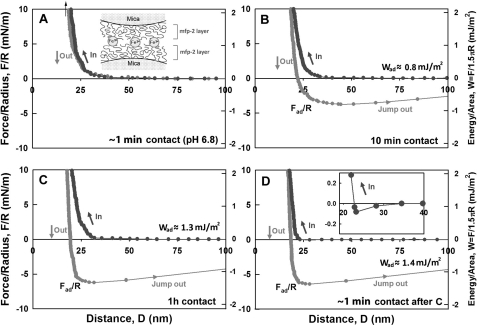
With respect to Fe3+, no adhesion was initially detected after introducing 5 μm Fe3+ between symmetric Mfp-2 films, but a longer contact time (∼1 h) resulted in significant adhesion (∼1.3 mJ/m2) (Fig. 5B). Reapproach and separation after breaking the 1-h contact produced the strongest observed adhesion (∼2.2 mJ/m2) in our studies (Fig. 5C). A reversible iron-mediated bridging of Mfp-2 is suggested by the instantaneous enhanced adhesion of subsequent approach-separation cycles. Studying the effect of pH on the iron-Mfp-2 interaction proved challenging because both iron and protein tend to precipitate at higher pH; however, it was possible to raise the pH to 6.8 (Fig. 6, A–D). Remarkably, adhesion remained the same, but the rate at which adhesion increased was faster (compare, for example, the similar asymptotic adhesion after 1 h at pH 5.5 and 6.8 in Figs. 5B and 6C, respectively). However, after 10 min at pH 6.8, adhesion was 70% complete (Fig. 6B), whereas at pH 5.5, adhesion was not yet detectable. Higher pH also affects the magnitude of adhesion after the 1-h separation and approach. At pH 6.8, it is only half that at 5.5 (Fig. 6D).
FIGURE 5.
Influence of added Fe3+ (5 μm) on the interaction between two symmetric Mfp-2 films adsorbed to mica. Contact times in A–D were as indicated. Black, approach; gray, separation. The hard wall corresponds to the thickness of protein films and is denoted by an arrow (top left).
FIGURE 6.
Influence of Fe3+ (5 μm) on the interaction between two symmetric Mfp-2 films on mica at pH 6.8. A, brief contact following iron addition; B, 10-min contact; C, 1-h contact; D, brief contact and separation after C; inset, zoom of approach highlights the persistent jump-in between 30 to 23 nm. Black, approach; gray, separation.
Interaction between Mfp-2 and Other MFPs
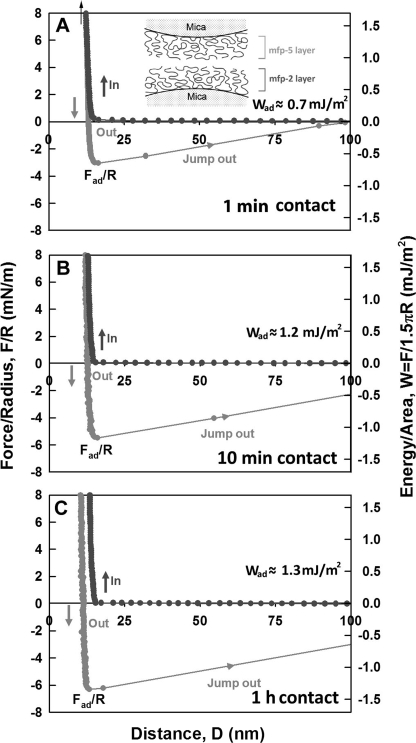
Mfp-3 and Mfp-5 are present in the plaque footprints presumably as surface primers and exhibit moderate adhesion to mica as well as other surface chemistries (9).5 We hypothesized that Mfp-2 should be able to adhere to either or both Mfp-3 and -5. In an asymmetric experiment, Mfp-2 was deposited on one mica face and a film of either Mfp-3 or Mfp-5 was formed on the other. Mfp-2 showed strong adhesion to Mfp-5 that took effect immediately and reached a maximum of 1.3 mJ/m2 after a 1-h contact (Fig. 7C). There was no change in the hard wall, suggesting that both films remain on the mica.
FIGURE 7.
Interaction between Mfp-5 and Mfp-2 films adsorbed to mica. Contact times were as shown in A–C. Black, approach; gray, separation. The hard wall corresponds to the thickness of protein films and is denoted by an arrow (top left).
In contrast, Mfp-2 showed no adhesion to Mfp-3 until after 10 min of contact, after which it increased to 1.0 mJ/m2 at 60 min. The observed hard wall at 10 and 60 min is only half that at 0 min, suggesting that the proteins are rearranging on the surface or that Mfp-2 is displaced by Mfp-3 (Fig. 8, A–C). To explore whether iron addition enhances adhesion between Mfp-2 and Mfp-3 or Mfp-5, we repeated the asymmetric experiments in the presence of these metal ions (5 μm), but no significant effects were detected (supplemental Figs. S2 and S3).
FIGURE 8.
Interaction between Mfp-3 and Mfp-2 films adsorbed to mica. Contact times were as shown in A–C. Black, approach; gray, separation. The hard wall corresponds to the thickness of protein films and is denoted by arrows (top left).
Consistent with a previous report, Mfp-1 did not exhibit bridging in our studies. Similarly, when Mfp-1 and Mfp-2 were asymmetrically coated on mica, a hard wall distance of 10 nm suggests the persistence of both films, but there was no adhesion between them (Fig. 9). Addition of 5 μm Fe3+ did not lead to detectable bridging.
Raman Spectroscopy on Mussel Byssal Plaque and Purified fp-2
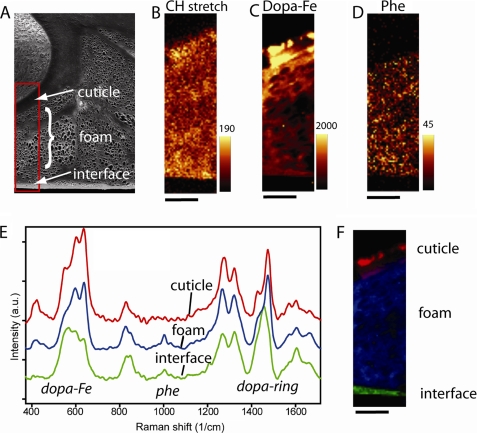
DOPA-iron coordination gives distinctive resonance Raman spectra that can be combined with confocal microscopy to localize DOPA-iron complexes in biomaterials (11). Different regions of the spectrum, namely CH stretching, Fe3+-DOPA complexation, and phenylalanine, were integrated after Raman imaging of a thin (20-μm) section of the byssal plaque (Fig. 10, A–D). Notably, DOPA-iron coordination (500–650 cm−1) is distributed throughout the plaque with highest intensity in the cuticle (Fig. 10C). Phenylalanine (1003 cm−1) is only prominent in the foam-like core (Fig. 10D). Average spectra were extracted from the different morphological regions of the plaque (cuticle, core, and interface) (Fig. 10E) and were fitted to the image (Fig. 10F). As expected, the plaque cuticle spectrum is essentially identical to the thread cuticle spectrum published previously (10). Spectra of the plaque core, however, deviate subtly from the cuticle in some respects: a) a sharp peak at 1003 cm−1 associated with Phe (30); b) several shifts and intensity changes in the region of DOPA-metal complex vibrations (500–650 cm−1); c) changes in intensity of tyrosine-related peaks in the region of 810–860 cm−1; and d) changes in the DOPA ring vibrations (1380–1520 cm−1). The Raman spectrum of the plaque-surface interface shows further differences from the core. The adhesive protein primers (Mfp-3 and Mfp-5) are located this region, which exhibits the lowest intensities for DOPA-iron complexes (Fig 10E, green trace).
FIGURE 10.
Imaging of a byssal adhesive plaque section. A, scanning electron micrograph of a sectioned byssal plaque from M. galloprovincialis. The boxed region was subjected to Raman microscopy. Raman images of the same region were integrated for CH-stretching (2850–3010 cm−1) (B), iron-DOPA (490–696 cm−1) (C), and phenylalanine (980–1020 cm−1) (D), respectively. E, average spectra of the three morphologically distinct domains in the plaque i.e. cuticle, core, and plaque-substrate interface. F, the distribution of these spectra is visualized through least square fitting. Scale bar below Raman images is 10 μm.
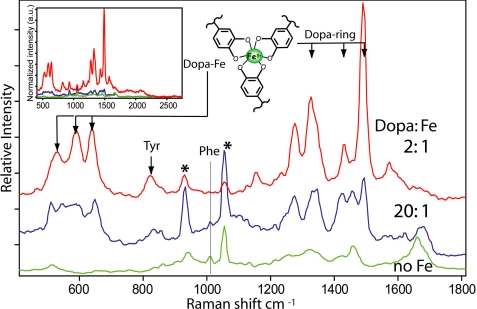
Mixtures of Fe3+ and purified Mfp-2 precipitated at pH ∼ 8 also showed a strong resonance Raman signal indicative of DOPA-iron coordination (Fig. 11 with the triscatecholato-iron structure). The Phe peak at 1003 cm−1 is easy to spot in the uncomplexed protein but is overwhelmed by resonance at 2:1 DOPA to iron. At 20:1 DOPA to iron, in contrast, with less developed resonance Raman, the Phe peak of Mfp-2 is clearly evident. Indeed, apart from the buffer artifact at 1060 cm−1, the 20:1 DOPA to iron spectrum of Mfp-2 is very similar to the Raman spectrum of the plaque. At 2:1 and 3:1 DOPA to iron ratios, the spectra of Mfp-2 closely resemble those of Mfp-1 following the same precipitation procedure (supplemental Fig. S4), but both differ significantly from spectra obtained from the plaque in situ.
FIGURE 11.
Relative Raman intensities for Mfp-2 with different admixtures of iron. No added Fe3+ (bottom) and with Fe3+ added at DOPA:iron ratios of 20:1 (middle) and 2:1 (top). Fe3+ was added to Mfp-2 at pH 5.5, after which the protein-iron complex was precipitated by raising the pH to 8. Tris-DOPA-iron complexes (as shown) are detected primarily by the ring and -O-iron resonances indicated (arrows). Excitation laser was at 532 nm. Inset spectrum shows actual intensities normalized to CH band (2850–3010 cm−1) to emphasize the Raman enhancement by resonance. a.u., arbitrary units.
DISCUSSION
There has been a long-standing challenge of how to best study protein-protein interactions in sclerotized biomaterials such as mussel byssal plaques. The protein precursors, although often quite abundant while stockpiled in secretory cells, become chemically modified following release by covalent and metal complexation-based cross-linking, which in turn leads to hardening. Traditional immunohistochemical localization of DOPA-containing proteins in a variety of sclerotized structures has proven useless due to the speed with which DOPA epitopes change following oxidation and metal binding (31–32).
In this study, we have explored two new approaches for insights relating to protein interactions in sclerotized structures: the Raman microscope and surface forces apparatus. Raman microscopy enables analysis of biological specimens for chemical functionalities, secondary structure, and orientational preference with a 1-μm spatial resolution, and the surface forces apparatus allows a facile means of quantifying interactions between polymers or between polymers and surfaces. By depositing paired polymer candidates on opposing mica surfaces, the strength of each pairwise interaction can be measured and compared. Given that byssal plaques adhere strongly to mica surfaces in seawater (9), mica is suitable as a support surface to which various MFPs can be adsorbed, and their interactions can be examined at salinities approaching seawater. pH 5.5 hardly resembles seawater pH (8.2), but it is a reasonable approximation for the intragranular pH of regulated protein secretion (33–34) and, as such, will resemble the pH of MFPs secreted onto a surface. Most of the MFPs and Fe3+ precipitate at pH ∼ 8; in addition, we observed in a previous study (3) that plaque footprints preserved the 20 mol % DOPA content of Mfp-3 notwithstanding the pH of the surrounding seawater. This would be possible only if the footprints were maintained at acidic pH or were full of antioxidants. Given the above factors, pH 5.5 was the most expedient for this study.
Mfp-2 is the most abundant protein in the attachment plaques of the mussel byssus and thus cannot afford to be a weak link in the structure. At the top of the plaque, it needs to interact with the scaffolding collagens (prepepsinized collagens) and associated matrix proteins that join the thread to the plaque (Fig. 1); at the bottom, Mfp-2 must bind to the priming proteins (Mfp-3 and/or Mfp-5) that secure the footprint of the plaque to foreign surfaces. An Mfp-2 film was incapable of adhering to bare mica (asymmetric). No improvement was obtained by coating both mica surfaces with Mfp-2 (symmetric). The results imply that Mfp-2 is not an adhesive protein, a result that resembles the behavior of Mfp-1, a protein known to function only as a coating in byssus (9, 11).
Given that iron and calcium are present in adhesive plaques at levels (∼0.1 w/w%) significantly above those of seawater (29), we explored the effect of adding Ca2+ and Fe3+ on adhesion between symmetric Mfp-2 films. Mfp-2 showed weak calcium-mediated adhesion consistent with electrostatic interactions, but the effect of ionic strength needs further scrutiny. Notwithstanding the high positive charge density and high pI of Mfp-2, there are clusters of negatively charged residues on EGF repeat 8 and at C and N termini (Fig. 2, A and B). These clusters would be repelled by the anionic mica surface and presumably serve as ligands for Ca2+ ions (Fig. 2). Separate from these, the seventh EGF repeat contains a calcium binding motif with a known consensus sequence Cys3-x-Asn-x-x-x-x-Tyr-x-Cys4 (35) having a micromolar binding constant (36).
Fe3+ increased adhesion by a factor of 5 to 7 times more than that of calcium during the separation of symmetric Mfp-2 films. Notably, the measured adhesion energy (Wad∼ Fad/1.5πR) was 2.2 mJ/m2, which approaches the 10 mJ/m2 energy measured for the strongest known noncovalent protein-ligand interaction, i.e. biotin-avidin (28).
Given the incremental coordination of Fe3+ by low molecular weight catechols (from one to three) with increasing pH (37), the prediction that the adhesion of iron bridging in Mfp-2 would increase with pH seemed reasonable, but there was no change. We suggest that in Mfp-2 as in Mfp-1, iron binding already has achieved the maximal tris-catecholate iron at pH 5.5 (38). Although complex stoichiometry is fixed at the 3:1 limit, its formation can be accelerated, and this is probably what we observed in the enhanced rate of adhesion (11, 38).
There is another pH-dependent result that merits scrutiny. The reduced adhesion post-1 h separation and reapproach at pH 6.8 (Fig. 6D) was half of that occurring at pH 5.5. Given the roughly 2-fold thicker hard wall at pH 6.8, the higher rate of complex formation may render the film more stiff and less compliant than at pH 5.5. The larger recovered adhesion at pH 5.5 may be stronger because the film can flow and rearrange to form new complexes, whereas at pH 6.8, it is more rigid.
The strength of adhesion in Mfp-2 is reminiscent of iron-induced adhesion of symmetric Mfp-1, which was attributed to formation of multiple catecholate iron complexes (11, 38). Curiously, even though all MFPs have DOPA, iron bridging seems MFP-specific; iron addition to asymmetric Mfp-2-Mfp-1 films had no effect. In this regard, it should be noted that there is no evidence that Mfp-1 and -2 make direct contact in the plaque. These results indicate that the intrinsically poor cohesion between Mfp-2 films, at least as measured by the SFA, can be overcome by the addition of metal ions.
Raman maps of plaque thin sections support a role for iron in setting. This conclusion was also proposed by Sever et al. (39) based on EPR analysis of plaques. Given the strong phenylalanine signal coupled with the Fe3+-catechol resonance signals localized in the plaque core, Mfp-2 is most likely the Fe3+ binding protein in this region. Mfp-2 has a significant Phe content (7–8 residues per protein), whereas Mfp-1, Mfp-3, and Mfp-5 have none. Indeed, at DOPA:iron ratios of 20:1, Mfp-2 and the plaque core have highly similar Raman spectra. The observed difference between the resonance spectra of the plaque cuticle and core probably reflects the effect of different protein/metal mixtures on the coordination environment. Mfp-2 and Mfp-1 are both capable of coordinating Fe3+, but the mussel apparently tunes the coordination chemistry and environment of the different proteins during processing by titrating the supply of iron to the precursors in the secretory granules.
The reliance of reversible Mfp-2-Mfp-2 interactions on two different metal ions Ca2+ and Fe3+ may be a fascinating example of a biological “safety net.” As the two binding sites are distinct, DOPA for iron and a specific binding motif for calcium, both may be present at any given interface. Assuming a parallel binding array, the stronger (iron-DOPA) may yield during a separation with a second weaker bridge (calcium binding) providing guidance for contact recovery. Notwithstanding that this model should be tested directly by SFA, a high initial stiffness and gradual post-yield recovery is generally observed in byssal threads under tension (40–41).
At the interface between the plaque and the foreign substratum, three MFPs have been detected, namely Mfp-3, Mfp-5, and Mfp-6 (2, 3). Of these, only Mfp-3 and Mfp-5 are known to be strongly adhesive (9).5 Indeed, Mfp-3 and Mfp-5 have inspired a wide range of DOPA-like synthetic adhesive polymers (e.g. 6). The interaction of Mfp-5 and Mfp-2 was instantaneous, very strong, and reversible. The binding functionalities for this protein-protein interaction are not at all clear at present. In contrast, the interaction between Mfp-2 and Mfp-3 is a very unconvincing one with no instantaneous adhesion. At this time, the best interpretation of the results is that Mfp-3 completely displaces Mfp-2 from one mica surface to become the only adhesive protein to span the mica sheets. Indeed, the time-dependent adhesion achieved between Mfp-3 and Mfp-2 is no different than with Mfp-3 alone (9). Presumably, binding to surface Mfp-3 is mediated by some other plaque protein(s).
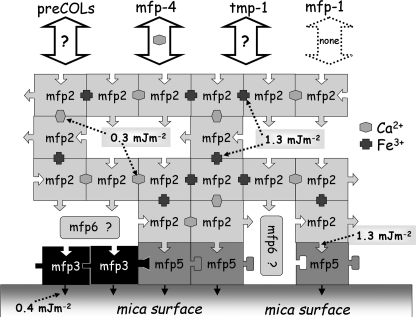
In summary, the interactions of Mfp-2 in the plaque are as follows (Fig. 12); Mfp-2 binds strongly to Mfp-5 at the interface and to other Mfp-2 proteins in the core in the presence of Fe3+ and/or Ca2+. Mfp-2 does not bind Mfp-1 nor apparently to Mfp-3; binding to Mfp-5 is not enhanced by adding iron. Other interactions remain to be investigated.
FIGURE 12.
Summary of protein interactions in the byssal plaque of Mytilus. Mfp-3 and -5 are strongly surface active (black arrows). Mfp-2 interacts directly with Mfp-5 and with itself in the presence of iron or calcium. There is no interaction with Mfp-1, and interactions with prepepsinized collagens (preCOLs), thread matrix protein-1 (tmp), and Mfp-4 remain to be determined. The numerical values denote specific adhesion energies at pH 5.5, and the value for the interaction between Mfp-3 and mica is from Ref. 9. Question mark denotes unknown interactions.
Supplementary Material
Acknowledgments
We thank C. J. Sun and E. Danner for partially purifying Mfp-2 and J. Yu and P. Fratzl for support.
This work was supported in part by National Institutes of Health Grant R01 DE018468 and National Science Foundation Materials Research Science and Engineering Center Grant DMR05-20415.

The on-line version of this article (available at http://www.jbc.org) contains supplemental “Materials and Methods,” Schemes S1–S3, Figs. S1–S3, and additional references.
H. Zeng, D. S. Hwang, and J. H. Waite, unpublished data.
- DOPA
- 3, 4-dihydroxyphenylalanine
- MFP
- mussel foot protein
- SFA
- surface forces apparatus
- bis-tris
- 2-[bis(2-hydroxyethyl)amino]-2-(hydroxymethyl)propane-1,3-diol.
REFERENCES
- 1.Waite J. H., Holten-Andersen N., Jewhurst S. A., Sun C. J. (2005) J. Adhesion 81, 297–317 [Google Scholar]
- 2.Zhao H., Robertson N. B., Jewhurst S. A., Waite J. H. (2006) J. Biol. Chem. 281, 11090–11096 [DOI] [PubMed] [Google Scholar]
- 3.Zhao H., Waite J. H. (2006) J. Biol. Chem. 281, 26150–29158 [DOI] [PubMed] [Google Scholar]
- 4.Lee H., Scherer N. F., Messersmith P. B. (2006) Proc. Natl. Acad. Sci. U.S.A. 103, 12999–13003 [DOI] [PMC free article] [PubMed] [Google Scholar]
- 5.Dalsin J. L., Lin L., Tosatti S., Vörös J., Textor M., Messersmith P. B. (2005) Langmuir 21, 640–646 [DOI] [PubMed] [Google Scholar]
- 6.Lee B. P., Chao C. Y., Nunalee F. N., Motan E., Shull K. R., Messersmith P. B. (2006) Macromolecules 39, 1740–1748 [Google Scholar]
- 7.Westwood G., Horton T. N., Wilker J. J. (2007) Macromolecules 40, 3960–3964 [Google Scholar]
- 8.Wang J., Tahir M. N., Kappl M., Tremel W., Metz N., Barz M., Theato P., Butt H. J. (2008) Advanced Materials 20, 3872–3876 [Google Scholar]
- 9.Lin Q., Gourdon D., Sun C., Holten-Andersen N., Anderson T. H., Waite J. H., Israelachvili J. N. (2007) Proc. Natl. Acad. Sci. U.S.A. 104, 3782–3786 [DOI] [PMC free article] [PubMed] [Google Scholar]
- 10.Sagert J., Waite J. H. (2009) J. Exp. Biol. 212, 2224–2236 [DOI] [PMC free article] [PubMed] [Google Scholar]
- 11.Harrington M. J., Masic A., Holten-Andersen N., Waite J. H., Fratzl P. (2010) Science 328, 216–220 [DOI] [PMC free article] [PubMed] [Google Scholar]
- 12.Holten-Andersen N., Mates T. E., Toprak M. S., Stucky G. D., Zok F. W., Waite J. H. (2009) Langmuir 25, 3323–3326 [DOI] [PMC free article] [PubMed] [Google Scholar]
- 13.Waite J. H., Qin X. X., Coyne K. J. (1998) Matrix Biol. 17, 93–106 [DOI] [PubMed] [Google Scholar]
- 14.Rzepecki L. M., Hansen K. M., Waite J. H. (1992) Biological Bulletin 183, 123–137 [DOI] [PubMed] [Google Scholar]
- 15.Inoue K., Takeuchi Y., Miki D., Odo S. (1995) J. Biol. Chem. 270, 6698–6701 [DOI] [PubMed] [Google Scholar]
- 16.Kohda D., Inagaki F. (1992) Biochemistry 31, 11928–11939 [DOI] [PubMed] [Google Scholar]
- 17.Suci P. A., Geesey G. G. (2001) Colloids Surf. 22B, 159–168 [DOI] [PubMed] [Google Scholar]
- 18.Fant C., Elwing H., Höök F. (2002) Biomacromolecules 3, 732–741 [DOI] [PubMed] [Google Scholar]
- 19.Waite J. H. (1995) Methods Enzymol. 258, 1–20 [DOI] [PubMed] [Google Scholar]
- 20.Waite J. H., Qin X.-X. (2001) Biochemistry 40, 2887–2893 [DOI] [PubMed] [Google Scholar]
- 21.Papov V. V., Diamond T. V., Biemann K., Waite J. H. (1995) J. Biol. Chem. 270, 20183–20192 [DOI] [PubMed] [Google Scholar]
- 22.Israelachvili J. N., Adams G. E. (1978) J. Chem. Soc. Faraday Trans. I 74, 975–1001 [Google Scholar]
- 23.Israelachvili J. N. (1987) Proc. Natl. Acad. Sci. U.S.A. 84, 4722–4724 [Google Scholar]
- 24.Israelachvili J. N., McGuiggan P. M. (1990) J. Mater. Res. 5, 2223–2231 [Google Scholar]
- 25.Israelachvili J. N. (1992) Intermolecular and Surface Forces, 2nd Ed., Academic Press, San Diego [Google Scholar]
- 26.Taylor S. W., Chase D. B., Emptage M. H., Nelson M. J., Waite J. H. (1996) Inorg. Chem. 35, 7572–7577 [Google Scholar]
- 27.Johnson K. L., Kendall K., Roberts A. D. (1971) Proc. R. Soc. London 324, 301–313 [Google Scholar]
- 28.Helm C. A., Knoll W., Israelachvili J. N. (1991) Proc. Natl. Acad. Sci. U.S.A. 88, 8169–8173 [DOI] [PMC free article] [PubMed] [Google Scholar]
- 29.Sun C., Waite J. H. (2005) J. Biol. Chem. 280, 39332–39336 [DOI] [PubMed] [Google Scholar]
- 30.Movasaghi Z., Rehman S., Rehman I. U. (2007) Appl. Spectrosc. Review 42, 493–541 [Google Scholar]
- 31.Anderson K. E., Waite J. H. (2000) J. Exp. Biol. 203, 3065–3076 [DOI] [PubMed] [Google Scholar]
- 32.Robinson M. W., Colhoun L. M., Fairweather I., Brennan G. P., Waite J. H. (2001) Parasitology 123, 509–518 [DOI] [PubMed] [Google Scholar]
- 33.De Young M. B., Nemeth E. F., Scarpa A. (1987) Arch. Biochem. Biophys. 254, 222–233 [DOI] [PubMed] [Google Scholar]
- 34.Njus D., Sehr P. A., Radda G. K., Ritchie G. A., Seeley P. J. (1978) Biochemistry 17, 4337–4343 [DOI] [PubMed] [Google Scholar]
- 35.Campbell I. D., Bork P. (1993) Curr. Opin. Struct. Biol. 3, 385–392 [Google Scholar]
- 36.Rand M. D., Lindblom A., Carlson J., Villoutreix B. O., Stenflo J. (1997) Protein Science 6, 2059–2071 [DOI] [PMC free article] [PubMed] [Google Scholar]
- 37.Avdeef A., Sofen S. R., Bregante T. L., Raymond K. N. (1978) J. Am. Chem. Soc. 100, 5362–5370 [Google Scholar]
- 38.Zeng H., Hwang D. S., Israelachvili J., Waite J. H. (2010) Proc. Natl. Acad. Sci. U.S.A., 10.1073/pnas.1007416107 [Google Scholar]
- 39.Sever M. J., Weisser J. T., Monahan J., Srinivasan S., Wilker J. J. (2004) Angew. Chem. Int. Ed. 43, 448–450 [DOI] [PubMed] [Google Scholar]
- 40.Harrington M. J., Waite J. H. (2007) J. Exp. Biol. 210, 4307–4318 [DOI] [PubMed] [Google Scholar]
- 41.Carrington E., Gosline J. M. (2004) American Malacological Bulletin 18, 135–142 [Google Scholar]
Associated Data
This section collects any data citations, data availability statements, or supplementary materials included in this article.


