

Abstract
Objective
This study addressed the hypothesis that variation in genes associated with dopamine function (SLC6A3, DRD2, DRD4), serotonin function (SLC6A4), and regulation of monoamine levels (MAOA) may be predictive of BMI categories (obese and overweight + obese) in young adulthood and of changes in BMI as adolescents transition into young adulthood. Interactions with gender and race/ethnicity were also examined.
Research Methods and Procedures
Participants were a subsample of individuals from The National Longitudinal Study of Adolescent Health (Add Health), a nationally representative sample of adolescents followed from 1995 to 2002. The sample analyzed included a subset of 1584 unrelated individuals with genotype data. Multiple logistic regressions were conducted to evaluate associations between genotypes and obesity (BMI > 29.9) or overweight + obese combined (BMI > 25) with normal weight (BMI = 18.5–24.9) as a referent. Linear regression models were used examine change in BMI from adolescence to young adulthood.
Results
Significant associations were found between SLC6A4 5HTTLPR and categories of BMI, and between MAOA promoter VNTR among males and categories of BMI. Stratified analyses revealed that the association between these two genes and excess BMI was significant for males overall, and for White and Hispanic males specifically. Linear regression models indicated a significant effect of SLC6A4 5HTTLPR on change in BMI from adolescence to young adulthood.
Discussion
Our findings lend further support to the involvement of genes implicated in dopamine and serotonin regulation on energy balance.
Keywords: Adolescents, Genetic Epidemiology, Serotonin, Neuro Transmitter
INTRODUCTION
Obesity increases the risk for a number of serious health conditions including cardiovascular disease, stroke, diabetes, and some cancers (1, 2). Thus, the identification of biological, psychological, environmental, social, and genetic factors that interact to influence overweight and obesity is of high importance (3). Although the causes of obesity in society are numerous, at the individual level genetics is thought to play an important role in regulating energy balance and the development of obesity (4). Both twin and family studies suggest that obesity is influenced by genetic factors (5–7) and several candidate genes have been associated with obesity-related phenotypes. The 2005 Human Obesity Gene Map reported that 127 candidate genes have been found to be significantly associated with obesity-related phenotypes across 416 studies (8). Yet, the number of genes found to be consistently associated with obesity-related phenotypes across these studies (n = 22) is much smaller. An emerging area of research has begun to explore the potential association between specific candidate genes regulating brain serotonin and dopamine systems with obesity. These neurotransmitter systems are hypothesized to regulate behavioral and metabolic responses associated with the development of obesity through feeding and satiety (9).
Converging evidence suggests that dopaminergic neurotransmission regulates feeding behaviors in humans (10–12) and is associated with higher body mass index (BMI) (13). Candidate gene studies of dopamine related genes have focused on the DRD2 (dopamine receptor D2), DRD4 (dopamine receptor D4), and SLC6A3 (solute carrier family 6–neurotransmitter transporter, dopamine- member 3) genes. Findings from studies of DRD2 have been mixed with some studies detecting an association with obesity-related phenotypes (14–18), whereas others report no association (19–23). At least two studies of DRD4 have shown an association between higher BMI and carriers of the 7 repeat allele found in the third exon of the gene (24, 25). One of these studies suggested that the association was influenced by race, as it was present among African-Americans and Hispanics, but not American Whites (24). Finally, two studies of current smokers have reported an association between SLC6A3 and the phenotypes of obesity (20) and food reinforcement (26). Thus, there is increasing evidence that the dopaminergic system may indeed be involved in obesity-related phenotypes.
Serotonergic functioning has also been hypothesized to be important for regulating eating behaviors and body weight (27, 28). For instance, administration of serotonergic agents have been shown to suppress eating behaviors (29, 30) and reduce craving for high carbohydrate foods (31). Candidate gene studies of the serotonergic system have examined the amino acid transporter gene and the serotonin receptor and transporter genes. At least two studies have indicated a relationship between the solute carrier family 6 member 14 (SLC6A14) gene and obesity related phenotypes (32, 33). This gene is relevant to serotonin signaling as it is associated with tryptophan availability for serotonin synthesis. An association has been found between a polymorphism of the serotonin receptor 2A locus (HTR2A -1438A>G) and higher levels of abdominal obesity and Body Mass Index (BMI) among adults (34, 35) and increased energy and fat intake in children (36). There is an additional support for this polymorphism being involved in energy balance in overweight adult subjects (37). However, one subsequent study failed to detect an association with this polymorphism and obesity in children, though the study was underpowered (38). Fewer studies have examined serotonin transport gene with the exception of a recent study of Argentinean adolescents which found an association between a polymorphism of the serotonin transporter SLC6A4 and overweight (39).
The monomine oxidase A (MAOA) gene produces an enzyme that metabolizes dopamine and serotonin (in addition to noradrenaline) and it has also been examined for association with obesity phenotypes. In a large U.K. cohort (n=1,150) of Caucasian females, significant associations were detected between MAOA and BMI, with the low-activity genotype (3/3) being more frequent among obese females (40). This finding supports a family-based study in which preferential transmission of the low activity related allele was observed among subjects with BMI >= 35 kg/m2 (41).
Although the possible association between genes regulating dopamine and serotonin with obesity is promising, the relevance is uncertain with respect to population level effects. This is because many studies are derived from clinical or convenience samples making it difficult to extrapolate to general populations. Therefore, replication studies in population-based cohorts are clearly warranted (42). Using a large population-based cohort of young adults we addressed the hypothesis that variation in genes associated with dopamine function (SLC6A3, DRD2, DRD4), serotonin function (SLC6A4), and regulation of monoamine levels (MAOA) may be predictive of BMI categories (obese and overweight + obese) in young adulthood, as well as predictive of changes in BMI as adolescents transition into young adulthood. Since studies have shown that gender can affect both feeding (43) and addictive behaviors (44) and allelic frequency of these genes (45) and expression (46) vary by ethnic/racial ancestry, we further evaluated gene by gender and gene by race interactions. To examine the factors driving interaction effects, we followed significant effects with stratified analyses when sample size permitted.
METHODS
Data source
The study population was 20,745 adolescents from the National Longitudinal Study of Adolescent Health (Add Health), a nationally representative study of adolescents. The longitudinal cohort includes 15,197 eligible respondents who completed inhome surveys on three separate occasions (April to December, 1995, April to August, 1996, and August 2001 to August 2002). The mean age of survey participants in the three waves of data collection was 15.65 (SD = 1.75) years, 16.22 (SD = 1.64) years, and 22.96 (SD = 1.77) years. All survey participants at Wave III were 18 years of age or older. By design, the Add Health survey included a sample stratified by region, urbanicity, school type, ethnic mix, and size to garner a nationally representative sample. Precise details regarding the design and data collection have been described elsewhere (47, 48).
Study Sample
At Wave III, a subset of individuals identified to be full siblings or twins at earlier waves (n = 3,787) consented to provide a saliva sample for DNA analysis. The study conformed to local institutional review board (IRB) approved procedures (further details can be obtained at www.cpc.unc.edu/projects/addhealth). For our analyses we included only unrelated individuals by randomly selecting one sibling from each sibship. Participants who were pregnant were excluded from analysis (n=51). For the analyses comparing normal weight individuals (defined as Body Mass Index [BMI] between 18.5 and 25) to obese individuals (BMI > 30) the total available sample included 1133 individuals. For the analyses comparing normal weight individuals to overweight and obese individuals (BMI > 25) the total available sample included 1584 individuals. Genotype was missing for one or more of the genetic markers for some individuals which resulted in variability in the total number of individuals available for each genespecific analysis.
Genotyping
Buccal samples were collected on the participants and DNA extracted using a modification of procedures previously described (49–52) (further details at www.cpc.unc.edu/projects/addhealth). Six functional polymorphisms were genotyped within six candidate genes that had been previously associated with behavioral and psychological outcomes. The following were genotyped according to previously described procedures (53, 54): a 40 basepair (bp) VNTR polymorphism in the 3′ untranslated region (UTR) of the dopamine transporter (SLC6A3), a 44 bp insertion/deletion polymorphism (5HTTLPR) in the promoter of the serotonin transporter (SLC6A4), the Taq1A DRD2 polymorphism (DRD2), a 48 bp VNTR in exon 3 of the dopamine D4 receptor (DRD4), and a 30 bp VNTR in the promoter of the monoamine oxidase A (MAOA) gene. The T479A substitution in the CYP2A6 gene, associated with nicotine metabolism, was also genotyped in the same DNA samples, but this genotype data was not used in this study.
The genotypes were tested for deviations from Hardy Weinberg Equilibrium (HWE). Deviations from HWE could indicate either a problem with the genotyping assay, or a true association with an outcome. To examine the second hypothesis, we tested for deviations from HWE in the overall data set, in the normal weight subset, the obese subset and the obese/overweight subset.
Body Mass Index
BMI was calculated based on height and weight (BMI = weight in kilograms/height in meters2) measured by Add Health staff during the in-home interviews at Wave II and Wave III. Height and weight were self-reported at Wave I and thus, analyses of BMI were restricted to Wave II and III.
Sociodemographic variables
Covariates included indicators of socioeconomic status (e.g., parental reported education reported by parents at Wave I), chronological age of participant at Wave III, and self-identified race/ethnicity. American Indians and Asians were excluded from the analyses because they were underrepresented in the available data. Thus, our analyses only included American Whites, African-Americans, and Hispanics.
Statistical Analysis
Statistical analyses were conducted using SAS-callable SUDAAN (version 8.0) statistical software (55). SUDAAN allows for control of survey design effects of individuals clustered in sampling unit of school and stratification of geographic region. The specific genotypes were grouped for analysis according to the extant literature with these candidate genes (56, 57). MAOA, which is located at chromosome Xp11.23, was stratified on gender. Two separate sets of multiple logistic regressions were conducted. In the first, regression was used to identify the variables which predicted obesity (BMI > 29.9) using normal weight (BMI = 18.5–24.9) as a referent in order to identify genetic factors associated with the highest level of risk. In the second, regression was used to predict overweight + obese combined (BMI > 25). This approach allowed for the identification of any risk factors associated with above normal weight. Participants who were underweight (< 18.5; n = 47) were excluded. Each polymorphism was evaluated separately. Models included the interaction between the allele and either sex or race/ethnicity. Age, race, and parental education level were included as covariates. To clarify the interpretation of significant interaction effects, stratified analyses were conducted and odds ratios were calculated when samples sizes permitted. For stratified analyses where fewer than 5 individuals were represented in a genotype category, the CLUMP program (58) was used with 10,000 simulations to further verify a significant departure of observed values from expected values.
Linear regression models were used to examine the change in BMI from Wave II to Wave III. Although Add Health did collect information regarding height and weight at Wave I (one year prior to Wave II), the information was based on self-report. Thus, to reduce potential bias, a conservative approach was taken by only looking at the change from Wave II to Wave III where height and weight were measured by study staff. The outcome measure for these analyses was based on a raw score change in BMI (as opposed to a z-score change) as has been recommended by Cole, Faith, Pietrobelli, and Heo (59), and by Berkey and Colditz (2006) (60). Models included age, sex, self-reported race/ethnicity, and parental education as covariates.
RESULTS
Table 1 displays the overall socio-demographics by BMI category (normal weight vs. obese vs. overweight + obese). Bivariate chi square analyses revealed significant differences among BMI category for race/ethnicity, parental education and age (p < .05), and a trend for gender (normal vs. overweight + obese, p = .07). Table 2 describes genotype frequencies overall and by BMI categories included in the analyses. Genotype distributions in the normal weight BMI strata exhibited HWE (all Ps > .05). However, the genotype distributions in the obese BMI strata deviated from HWE for the SLC6A4 marker (p=0.02). Similarly, the genotype distributions in the overweight + obese BMI strata also deviated from HWE for the SLC6A4 marker (p=0.009). Since the genotype distributions in the larger, all inclusive data set generally met HWE, we do not believe that genotyping errors contributed to the deviations from HWE that we observed in the obese and overweight + obese strata.
Table 1.
Gender, Ethnicity, Parental Education, and Age by Normal Weight, Obese, and Overweight + Obese.
| Normal Weight | Obese | Overweight + Obese | ||||
|---|---|---|---|---|---|---|
| N | % | N | % | N | % | |
| Total | 751 | 382 | 833 | |||
| Gender | ||||||
| Male | 350 | 46.61 | 167 | 43.72 | 424 | 50.90 |
| Female | 401 | 53.39 | 215 | 56.28 | 409 | 49.10 |
| Ethnicity | ||||||
| White | 523 | 69.64 | 232 | 60.73* | 524 | 62.90† |
| Black | 139 | 18.51 | 67 | 17.53 | 145 | 17.41 |
| Hispanic | 89 | 11.85 | 83 | 21.72 | 164 | 19.69 |
| Parental Education Level | ||||||
| Less Than High School | 59 | 7.85 | 57 | 14.92* | 102 | 12.24† |
| High School or Equivalent | 146 | 19.44 | 117 | 30.63 | 232 | 27.85 |
| Some College | 202 | 26.90 | 87 | 22.77 | 219 | 26.29 |
| Collegeor Higher | 259 | 34.49 | 76 | 19.90 | 190 | 22.81 |
| Age | Mean | SD | Mean | SD | Mean | SD |
| 21.18 | 0.14 | 22.18‡ | 0.13 | 22.05§ | 0.13 | |
Normal Weight = BMI 18.5–24.9; Obese = BMI >29.9; Overweight or Obese = BMI >25
Significant X2 comparison between obese vs. normal weight (p < .05)
Significant X2 comparison between overweight + obese vs. normal weight (p < .05)
Significant t-tests between obese vs. normal weight (p < .05)
Significant t-tests between overweight + obese vs. normal weight (p < .05)
Table 2.
Overall Genotype Frequencies and Frequencies by Normal Weight, Obese, and Overweight + Obese.
| Total | Normal Weight | Obese | Overweight + Obese | |||||
|---|---|---|---|---|---|---|---|---|
| N | f | N | f | N | f | N | f | |
| DAT | ||||||||
| any 9 | 599 | 39.20 | 287 | 39.75 | 143 | 38.54 | 312 | 38.71 |
| 10/10 | 929 | 60.80 | 435 | 60.25 | 228 | 61.46 | 494 | 61.29 |
| SLC6A4 | ||||||||
| s/s | 273 | 17.34 | 111 | 14.84 | 79 | 20.79 | 162 | 19.61 |
| s/l | 733 | 46.57 | 368 | 49.20 | 164 | 43.16 | 365 | 44.19 |
| l/l | 568 | 36.09 | 269 | 35.96 | 137 | 36.05 | 299 | 36.20 |
| DRD2 | ||||||||
| A1/A1 or A1/A2 | 700 | 44.44 | 323 | 43.36 | 179 | 46.98 | 377 | 45.42 |
| A2/A2 | 875 | 55.56 | 422 | 56.64 | 202 | 53.02 | 453 | 54.58 |
| DRD4 | ||||||||
| At least one 7 allele | 613 | 38.90 | 295 | 39.49 | 139 | 36.58 | 318 | 38.36 |
| No 7allele | 963 | 61.10 | 452 | 60.51 | 241 | 63.42 | 511 | 61.64 |
| MAOA (Males) | ||||||||
| Low Activity | 314 | 40.94 | 133 | 38.33 | 76 | 45.78 | 181 | 43.10 |
| Both Active | 453 | 59.06 | 214 | 61.67 | 90 | 54.22 | 239 | 56.90 |
| MAOA (Females) | ||||||||
| Low Activity | 474 | 59.10 | 231 | 58.33 | 138 | 64.49 | 243 | 59.85 |
| Both Active | 328 | 40.90 | 165 | 41.67 | 76 | 35.51 | 163 | 40.15 |
Normal Weight = BMI 18.5–24.9; Obese = BMI >29.9; Overweight or Obese = BMI >25
The association between genotypes and obesity and overweight + obese can be viewed in Table 3. No associations with obesity or overweight + obese were found for polymorphisms in SLC6A3, DRD2, DRD4, or MAOA (females). Among males, the MAOA polymorphism was found to be associated with obesity and with overweight + obese. Among males, the prevalence of obesity and overweight + obese was significantly higher among carriers of the low activity variant of MAOA. Also among males a significant gene by race/ethnicity interaction was observed for MAOA for the normal vs. overweight + obese comparison (Table 4). The association between the low activity variant and the overweight + obese category was significant for Whites and Hispanics, but not for African-Americans.
Table 3.
OR, CI, and p-values for Main Effects Models* and Sex and Ethnicity Interactions
| Normal vs. Obese | Normal vs. Overweight + Obese | ||||||
|---|---|---|---|---|---|---|---|
| OR | CI | p | OR | CI | p | ||
| DAT | any 9 vs 10/10 | 0.99 | 0.73–1.35 | ns | 0.96 | 0.74–1.23 | ns |
| DAT × Sex | ns | ns | |||||
| DAT × Ethnicity | ns | ns | |||||
| DRD2 | any A1 vs A2/A2 | 1.06 | 0.81–1.36 | ns | 1.00 | 0.81–1.25 | ns |
| DRD2 × Sex | ns | ns | |||||
| DRD2 × Ethnicity | ns | ns | |||||
| DRD4 | one 7 vs. no 7 | 0.79 | 0.58–1.07 | ns | 0.91 | 0.72–1.14 | ns |
| DRD4 × Sex | ns | ns | |||||
| DRD4 × Ethnicity | ns | ns | |||||
| MAOA | |||||||
| Females | Low Activity vs. Both Active | 1.00 | 0.69–1.41 | ns | 0.93 | 0.68–1.27 | ns |
| MAOA × Ethnicity | ns | ns | |||||
| Males | Low Activity vs. Both Active | 1.85 | 1.18–2.94 | 0.008 | 1.41 | 1.01–1.92 | 0.04 |
| MAOA × Ethnicity | ns | 0.04 | |||||
| SLC6A4 | Main Effect of SLCA4† | 0.036 | 0.04 | ||||
| s/s vs. l/l | 1.31 | 0.84–2.04 | ns | 1.21 | 0.85–1.71 | ns | |
| l/l vs s/l | 1.32 | 0.93–1.85 | ns | 1.23 | 0.96–1.59 | ns | |
| s/s vs. s/l | 1.72 | 1.10–2.70 | 0.02 | 1.49 | 1.05–2.13 | 0.02 | |
| SLC6A4 × Sex | 0.048 | 0.0149 | |||||
| SLC6A4 × Ethnicity | 0.005 | 0.008 | |||||
All main effects models adjusted for sex, race, age, parental education level.
Indicates p-value for main effect of gene in model not including interaction terms.
Table 4.
OR, CI, and p-values for Stratified Analyses Based on Significant Interaction Effects
| Normal vs. Obese |
Normal vs. Overweight + Obese |
|||||
|---|---|---|---|---|---|---|
| OR | CI | p | OR | CI | p | |
| SLC6A4 | ||||||
| Males | ||||||
| s/s vs. l/l | 1.84 | 0.98–3.48 | ns* | 1.69 | 1.03–2.78 | 0.04 |
| l/l vs. s/l | 1.16 | 0.68–1.97 | ns | 1.00 | 0.71–1.42 | ns |
| s/s vs. s/l | 2.14 | 1.21–3.80 | 0.01 | 1.69 | 1.08–2.66 | 0.02 |
| White Males | ||||||
| s/s vs. l/l | 1.14 | 0.57–2.29 | ns | 1.37 | 0.76–2.45 | ns |
| l/l vs. s/l | 2.64 | 1.62–4.29 | 0.0002 | 1.47 | 1.05–2.05 | 0.02 |
| s/s vs. s/l | 3.00 | 1.49–6.05 | 0.006 | 2.01 | 1.16–3.49 | 0.01 |
| Hispanic Males | ||||||
| s/s vs. l/l | 21.35 | 1.32–144.5 | 0.0001 | 5.76 | 1.85–17.87 | 0.0007 |
| l/l vs. s/l | 0.08 | 0.01–0.48 | 0.0006 | 0.24 | 0.10–0.60 | 0.002 |
| s/s vs. s/l | 1.66 | 0.50–5.52 | ns | 1.41 | 0.47–4.16 | ns |
| MAOA (males) | ||||||
| White | ||||||
| Low Activity vs. Both Active | ns† | 1.42 | 1.00–1.99 | 0.04 | ||
| Hispanic | ||||||
| Low Activity vs. Both Active | ns | 3.68 | 1.47–9.18 | 0.002 | ||
p-value approached significance p=0.06
nonsignificant interaction effect, thus stratified analyses not computed.
A significant main effect for the 5HTTLPR polymorphism in the SLC6A4 gene was also observed (Table 3). The prevalence of obesity and overweight + obese combined was significantly lower among carriers of the l variant compared with individuals homozygous for the s variant. Significant gene by gender interaction revealed that this pattern of greater obesity and overweight + obesity among carriers of the s/s variant was significant for males, but not females (see Table 4). Significant gene by race/ethnicity interactions were also observed for White male homozygotes of either allele of the 5HTTLPR polymorphism, which were overrepresented in the obese and overweight + obese BMI categories (see Table 4). The pattern was somewhat different for Hispanic males where s/s homozygotes or s/l heterozygotes were overrepresented in the obese and overweight + obese BMI categories (see Table 4). As can be seen in Table 4, the confidence intervals for the association between the SLC6A4 gene and obesity and overweight + obesity are wide when the analysis is restricted to Hispanic males, indicating small cell counts for these comparisons. To further verify a significant departure of observed values from expected values the CLUMP (58) program was applied to this subset. The permutation analyses indicated that the genotype frequencies among obese and overweight + obese combined differed significantly in comparison to those in the normal weight group (Table 5). Also note that, as described above, the SLC6A4 polymorphism significantly deviated from HWE in the obese and overweight + obese strata, and this was confined to the non-Hispanic white ethnic group which was the largest ethnic sample.
Table 5.
SLC6A4 genotype frequencies differed between BMI categories for Hispanic males, with the obese and overweight group showing an excess of the s/s and s/l genotypes.
| Gene | Genotype | Normal | Obese | X2 value* | p | Overweight + Obese | X2 value* | p |
|---|---|---|---|---|---|---|---|---|
| SLC6A4 | s/s | 9 | 15 | 10.47 | 0.0028 | 30 | 6.47 | 0.023 |
| s/l | 19 | 26 | 50 | |||||
| l/l | 13 | 2 | 12 | |||||
| Total | 41 | 43 | 92 |
Calculated using CLUMP (Sham & Curtis, 1995)
Analyses also examined change in BMI from Wave II, when participants were on average 16.5 years of age, to Wave III, when participant were on average 22 years of age. The only polymorphism that was significantly associated with change in BMI was the 5HTTLPR polymorphism at the SLC6A4 gene (Table 6). 5HTTLPR s/s homozygotes demonstrated the greatest change in BMI from Wave II to Wave III, an average increase of 4.1 BMI units, compared to an increase of an average 3.5 BMI units among l/l homozygotes and 3.4 BMI units among s/l heterozygotes (Table 6 and Figure 1). A trend, although not significant, between the DRD4 Ex3 VNTR and change in BMI was observed (carriers of at least one 7 repeat allele demonstrated a mean change of 3.36, where as carriers who did not possess any 7 repeat allele demonstrated a mean change of 3.66, p = .07).
Table 6.
Results of Multiple Regression Model* Examining the Association between SLC6A4 and Change in BMI from Wave II to Wave III † and Least Square Means for Genotype
| beta | se (beta) | CI (beta) | Genotype | LS Means | LS Mean Contrasts | significance | |
|---|---|---|---|---|---|---|---|
| intercept | 4.03 | 0.32 | 3.39, 4.68 | ||||
| s/s vs. l/l | 0.54 | 0.27 | 0.01, 1.07 | s/s | 4.06 | s/s vs. l/l | 0.047 |
| s/l vs. l/l - | 0.17 | 0.22 | −0.61, 0.27 | s/l | 3.35 | s/l vs. l/l | ns |
| s/s vs. s/l | referent | l/l | 3.52 | s/s vs. s/l | 0.02 | ||
Model adjusted for race/ethnicity, age, sex, and parental education level.
Change based on differences score; Gene × sex and gene × ethnicity interactions not significant
Figure 1.
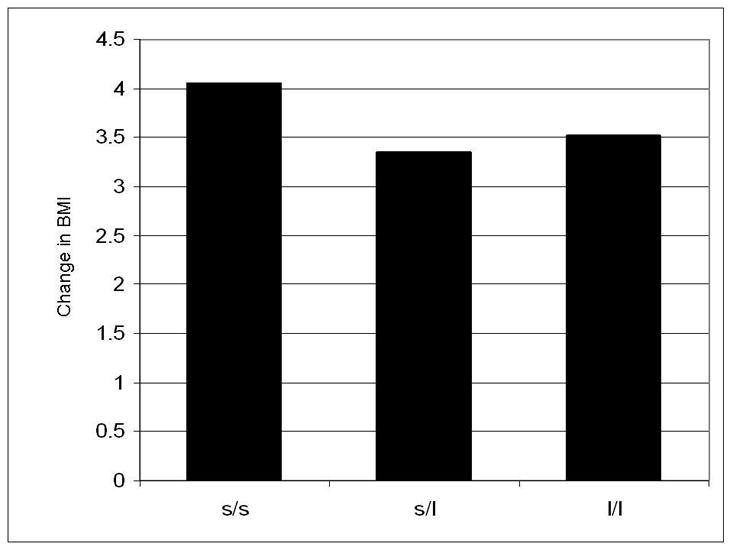
Change in BMI from adolescence to young adulthood as a function of the 5HTTLPR polymorphisms at the SLC6A4 gene
DISCUSSION
The primary findings of this study are significant associations between the SLC6A4 5HTTLPR and categories of BMI, and between the MAOA promoter VNTR and categories of BMI among males. These associations were found controlling for other factors (gender, race/ethnicity, age, and parental education). A significant interaction effect was found for the association between these genes and BMI by both race/ethnicity and gender. The subsequent stratified analyses revealed that the association between SLC6A4 and excess BMI was significant for males overall, and for White and Hispanic males. SLC6A4 5HTTLPR genotypes were found to deviate from HWE in the cases (obese and overweight + obese) but not the controls (normal BMI), with the ss homozygote genotype found in excess of expectation. Stratified analyses for MAOA among males indicated that the promoter VNTR was significantly associated with overweight + obese in White and in Hispanic males, as well.
A unique contribution of this study is a previously unreported association between obesity and candidate gene SLC6A4 in a U.S. population-based sample. The findings of our study confirm findings from a recently published study demonstrating an association between the s allele of the SLC6A4 5HTTLPR polymorphism and overweight among a sample of Argentinean children and adolescents (61). They also extend these findings by providing evidence for association between overweight + obesity and the s allele 5HTTLPR homozygote in males of Caucasian race and Hispanic ethnicity. The present findings regarding the association between SLC6A4 and BMI categories are consistent with the putative role of serotonin on food craving and obesity (28, 62) and the direction of the results are also consistent with the hypothesized expression effects of the 5HTTLPR polymorphism. The s allele is believed to reduce the transcriptional activity of the promoter (63) and is associated with less serotonin transporter protein (63, 64). An association between anxiety-related traits with a polymorphism in the serotonin transporter gene regulatory region has been noted (63). Thus, one potential hypothesis for the association between this gene and obesity may be a mediating effect of increased dietary intake as a means of affect regulation.
Further, the findings of this study regarding an association between MAOA and BMI are interesting in light of one family-based study (41) and two recent large-scale association studies (40, 65). Using the transmission disequilibrium test, evaluating the degree to which parents transmit this gene to their obese offspring, Camarena et al., (2004) found the low active variant to be associated with obesity (41). Extending this in a large population-based study, Need et al., (2006) (40) found that European Caucasian women (Mean age = 47 years) carriers of the low active variant were significantly more likely to be obese (BMI > 30). Ducci et al., (2006) found a significant association between BMI and MAOA genotype, with the low-activity allele associated with a higher BMI among a sample of primarily non-obese male participants with and without a history of alcohol dependence (65).
Our findings indicated some interesting potential gender effects. Gene by gender interactions indicated the relationship between gene (specifically, SLC6A4 and MAOA) and overweight or overweight + obese were significant for males. Need et al. observed an association between MAOA and categories of BMI among their female sample, whereas no association between MAOA and categories of BMI was noted in our sample of females. This may reflect an age related effect, as the mean age of women in our study was much younger (mean age of 22 years in our study vs. mean age of 48 in Need et al. study). Expression of MAOA is affected by ovarian hormones which can fluctuate with age (66). It has been shown that ovarian steroids, particularly estrogen, can decrease MAOA expression, resulting in elevated serotonin levels (66, 67). The degree to which these potential age-related effects represent a true effect will need to be verified in other samples with a wider age range.
Dopamine has been associated with the reinforcement value of food (68, 69) and variation in dopaminergic activity in the brain has been associated with obesity (13). The association of the MAOA low activity VNTR variant and increased BMI from this study would be consistent, in part, with these observations since MAOA is implicated in dopamine metabolism (40). However, we did not find that polymorphisms in the dopamine D2 and D4 receptors and the dopamine transporter were statistically significantly associated with BMI categories in this young adult sample. It is unlikely that these null results for the main effects models are a result of low statistical power, as many of the cell counts in these models for these dopamine related genes were of sufficient size and much larger than studies to date. Nevertheless, there are several possible explanations. First, candidate gene studies of the TaqI A polymorphism at the D2 dopamine receptor gene have not been completely consistent, with some studies reporting an association (15–17, 19, 70) and other reporting no association (20–22, 26). Second, the difference in samples with regard to age and country of origin also make it difficult to compare our findings to other studies of dopamine candidate genes. Finally, there was only a single polymorphism within each candidate gene which was available for analysis. The authors only had access to the genotypes provided by the Add Health study, and could not perform further genotyping on the data set. It is possible that genetic variations in other parts of these (or other) genes in the dopaminergic system are associated with obesity in this population-based sample. However, it will require future studies to further examine this hypothesis.
The trends observed between DRD4 presented in our study are consistent with the findings reported by Guo et al. (24) using this same public-use data set. These investigators employed a somewhat different analytic procedure using the complete sample of related and unrelated individuals and included data from the self-report of height and weight obtained by the Add Health study at Wave I. These investigators found a significant association between DRD4 and obesity among African-Americans and Hispanics. We chose to limit our analyses to unrelated individuals only, and we further limited our analysis by using measured height and weight assessed during young adulthood to construct BMI categories. When we examined the association between change in BMI and DRD4 we did find an association approaching significance (p = .07).
While we are enthusiastic about the findings presented here, caution is warranted in interpretation. Initial reports from candidate gene studies, in general, may overestimate the effect (71) and modest yet significant effects are reported here. Also, we did not apply a Bonferroni correction because many of the phenotypic tests were related and this would have resulted in an over-conservative correction. However, a large number of statistical comparisons were conducted which may have potentially inflated the risk of Type I error. Thus, replication is needed before definitive conclusions can be made about the role of these genes on regulating weight and risk of obesity. Also, future studies are planned to examine the interactions with other psychological states and traits which may help to better explain these associations as some of the psychological states overlap with risk of obesity. Of note, we did not find that the associations that were present for Hispanics and American Whites were also present for African-Americans in this sample. Furthermore, the association observed for Whites between SLC6A4 and obesity did not exhibit the same pattern as it did for Hispanics. These differences may represent the reduced power in the stratified model, genetic heterogeneity within the Hispanic and African-American groups, or both factors. This will need to be further studied with larger sub-samples of non-Caucasian participants. Another limitation of the current study was that other indicators of adiposity or body composition (e.g., waist circumference, skin fold measures) were not present in the Add Health study. In general, BMI is a good proxy, but examining the association between these candidate genes and other indicators of adiposity and body composition would strengthen the findings. Also of note, these analyses did not account for age of pubertal onset which is potentially important to the analyses of change in BMI; however, given that the median age at Wave II was 17 (Mean = 16.5), this may have had little affect, as most participants would likely have been post-pubertal onset. Further, as described above, it would have been ideal to have additional candidate gene data available, and multiple polymorphisms within the genes in order to test other hypothesis as well as evaluate the effects of population stratification. However, currently only a limited amount of genetic data is available for analysis using this cohort.
Our findings lend further support to of the involvement of dopamine and serotonin regulation on energy balance (9). The results underscore the need for additional research examining the role of these systems on BMI and other energy-balance behaviors (e.g., diet and physical activity). Additional work is needed to identify the potential complex gene by gene and gene by environment interactions that may further characterize these main effects.
Acknowledgments
Portions of this work were supported by grant number NIDA K23DA017261 (FJM), NINDS NS049067 (MK and AAK) and NICHD HD31921 (MK and AAK). This research uses data from the National Longitudinal Study of Adolescent Health (Add Health) project, a program project designed by J. Richard Udry, PhD, principal investigator, and Peter Bearman, PhD, and funded by grant P01-HD31921 from the National Institute of Child Health and Human Development, Bethesda MD, to the Carolina Population Center, University of North Carolina at Chapel Hill, with cooperative funding participation by the National Cancer Institute; the National Institute of Alcohol Abuse and Alcoholism; the National Institute on Deafness and Other Communication Disorders; the National Institute on Drug Abuse; the National Institute of General Medical Sciences; the National Institute of Mental Health; the National Institute of Nursing Research; the National Institutes of Health Office of AIDS Research, Office of Behavioral and Social Science Research, Office of the Director, and Office of Research on Women’s Health; the Department of Health and Human Services, Office of Population Affairs; the Department of Health and Human Services, Centers for Disease Control and Prevention, National Center for Health Statistics and Office of Minority Health; the Department of Health and Human Services, Office of Public Health and Science Office of Minority Health; the Department of Health and Human Services, Office of the Assistant Secretary for Planning and Evaluation; Bethesda MD, and the National Science Foundation, Arlington VA. Persons interested in obtaining data files from the Add Health project should contact Add Health Project, Carolina Population Center, 123 W Franklin St, Chapel Hill, NC 27516-2524 (http://www.cpc.unc.edu/addhealth).
References
- 1.Adams KF, Schatzkin A, Harris TB, et al. Overweight, obesity, and mortality in a large prospective cohort of persons 50 to 71 years old. N Engl J Med. 2006;355:763–78. doi: 10.1056/NEJMoa055643. [DOI] [PubMed] [Google Scholar]
- 2.Calle EE, Rodriguez C, Walker-Thurmond K, Thun MJ. Overweight, obesity, and mortality from cancer in a prospectively studied cohort of U.S. adults. N Engl J Med. 2003;348:1625–38. doi: 10.1056/NEJMoa021423. [DOI] [PubMed] [Google Scholar]
- 3.Spiegel A, Nabel E, Volkow N, Landis S, Li TK. Obesity on the brain. Nat Neurosci. 2005;8:552–3. doi: 10.1038/nn0505-552. [DOI] [PubMed] [Google Scholar]
- 4.Bray GA. Obesity: the disease. J Med Chem. 2006;49:4001–7. doi: 10.1021/jm0680124. [DOI] [PubMed] [Google Scholar]
- 5.Rice T, Despres JP, Daw EW, et al. Familial resemblance for abdominal visceral fat: the HERITAGE family study. Int J Obes Relat Metab Disord. 1997;21:1024–31. doi: 10.1038/sj.ijo.0800511. [DOI] [PubMed] [Google Scholar]
- 6.Schousboe K, Willemsen G, Kyvik KO, et al. Sex differences in heritability of BMI: a comparative study of results from twin studies in eight countries. Twin Res. 2003;6:409–21. doi: 10.1375/136905203770326411. [DOI] [PubMed] [Google Scholar]
- 7.Stunkard AJ, Harris JR, Pedersen NL, McClearn GE. The body-mass index of twins who have been reared apart. N Engl J Med. 1990;322:1483–7. doi: 10.1056/NEJM199005243222102. [DOI] [PubMed] [Google Scholar]
- 8.Rankinen T, Zuberi A, Chagnon YC, et al. The human obesity gene map: the 2005 update. Obesity (Silver Spring, Md. 2006;14:529–644. doi: 10.1038/oby.2006.71. [DOI] [PubMed] [Google Scholar]
- 9.Barsh GS, Schwartz MW. Genetic approaches to studying energy balance: perception and integration. Nat Rev Genet. 2002;3:589–600. doi: 10.1038/nrg862. [DOI] [PubMed] [Google Scholar]
- 10.Small DM, Jones-Gotman M, Dagher A. Feeding-induced dopamine release in dorsal striatum correlates with meal pleasantness ratings in healthy human volunteers. Neuroimage. 2003;19:1709–15. doi: 10.1016/s1053-8119(03)00253-2. [DOI] [PubMed] [Google Scholar]
- 11.Volkow ND, Wang GJ, Fowler JS, et al. “Nonhedonic” food motivation in humans involves dopamine in the dorsal striatum and methylphenidate amplifies this effect. Synapse. 2002;44:175–80. doi: 10.1002/syn.10075. [DOI] [PubMed] [Google Scholar]
- 12.Volkow ND, Wang GJ, Maynard L, et al. Brain dopamine is associated with eating behaviors in humans. Int J Eat Disord. 2003;33:136–42. doi: 10.1002/eat.10118. [DOI] [PubMed] [Google Scholar]
- 13.Wang GJ, Volkow ND, Logan J, et al. Brain dopamine and obesity. Lancet. 2001;357:354–7. doi: 10.1016/s0140-6736(00)03643-6. [DOI] [PubMed] [Google Scholar]
- 14.Comings DE, Gade R, MacMurray JP, Muhleman D, Peters WR. Genetic variants of the human obesity (OB) gene: association with body mass index in young women, psychiatric symptoms, and interaction with the dopamine D2 receptor (DRD2) gene. Mol Psychiatry. 1996;1:325–35. [PubMed] [Google Scholar]
- 15.Noble EP, Noble RE, Ritchie T, et al. D2 dopamine receptor gene and obesity. Int J Eat Disord. 1994;15:205–17. doi: 10.1002/1098-108x(199404)15:3<205::aid-eat2260150303>3.0.co;2-p. [DOI] [PubMed] [Google Scholar]
- 16.Spitz MR, Detry MA, Pillow P, et al. Variant alleles of the D2 dopamine receptor gene and obesity. Nutrition Research. 2000;20:371–80. [Google Scholar]
- 17.Thomas GN, Tomlinson B, Critchley JA. Modulation of blood pressure and obesity with the dopamine D2 receptor gene TaqI polymorphism. Hypertension. 2000;36:177–82. doi: 10.1161/01.hyp.36.2.177. [DOI] [PubMed] [Google Scholar]
- 18.Morton LM, Wang SS, Bergen AW, et al. DRD2 genetic variation in relation to smoking and obesity in the Prostate, Lung, Colorectal, and Ovarian Cancer Screening Trial. Pharmacogenetics and genomics. 2006;16:901–10. doi: 10.1097/01.fpc.0000230417.20468.d0. [DOI] [PubMed] [Google Scholar]
- 19.Blum K, Braverman ER, Wood RC, et al. Increased prevalence of the Taq I A1 allele of the dopamine receptor gene (DRD2) in obesity with comorbid substance use disorder: a preliminary report. Pharmacogenetics. 1996;6:297–305. doi: 10.1097/00008571-199608000-00003. [DOI] [PubMed] [Google Scholar]
- 20.Epstein LH, Jaroni JL, Paluch RA, et al. Dopamine transporter genotype as a risk factor for obesity in African-American smokers. Obes Res. 2002;10:1232–40. doi: 10.1038/oby.2002.168. [DOI] [PubMed] [Google Scholar]
- 21.Jenkinson CP, Hanson R, Cray K, et al. Association of dopamine D2 receptor polymorphisms Ser311Cys and TaqIA with obesity or type 2 diabetes mellitus in Pima Indians. Int J Obes Relat Metab Disord. 2000;24:1233–8. doi: 10.1038/sj.ijo.0801381. [DOI] [PubMed] [Google Scholar]
- 22.Southon A, Walder K, Sanigorski AM, et al. The Taq IA and Ser311 Cys polymorphisms in the dopamine D2 receptor gene and obesity. Diabetes Nutr Metab. 2003;16:72–6. [PubMed] [Google Scholar]
- 23.Walder K, Segal D, Jowett J, Blangero J, Collier GR. Obesity and diabetes gene discovery approaches. Curr Pharm Des. 2003;9:1357–72. doi: 10.2174/1381612033454739. [DOI] [PubMed] [Google Scholar]
- 24.Guo G, North K, Choi S. DRD4 gene variant associated with body mass: the National Longitudinal Study of Adolescent Health. Hum Mutat. 2006;27:236–41. doi: 10.1002/humu.20282. [DOI] [PubMed] [Google Scholar]
- 25.Levitan RD, Masellis M, Lam RW, et al. Childhood inattention and dysphoria and adult obesity associated with the dopamine D4 receptor gene in overeating women with seasonal affective disorder. Neuropsychopharmacology. 2004;29:179–86. doi: 10.1038/sj.npp.1300314. [DOI] [PubMed] [Google Scholar]
- 26.Epstein LH, Wright SM, Paluch RA, et al. Relation between food reinforcement and dopamine genotypes and its effect on food intake in smokers. Am J Clin Nutr. 2004;80:82–8. doi: 10.1093/ajcn/80.1.82. [DOI] [PubMed] [Google Scholar]
- 27.Leibowitz SF, Alexander JT. Hypothalamic serotonin in control of eating behavior, meal size, and body weight. Biol Psychiatry. 1998;44:851–64. doi: 10.1016/s0006-3223(98)00186-3. [DOI] [PubMed] [Google Scholar]
- 28.Wurtman RJ, Wurtman JJ. Brain Serotonin, Carbohydrate-craving, obesity and depression. Adv Exp Med Biol. 1996;398:35–41. doi: 10.1007/978-1-4613-0381-7_4. [DOI] [PubMed] [Google Scholar]
- 29.Wurtman RJ, Wurtman JJ. Nutrients, neurotransmitter synthesis, and the control of food intake. Res Publ Assoc Res Nerv Ment Dis. 1984;62:77–86. [PubMed] [Google Scholar]
- 30.Hill AJ, Blundell JE. Sensitivity of the appetite control system in obese subjects to nutritional and serotoninergic challenges. Int J Obes. 1990;14:219–33. [PubMed] [Google Scholar]
- 31.Wurtman RJ, Wurtman JJ. Brain serotonin, carbohydrate-craving, obesity and depression. Obes Res. 1995;3 (Suppl 4):477S–80S. doi: 10.1002/j.1550-8528.1995.tb00215.x. [DOI] [PubMed] [Google Scholar]
- 32.Durand E, Boutin P, Meyre D, et al. Polymorphisms in the amino acid transporter solute carrier family 6 (neurotransmitter transporter) member 14 gene contribute to polygenic obesity in French Caucasians. Diabetes. 2004;53:2483–6. doi: 10.2337/diabetes.53.9.2483. [DOI] [PubMed] [Google Scholar]
- 33.Suviolahti E, Oksanen LJ, Ohman M, et al. The SLC6A14 gene shows evidence of association with obesity. J Clin Invest. 2003;112:1762–72. doi: 10.1172/JCI17491. [DOI] [PMC free article] [PubMed] [Google Scholar]
- 34.Rosmond R, Bouchard C, Bjorntorp P. 5-HT2A receptor gene promoter polymorphism in relation to abdominal obesity and cortisol. Obes Res. 2002;10:585–9. doi: 10.1038/oby.2002.79. [DOI] [PubMed] [Google Scholar]
- 35.Rosmond R, Bouchard C, Bjorntorp P. Increased abdominal obesity in subjects with a mutation in the 5-HT(2A) receptor gene promoter. Ann N Y Acad Sci. 2002;967:571–5. doi: 10.1111/j.1749-6632.2002.tb04319.x. [DOI] [PubMed] [Google Scholar]
- 36.Herbeth B, Aubry E, Fumeron F, et al. Polymorphism of the 5-HT2A receptor gene and food intakes in children and adolescents: the Stanislas Family Study. Am J Clin Nutr. 2005;82:467–70. doi: 10.1093/ajcn.82.2.467. [DOI] [PubMed] [Google Scholar]
- 37.Aubert R, Betoulle D, Herbeth B, Siest G, Fumeron F. 5-HT2A receptor gene polymorphism is associated with food and alcohol intake in obese people. Int J Obes Relat Metab Disord. 2000;24:920–4. doi: 10.1038/sj.ijo.0801253. [DOI] [PubMed] [Google Scholar]
- 38.Santos JL, Ochoa MC, Patino A, Azcona C, Martinez JA, Marti A. No evidence of association between the serotonin 2A receptor--1438G/A promoter polymorphism and childhood obesity in a Spanish population: A case-parent study and a matched case-control study. Nutr Neurosci. 2005;8:207–11. doi: 10.1080/10284150500132963. [DOI] [PubMed] [Google Scholar]
- 39.Sookoian S, Gemma C, Garcia SI, et al. Short allele of serotonin transporter gene promoter is a risk factor for obesity in adolescents. Obesity (Silver Spring, Md. 2007;15:271–6. doi: 10.1038/oby.2007.519. [DOI] [PubMed] [Google Scholar]
- 40.Need AC, Ahmadi KR, Spector TD, Goldstein DB. Obesity is associated with genetic variants that alter dopamine availability. Ann Hum Genet. 2006;70:293–303. doi: 10.1111/j.1529-8817.2005.00228.x. [DOI] [PubMed] [Google Scholar]
- 41.Camarena B, Santiago H, Aguilar A, Ruvinskis E, Gonzalez-Barranco J, Nicolini H. Family-based association study between the monoamine oxidase A gene and obesity: implications for psychopharmacogenetic studies. Neuropsychobiology. 2004;49:126–9. doi: 10.1159/000076720. [DOI] [PubMed] [Google Scholar]
- 42.Redden DT, Allison DB. Nonreplication in genetic association studies of obesity and diabetes research. J Nutr. 2003;133:3323–6. doi: 10.1093/jn/133.11.3323. [DOI] [PubMed] [Google Scholar]
- 43.Geary N. Is the control of fat ingestion sexually differentiated? Physiol Behav. 2004;83:659–71. doi: 10.1016/j.physbeh.2004.08.041. [DOI] [PubMed] [Google Scholar]
- 44.Hu M, Crombag HS, Robinson TE, Becker JB. Biological basis of sex differences in the propensity to self-administer cocaine. Neuropsychopharmacology. 2004;29:81–5. doi: 10.1038/sj.npp.1300301. [DOI] [PubMed] [Google Scholar]
- 45.Kang AM, Palmatier MA, Kidd KK. Global variation of a 40-bp VNTR in the 3′-untranslated region of the dopamine transporter gene (SLC6A3) Biol Psychiatry. 1999;46:151–60. doi: 10.1016/s0006-3223(99)00101-8. [DOI] [PubMed] [Google Scholar]
- 46.Williams RB, Marchuk DA, Gadde KM, et al. Serotonin-related gene polymorphisms and central nervous system serotonin function. Neuropsychopharmacology. 2003;28:533–41. doi: 10.1038/sj.npp.1300054. [DOI] [PubMed] [Google Scholar]
- 47.Harris KM, Florey F, Tabor J, Bearman PS, Jones J, Udry JR. The National Longitudinal Study of Adolescent Health: Research Design. [Google Scholar]
- 48.Resnick MD, Bearman PS, Blum RW, et al. Protecting adolescents from harm. Findings from the National Longitudinal Study on Adolescent Health. Jama. 1997;278:823–32. doi: 10.1001/jama.278.10.823. [DOI] [PubMed] [Google Scholar]
- 49.Freeman B, Powell J, Ball D, Hill L, Craig I, Plomin R. DNA by mail: an inexpensive and noninvasive method for collecting DNA samples from widely dispersed populations. Behav Genet. 1997;27:251–7. doi: 10.1023/a:1025614231190. [DOI] [PubMed] [Google Scholar]
- 50.Lench N, Stanier P, Williamson R. Simple non-invasive method to obtain DNA for gene analysis. Lancet. 1988;1:1356–8. doi: 10.1016/s0140-6736(88)92178-2. [DOI] [PubMed] [Google Scholar]
- 51.Meulenbelt I, Droog S, Trommelen GJ, Boomsma DI, Slagboom PE. High-yield noninvasive human genomic DNA isolation method for genetic studies in geographically dispersed families and populations. Am J Hum Genet. 1995;57:1252–4. [PMC free article] [PubMed] [Google Scholar]
- 52.Spitz MR, Shi H, Yang F, et al. Case-control study of the D2 dopamine receptor gene and smoking status in lung cancer patients. J Natl Cancer Inst. 1998;90:358–63. doi: 10.1093/jnci/90.5.358. [DOI] [PubMed] [Google Scholar]
- 53.Anchordoquy HC, McGeary C, Liu L, Krauter KS, Smolen A. Genotyping of three candidate genes after whole-genome preamplification of DNA collected from buccal cells. Behav Genet. 2003;33:73–8. doi: 10.1023/a:1021007701808. [DOI] [PubMed] [Google Scholar]
- 54.Timberlake DS, Haberstick BC, Lessem JM, et al. An association between the DAT1 polymorphism and smoking behavior in young adults from the National Longitudinal Study of Adolescent Health. Health Psychol. 2006;25:190–7. doi: 10.1037/0278-6133.25.2.190. [DOI] [PubMed] [Google Scholar]
- 55.SUDAAN User’s Manual, Release 8.0. Research Triangle Institute; Research Triangle Park, NC: 2001. [Google Scholar]
- 56.Todd RD, Huang H, Smalley SL, et al. Collaborative analysis of DRD4 and DAT genotypes in population-defined ADHD subtypes. J Child Psychol Psychiatry. 2005;46:1067–73. doi: 10.1111/j.1469-7610.2005.01517.x. [DOI] [PubMed] [Google Scholar]
- 57.Munafo M, Clark T, Johnstone E, Murphy M, Walton R. The genetic basis for smoking behavior: a systematic review and meta-analysis. Nicotine Tob Res. 2004;6:583–97. doi: 10.1080/14622200410001734030. [DOI] [PubMed] [Google Scholar]
- 58.Sham PC, Curtis D. Monte Carlo tests for associations between disease and alleles at highly polymorphic loci. Ann Hum Genet. 1995;59:97–105. doi: 10.1111/j.1469-1809.1995.tb01608.x. [DOI] [PubMed] [Google Scholar]
- 59.Cole TJ, Faith MS, Pietrobelli A, Heo M. What is the best measure of adiposity change in growing children: BMI, BMI %, BMI z-score or BMI centile? Eur J Clin Nutr. 2005;59:419–25. doi: 10.1038/sj.ejcn.1602090. [DOI] [PubMed] [Google Scholar]
- 60.Berkey CS, Colditz GA. Adiposity in adolescents: change in actual BMI works better than change in BMI z score for longitudinal studies. Ann Epidemiol. 2007;17:44–50. doi: 10.1016/j.annepidem.2006.07.014. [DOI] [PubMed] [Google Scholar]
- 61.Sookoian S, Gemma C, Garcia SI, et al. Short allele of serotonin transporter gene promoter is a risk factor for obesity in adolescents. Obesity (Silver Spring) 2007;15:271–6. doi: 10.1038/oby.2007.519. [DOI] [PubMed] [Google Scholar]
- 62.Wurtman RJ, Wurtman JJ, Regan MM, McDermott JM, Tsay RH, Breu JJ. Effects of normal meals rich in carbohydrates or proteins on plasma tryptophan and tyrosine ratios. Am J Clin Nutr. 2003;77:128–32. doi: 10.1093/ajcn/77.1.128. [DOI] [PubMed] [Google Scholar]
- 63.Lesch KP, Bengel D, Heils A, et al. Association of anxiety-related traits with a polymorphism in the serotonin transporter gene regulatory region. Science. 1996;274:1527–31. doi: 10.1126/science.274.5292.1527. [DOI] [PubMed] [Google Scholar]
- 64.Greenberg BD, Tolliver TJ, Huang SJ, Li Q, Bengel D, Murphy DL. Genetic variation in the serotonin transporter promoter region affects serotonin uptake in human blood platelets. Am J Med Genet. 1999;88:83–7. [PubMed] [Google Scholar]
- 65.Ducci F, Newman TK, Funt S, Brown GL, Virkkunen M, Goldman D. A functional polymorphism in the MAOA gene promoter (MAOA-LPR) predicts central dopamine function and body mass index. Mol Psychiatry. 2006;11:858–66. doi: 10.1038/sj.mp.4001856. [DOI] [PubMed] [Google Scholar]
- 66.Gundlah C, Lu NZ, Bethea CL. Ovarian steroid regulation of monoamine oxidase-A and -B mRNAs in the macaque dorsal raphe and hypothalamic nuclei. Psychopharmacology (Berl) 2002;160:271–82. doi: 10.1007/s00213-001-0959-0. [DOI] [PubMed] [Google Scholar]
- 67.Smith LJ, Henderson JA, Abell CW, Bethea CL. Effects of ovarian steroids and raloxifene on proteins that synthesize, transport, and degrade serotonin in the raphe region of macaques. Neuropsychopharmacology. 2004;29:2035–45. doi: 10.1038/sj.npp.1300510. [DOI] [PubMed] [Google Scholar]
- 68.Martel P, Fantino M. Mesolimbic dopaminergic system activity as a function of food reward: a microdialysis study. Pharmacol Biochem Behav. 1996;53:221–6. doi: 10.1016/0091-3057(95)00187-5. [DOI] [PubMed] [Google Scholar]
- 69.Martel P, Fantino M. Influence of the amount of food ingested on mesolimbic dopaminergic system activity: a microdialysis study. Pharmacol Biochem Behav. 1996;55:297–302. doi: 10.1016/s0091-3057(96)00087-1. [DOI] [PubMed] [Google Scholar]
- 70.Thomas GN, Critchley JA, Tomlinson B, Cockram CS, Chan JC. Relationships between the taqI polymorphism of the dopamine D2 receptor and blood pressure in hyperglycaemic and normoglycaemic Chinese subjects. Clin Endocrinol (Oxf) 2001;55:605–11. doi: 10.1046/j.1365-2265.2001.01404.x. [DOI] [PubMed] [Google Scholar]
- 71.Lohmueller KE, Pearce CL, Pike M, Lander ES, Hirschhorn JN. Meta-analysis of genetic association studies supports a contribution of common variants to susceptibility to common disease. Nat Genet. 2003;33:177–82. doi: 10.1038/ng1071. [DOI] [PubMed] [Google Scholar]