Abstract
The temperature dependence, between 10 and 120 K, of electron spin–lattice relaxation at X-band was analyzed for a series of eight pyrrolate–imine complexes and for ten other copper(II) complexes with varying ligands and geometry including copper-containing prion octarepeat domain and S100 type proteins. The geometry of the CuN4 coordination sphere for pyrrolate–imine complexes with R = H, methyl, n-butyl, diphenylmethyl, benzyl, 2-adamantyl, 1-adamantyl, and tert-butyl has been shown to range from planar to pseudo-tetrahedral. The fit to the recovery curves was better for a distribution of values of T1 than for a single time constant. Distributions of relaxation times may be characteristic of Cu(II) in glassy solution. Long-pulse saturation recovery and inversion recovery measurements were performed. The temperature dependence of spin–lattice relaxation rates was analyzed in terms of contributions from the direct process, the Raman process, and local modes. It was necessary to include more than one process to fit the experimental data. There was a small contribution from the direct process at low temperature. The Raman process was the dominant contribution to relaxation between about 20 and 60 K. Debye temperatures were between 80 and 120 K. For samples with similar Debye temperatures the coefficient of the Raman process tended to increase as gz increased, as expected if modulation of spin–orbit coupling is a major factor in relaxation rates. Above about 60 K local modes with energies in the range of 260–360 K (180–250 cm−1) dominated the relaxation. For molecules with similar geometry, relaxation rates were faster for more flexible molecules than for more rigid ones. Relaxation rates for the copper protein samples were similar to rates for small molecules with comparable coordination spheres. At each temperature studied the range of relaxation rates was less than an order of magnitude. The spread was smaller between 20 and 60 K where the Raman process dominates, than at higher temperatures where local modes dominate the relaxation.
Spin echo dephasing time constants, Tm, were calculated from two-pulse spin echo decays. Near 10 K Tm was dominated by proton spins in the surroundings. As temperature was increased motion and spin–lattice relaxation made increasing contributions to Tm. Near 100 K spin-lattice relaxation dominated Tm.
Keywords: Copper(II), Electron spin relaxation, Inversion recovery, Saturation recovery, Spin echo dephasing
1. Introduction
Copper(II) spin systems have been studied extensively using electron paramagnetic resonance (EPR), however, there have been few studies of the electron spin relaxation rates of these systems [1–13]. Relaxation rates reflect the electronic structures of the paramagnetic center and the dynamic processes of these species and their environment. In addition, quantitative measures of electron spin relaxation rates as a function of temperature for transition metals in molecular complexes are required to interpret the effect of a more rapidly relaxing spin on the rate for a more slowly relaxing spin and thereby determine the distance between the two paramagnetic centers [14]. We report the relaxation rates of copper(II) in various geometries in small-molecule complexes and in proteins. Our goal is to understand the relaxation processes that occur at temperatures between about 10 and 120 K.
To examine the effect of geometry on electron spin relaxation rates, the pyrrolate–imine complexes 1–8, prepared at University of Louisiana, Monroe, were selected because they have similar first coordination spheres and a range of geometries that result from differences in substituent sizes (Table 1) [15]. The g-values and copper hyperfine splittings in the CW EPR spectra for these complexes and X-ray crystal structures for six of the complexes indicate that the dihedral angle between the two chelating N–Cu–N planes varies from 0° (R = H) to 63.8° (1-adamantyl).
Table 1.
Dihedral angles for 1–8
| Compound | R-group | Dihedral angle (°)a | Dihedral angle (°)b |
|---|---|---|---|
| 1 | H | 0 | |
| 2 | Methyl | 32–33 | 13–16 |
| 3 | n-Butyl | 25–29 | |
| 4 | Diphenylmethyl | 33.2 | |
| 5 | Benzyl | 29.3 | |
| 6 | 2-Adamantyl | 35–37 | |
| 7 | 1-Adamantyl | 63.8c | 60–61 |
| 8 | tert-Butyl | 61.3 |
The dihedral angle Nim–Cu–Npyrr/Nim–Cu–Npyrr between the two chelate rings (Nim is imine nitrogen, Npyrr is pyrrolate) obtained from X-ray crystal structures [15,16].
The dihedral angle Nim–Cu–Npyrr/Nim–Cu–Npyrr between the two chelate rings estimated from the correlation between EPR parameters and the dihedral angles from crystal structures [15].
Unpublished results, Prof. Fox.
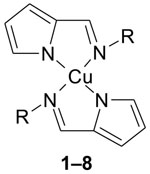
The copper(II) complexes copper(II) aqua, Cu(aq)2+; copper(II) hydroxide, Cu(OH)42− [17]; copper(II) ethylenediaminetetraacetate, CuEDTA [18]; copper(II) tetraimidazole, CuIm4 [19]; copper(II) tetra-2-methylimidazole, CuMeIm4 [19]; prion peptide sample Cu-HGGGW [20]; prion protein sample PrP(23–28, 57–91) [21]; and S100 type proteins [Cu(II)-S100A12 and Ca(II)-S100B and Cu(II)-S100B] [22] which have relatively well-defined copper centers were chosen for study.
The EPR g-values for Cu(OH)42− gx ∼ gy ∼ g⊥ < g‖ indicate an approximately square-planar geometry [17]. Cu(aq)2+ has been shown by EPR to be tetragonally distorted [23]. A recent study of Cu(aq)2+ in solution combining a full multiple-scattering analysis of the copper K-edge X-ray absorption spectrum and density functional theory indicated that it is an elongated five-coordinate square pyramid with four C–Oeq bonds and a long Cu–Oax bond [24]. Linear electric field effect EPR studies by Peisach and Mims showed that both Cu(aq)2+ and CuIm4 in 1:1 water/glycerol glasses are D2h-distorted [25,26]. On the basis of NMR studies [18] it was proposed that the copper(II) complex of H2EDTA2− in solution at pH 7 exists as a 1:2 mixture of Cu(H2EDTA)(H2O) containing pentadentate EDTA and a coordinated water molecule and Cu(HEDTA)− containing hexadentate EDTA. EPR characterization of CuEDTA in a 1:1 mixture of water (pH 7) and propylene glycol in frozen solution identified two spectral components [27]. The crystal structure of Cu(H2EDTA) has been determined by X-ray diffraction and shows that the copper environment is a tetragonally elongated octahedron with coplanar bonds [28].
The X-ray crystal structure of Cu-HGGGW shows equatorial copper coordination by histidine imidazole, two deprotonated glycine amides, and a glycine carbonyl, along with an axial water bridging to the Trp indole [20]. The coordinating amino acid atoms lie approximately in the equatorial plane and the copper is just above this plane. EPR studies on PrP(23–28, 57–91) and an 15N-labeled analogue have demonstrated that the Cu-HGGGW structure is maintained in the full prion protein octarepeat domain [20]. The S100 proteins are non-covalent homodimers. The X-ray crystal structure of Cu-S100A12 showed that the copper center is close to tetrahedral with the copper ion coordinated by His15 and Asp25 from one subunit of the dimer and by His85 and His89 from the other subunit [22]. NMR [29] and X-ray structures of Zn2+-S100B [22] showed that the Zn2+ is coordinated by three histidines and the C-terminal carboxyl group of the last Glu in the sequence. Since the binding sites in S100A12 and S100B proteins are similar it is expected that Cu2+ binds to the same site as Zn2+.
2. Experimental
2.1. Preparation of samples
The pyrrolate–imine complexes were prepared in the laboratory of Professor Fox [15]. Solutions were ca. 2.5 mM in 2:1 toluene/chloroform. Cu(aq)2+ [26], Cu(OH)42− [17], CuEDTA [27], CuIm4 [19] and CuMeIm4 [19] were prepared by literature methods and characterized by visible and EPR spectroscopy. Cu(H2EDTA)(H2O) was identified by g-values as the sole EPR-active component in a 1:1 water/glycerol solution [27]. Sample concentrations were 1–5 mM. The solvents and solvent mixtures used in these studies form glasses at low temperature. The prion samples were prepared in the laboratory of Professor Millhauser [20], with full copper occupancy, and the S100 protein samples [22] were prepared in the laboratory of Professor Kroneck. The third glycine in the sample of Cu-HGGGW was 15N labeled, but this glycine is not coordinated to the copper so isotope substitution at this location is not expected to impact the relaxation rates. A sample of S100B prepared with Cu2+ in both binding sites is designated as Cu-S100B and a sample with a mixture of Cu2+ and Ca2+ is designated as Cu/Ca-S100B. Sample concentrations were 1–2 mM.
2.2. EPR spectroscopy
Spin–lattice relaxation rates, 1/T1, as a function of temperature and position in the spectrum were measured by long-pulse saturation recovery (SR) on a locally constructed X-band spectrometer using a rectangular TE102 cavity [30]. A Varian flowthrough dewar and temperature controller and nitrogen gas cooled with liquid nitrogen were used for temperatures above 80 K, and the sample temperature was monitored continuously with a thermocouple positioned above the sample. The estimated uncertainty in sample temperature is less than 1 K. Temperatures between 10 and 70 K were obtained with an Oxford ESR900 flow cryostat and an Oxford ITC601 temperature controller. The sensor for this controller is 2–4 cm (depending on sample size) from the sample. The temperature at the sample was calibrated by replacing the sample tube with a tube containing a thermocouple immersed in 1:1 water/glycerol. The estimated uncertainty in sample temperature is as much as 2 K because the temperature at the sample depends strongly on the helium flow and on heater power. The effects of spectral diffusion were monitored by measuring the SR time constant as a function of the length of the saturating pulse. The data described in this report were obtained in the limit where the SR time constant is independent of the pump pulse length. The length of the pump pulse was always greater than the SR time constant. Typical pump times were 20 and 20,000 μs at 100 and 12 K, respectively.
Three-pulse inversion recovery electron spin-echo (ESE) experiments at 80 to 120 K were performed on the pyrrolate-imine complexes 1–8 and on prion samples on a locally constructed X-band spectrometer previously described [31,32] using an over-coupled TE102 cavity resonator and 1 kW amplifier. The temperature was controlled using the Varian flowthrough system described above. The Q of the over-coupled resonator was between 180 and 200. A π–τ–π/2–T–π–τ–echo sequence with pulse lengths of 40, 20, and 40 ns was used. The attenuation of the pulses was adjusted to give the maximum 2-pulse echo intensity. Initial values of τ and T ranged from 120 to 250 ns and 140 to 620 ns, respectively. Typically, 100–500 samples per step, 512 steps in τ, and 2–16 scans were acquired for these three pulse experiments.
ESE experiments also were performed at 10–120 K on a Bruker E580 with a split-ring resonator and Oxford CF 935 cryostat. The Q of the over-coupled resonator was ∼100. Two-pulse spin echo decays were performed using 16 and 32 ns pulses, and the attenuation of these pulses was adjusted to give the maximum echo. Initial values of τ ranged from 152 to 252 ns. Values of Tm less than about 0.3 μs were difficult to measure because of low signal-to-noise. Three-pulse inversion recovery experiments at 20–40 K were performed using 32, 16, and 32 ns pulses, and the attenuation of the pulses was adjusted to give the maximum echo. Values of initial τ and T ranged from 120 to 200 ns and 332 to 400 ns, respectively. The two and three pulse experiments used 20–80 shots per point, 256 steps in τ, and multiple scans. Background curves recorded for a 1:1 water/glycerol sample were subtracted from the ESE curves and found to be negligible in the liquid helium temperature range and between 5 and 10% for relaxation times <1 μs in the liquid nitrogen temperature range. Protein samples that were of lower concentration had background contributions of between 2 and 10% in the 40–70 K temperature region. The background was as high as 20% for T1 < 1 μs at higher temperatures.
The concentration dependence of T1 was tested. Values of T1 obtained by inversion recovery for 2.5 and 0.4 mM solutions of 1 at 40–70 K agreed within experimental uncertainty. Relaxation times for 1 measured using saturation recovery at 10–70 K for 2.5 and 1.25 mM solutions also agreed within experimental uncertainty. Uncertainties in T1 are greater at lower temperatures because of greater relative uncertainties in temperature.
2.3. Analysis of the pulsed EPR data
The temperature dependence of relaxation rates for the copper complexes was monitored for the perpendicular lines (g ∼ 2.05 to 2.1). Experimental recovery curves were analyzed first by fitting a single exponential to the data using a non-linear least-squares algorithm. Provencher's MULTIFIT [33] routine was used to fit a sum of exponentials to the data, and distinctions between single and multiple exponential fits were based on the statistical tests in the program. The relative weightings for multiple exponential components also were analyzed using Brown's UPEN [34,35] routines. Analysis of the data with UPEN found a distribution of T1 values. Values of T1 calculated in the UPEN analysis were the peak of the distribution, the mid-point of the integral of the peak(s) in the distribution and the geometric mean of the distribution. These agreed within 10%. The values reported from the UPEN analysis are the distribution maximum, which is the most probable value.
The sum of two exponentials (MULTIFIT) or a distribution of exponentials (UPEN) gave better agreement with experimental inversion recovery or SR curves than was obtained with a single exponential (Fig. 1). From the MULTIFIT analyses there is predominately one major component at high temperature whereas at lower temperature two components have substantial weightings. The geometric mean of the two time constants is similar to the time constant obtained with a single-exponential fit. The UPEN analysis shows a trend towards two distributions at lower temperatures and a single distribution at higher temperatures. The value of T1 calculated with UPEN agreed with the single-exponential fit within experimental uncertainty. The values of T1 found using MULTIFIT fell within the distributions identified by UPEN. Time constants for complex 1 obtained by the three methods of analysis are compared in Fig. 2. The saturation recovery curves are the difference between on- and off-resonance signals that are recorded by alternating blocks of averages at two magnetic fields. Drifts in resonator tuning can cause imperfect subtractions that appear as long time constant contributions to the recovery curve. Analysis of the data with UPEN is less sensitive to this artifact than either the single-exponential or two-component fits to the data so UPEN was selected as the preferred method of analysis and values of T1 cited in the following discussion are based on UPEN, unless stated otherwise.
Fig. 1.
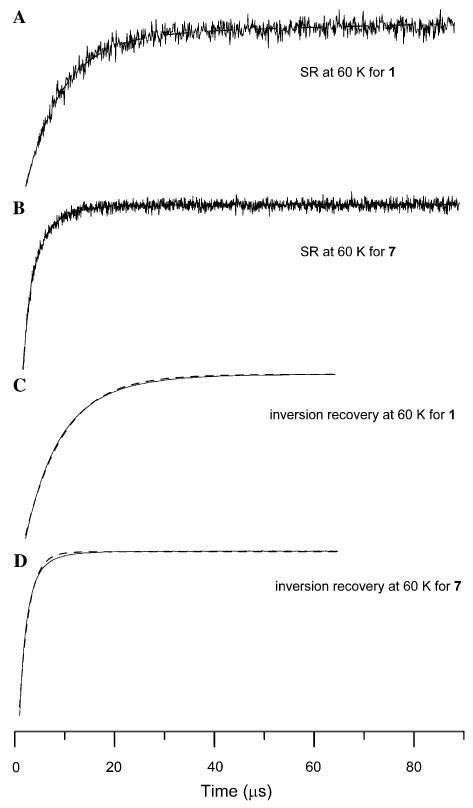
Recovery curves at 60 K for 2.5 mM 1 and 7 in 2:1 toluene/chloroform solution, obtained by (A) saturation recovery at g = 2.05 using 10900 scans and 900 points, (B) saturation recovery at g = 2.09 using 98100 scans and 1977 points, (C) inversion recovery at g = 2.05 using 200 scans and 256 points, (D) inversion recovery at g = 2.09 using 300 scans and 256 points. (A, B) Dashed lines are fits calculated for a distribution of relaxation rates. The y-axes of the plots are EPR signal amplitude in arbitrary units. (C, D) Dashed lines are fits calculated for a single exponential. For the inversion recovery curves the fit lines obtained for a distribution of exponentials were indistinguishable from the experimental data.
Fig. 2.
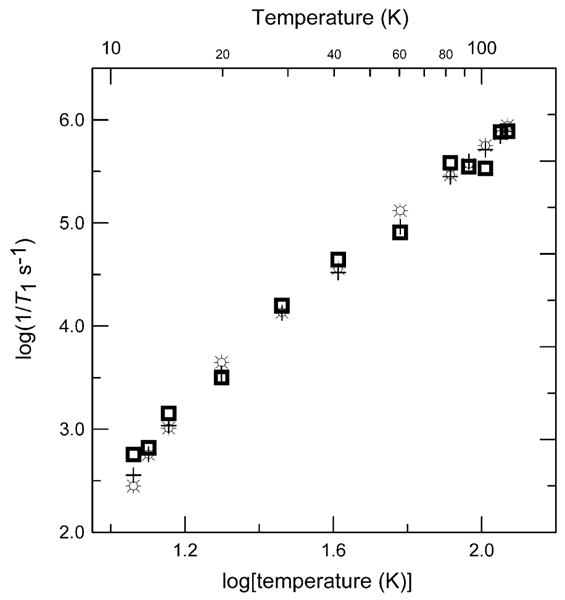
Temperature dependence of X-band electron spin–lattice relaxation rates for the perpendicular lines in the spectrum of 1. (+) 1/T1 obtained by fitting a single exponent to the data; ( ) 1/T1 obtained by fitting a sum of two exponents to the data and reporting the geometric mean of the two time constants; (⛭) 1/T1 obtained from the peak of the distribution calculated using UPEN.
To analyze the shapes of the two-pulse decays, a stretched exponential (Eq. (1)) was fitted to the data using a Levenberg-Marquardt algorithm
| (1) |
where Y(τ) is the intensity of the echo as a function of τ, the time between the two pulses. Y(0), echo intensity extrapolated to time zero, and Y(τ) are in arbitrary units that depend upon the concentration of the sample, resonator Q, and instrument settings. The parameters x and Tm describe the shape of the echo decay and x depends upon the mechanism of dephasing [36,37].
2.4. Comparison of time constants obtained from saturation recovery and inversion recovery curves
The spin–lattice relaxation times ranged from ∼0.2 μs at the highest temperatures for which data were recorded to ∼3000 μs at low temperatures. The dead-time for the SR experiments (∼900 ns) was greater than for the inversion recovery experiments (300–600 ns). For relaxation times less than about 1 μs the longer dead-time for the SR experiments than for inversion recovery caused values obtained by SR to be systemically longer than values obtained by inversion recovery. This discrepancy is attributed to differential sampling of the distributions of relaxation times. Single exponent fits to SR data were increasingly different from fits to inversion recovery data with increasing temperature (3% at 82 K and 25% at 117 K for 1). Analysis of recovery curves with UPEN, which reflects the distributions in T1, showed a better agreement between time constants obtained by inversion recovery and SR than other analysis methods.
Long-pulse saturation recovery experiments are less susceptible to contributions from spectral diffusion than inversion recovery because the spectral diffusion pathways are saturated during the long pump pulse. Thus, comparison of time constants longer than about 1 μs obtained by the two methods provides a way to assess the importance of spectral diffusion. Between 80 and 100 K the relaxation times obtained using inversion recovery were ∼5% shorter than those obtained by SR. The small difference between values obtained by the two methods indicates that spectral diffusion is not a serious problem at liquid nitrogen temperatures. To test this suggestion, SR experiments were repeated for 1 at 100 K with a range of pump times (0.2–20 μs), and little change (∼10%) in the T1 value was observed.
Signal-to-noise for the inversion recovery curves was significantly better than for saturation recovery (Fig. 1). In the inversion recovery experiments, essentially all of the spins within the bandwidth of the over-coupled resonator are flipped by the inverting pulse and contribute to the recovery curve. In SR only a weakly perturbing B1 can be used to monitor the smaller number of spins that are within the bandwidth of the critically coupled high-Q resonator. Because of the better signal-to-noise and shorter dead-time of the inversion recovery experiment compared to the saturation recovery experiment, inversion recovery was judged to give a more reliable estimate of the shorter relaxation times observed at 80 K and higher. However, inversion recovery would not have been an acceptable option for measuring T1 if spectral diffusion had made larger contributions to the inversion recovery curves.
The relaxation rates (1/T1) in the liquid helium range (40–70 K) obtained by single exponential fits to the recovery curves for some samples were found to be significantly longer for the SR experiment than for inversion recovery. The difference was as great as 20–30%. These differences were systematic and much larger than the ∼15% error that would result from a 2 K error in temperature at 40 K, indicating a contribution of spectral diffusion to the relaxation. However, for many samples the differences were within experimental uncertainty. For the protein samples, the difference between rates obtained by the two experiments typically was less than experimental uncertainty, indicating little effect from spectral diffusion. Overall it was judged that time constants calculated from the SR curves were more reliable than ones obtained by inversion recovery at temperatures below 80 K.
2.5. Analysis of the temperature dependence of T1
By minimizing the sum of the residuals on a log–log scale, a fit line for the temperature dependence of 1/T1 along g⊥ was based on Eq. (2).
| (2) |
where T is temperature in Kelvin, Adir is the coefficient for the contribution from the direct process, ARam is the coefficient for the contribution from the Raman process, θD is the Debye temperature, J8 is the transport integral,
where Aloc is the coefficient for the contribution from a local vibrational mode, Δloc is the energy for the local mode in units of Kelvin, Atherm is the coefficient for the contribution from the thermally activated process, τc is the correlation time for the thermally activated process, , Ea is the activation energy for the thermally activated process, and is the pre-exponential factor.
Mathematical expressions for the temperature dependence of spin–lattice relaxation are taken from the following references: Raman process [38,39], local mode [40], and thermally activated process [41].
2.6. Strategy used in analyzing temperature dependence of T1
The temperature dependence of 1/T1 could not be fitted with a single relaxation process for any of the samples. The data for each of the samples included a temperature region between 20 and 60 K in which the Raman process dominated. This process was used as the first component when fitting the experimental data. Additional contributions were then added as required to fit the data. The weak temperature dependence of relaxation produced by the direct process is distinctive, and its effects were detectable primarily at temperatures below about 20 K. The distinctive shape of the curve for 7 (Fig. 3) is due to a larger contribution from the direct process (Table 2). There are no known low-lying electronic excited states for the copper(II) complexes [7], so an Orbach process was not considered. Based only on the temperature dependence of 1/T1 over a limited temperature interval at a single microwave frequency it is not possible to distinguish between contributions from a local mode and a thermally activated process. A multifrequency study of the relaxation rates of bis(diethyldithiocarbamato)copper(II), [Cu(dtc)2] doped into diamagnetic Ni(dtc)2 [42], showed that relaxation rates were not frequency dependent, which is consistent with a local mode and inconsistent with a thermally activated process. By analogy with the results for Cu(dtc)2 a local mode was used to model the data for the copper complexes reported herein.
Fig. 3.
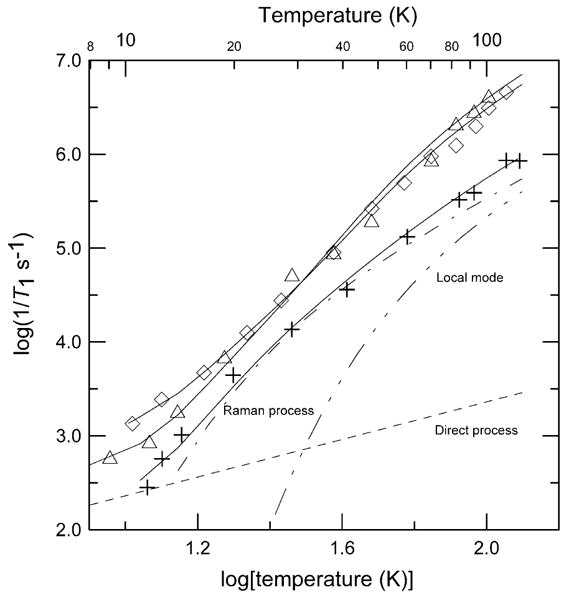
Temperature dependence of X-band spin–lattice relaxation rates for the perpendicular lines in the spectra of 1 (+), 7 (△), and 8 (◊) in 2:1 toluene/chloroform solution. The solid lines through the data are fits obtained using Eq. (2) and the parameters in Table 2. The contributions to the relaxation for 1 from the direct process (---), Raman process ( ) and local mode (
 ) are shown separately.
Table 2.
Contributions to spin–lattice relaxation determined by fitting Eq. (2) to 1/T1 as a function of temperature
| Sample | Sample symbol | Lattice | Temperature range (K) | Dihedral anglea, Geometry | gz values | Az (10−4cm−1) | Direct Adir(s−1K−1) | Raman ARam(s−1), θD | Local Aloc (s−1), (K) Δloc (K) |
|---|---|---|---|---|---|---|---|---|---|
| CuN4 complexes | |||||||||
| 1 (R = H) | + | Toluene/CHCl3 | 10–120 | 0 | 2.19b | 208b | 23 | 3.4 × 10⁶, 110 | 6.5 × 10⁶, 360 |
| 2 (R = methyl) | ✞ | Toluene/CHCl3 | 10–120 | 32–33 | 2.205b | 193b | 17 | 3.0 × 10⁶, 110 | 7.3 × 10⁶, 360 |
| 3 (R = n-butyl) | ∇ | Toluene/CHCl3 | 10–120 | 25–29.8 | 2.212b | 178b | 30 | 2.8 × 10⁶, 110 | 4.6 × 10⁶, 360 |
| 4 (R = diphenylmethyl) | ○ | Toluene/CHCl3 | 10–120 | 29.8 | 2.218b | 178b | 22 | 1.8 × 10⁶, 110 | 6.2 × 10⁶, 360 |
| 5 (R = benzyl) | ✡ | Toluene/CHCl3 | 10–120 | 33 | 2.212b | 180b | 33 | 2.9 × 10⁶, 110 | 3.5 × 10⁶, 360 |
| 6 (R = 2-adamantyl) | □ | Toluene/CHCl3 | 10–120 | 35–37 | 2.222b | 174b | 32 | 2.5 × 10⁶, 110 | 5.5 × 10⁶, 360 |
| 7 (R = 1-adamantyl) | △ | Toluene/CHCl3 | 10–120 | 63.8 | 2.277b | 110b | 500 | 1.0 × 10⁷, 110 | 9.0 × 10⁷, 360 |
| 8 (R = tert-butyl) | ◊ | Toluene/CHCl3 | 10–120 | 61 | 2.28b | 110b | 120 | 0.9 × 10⁷, 110 | 7.2 × 10⁷, 360 |
| Other small complexes | |||||||||
| Cu(OH)42− | ■ | 3 M NaOH(aq) | 10–120 | sq. planar | 2.252c | 186c | 5.0 | 8.0 × 10⁶, 110 | 1.4 × 10⁷, 360 |
| CuIM4 | ▲ | H2O/ethylene glycol | 10–120 | D2h, distorted | 2.24d | 208d | 20 | 4.5 × 10⁶, 110 | 6.8 × 10⁷, 360 |
| CuMeIM4 | ▶ | H2O/ethylene glycol | 10–120 | D2h, distorted | 2.205d | 200d | 4.0 × 10⁶, 110 | 5.0 × 10⁷, 360 | |
| CuEDTA | ✶ | H2O/glycerol | 10–120 | Elongated octahedron | 2.3d | 163d | 15 | 1.2 × 10⁷, 110 | 3.0 × 10⁷, 260 |
| Cu(aq)2+ | ● | H2O/glycerol | 10–120 | sq. pyramid, elongated | 2.4e | 128e | 1.0 × 10⁷, 110 | 9.0 × 10⁷, 260 | |
| Cu(dtc)2f | ▷ | Ni(dtc)2, solid | 26–298 | sq. planar | 2.083 | 167g | 30 | 5.8 × 10⁵, 90 | 5.7 × 10⁵, 240 |
| Cu(dtc)2f | ▼ | Toluene/CHCl3 | 25–140 | sq. planar | 2.087 | 164g | 20 | 3.8 × 10⁵, 65 | 1.4 × 10⁶, 250h |
| CuTTPf | ✰ | Toluene/CHCl3 | 20–135 | sq. planar | 2.203 | 210i | 14.5 | 5.5 × 10⁵, 110 | 2.0 × 10⁵, 250j |
| ZnTTPbipy-Cu(hfac)2f | ✚ | Toluene/CHCl3 | 15–100 | 6-coordinate | 2.288 | 166i | 1.2 × 10⁷, 125k | 9.0 × 10⁴, 250 | |
| Cu(hfac)2-(Me2-bipy)f | ◆ | Toluene/CHCl3 | 10–50 | 6-coordinate | 2.27 | 169i | 6.0 × 10⁶, 70k | 7.5 × 10⁵, 250 | |
| Proteins | |||||||||
| HGGGW | ★ | Buffer/glycerol | 10–120 | sq. pyramidal | 2.23l | 155l | 52 | 3.5 × 10⁶, 110 | 3.0 × 10⁷, 250m |
| Pr(23–28, 57–91) | ◀ | Buffer/glycerol | 40–120 | sq. pyramidal | 2.23l | 155l | 120 | 4.3 × 10⁶, 110 | 1.9 × 10⁷, 250m |
| Cu-S100A12 | ◁ | Buffer/glycerol | 10–120 | ∼Tetrahedral | 2.334n | 127n | 85 | 8.5 × 10⁶, 110 | 4.0 × 10⁷, 250o |
| Cu/Ca-S100B | ◆ | Buffer/glycerol | 10–120 | ∼Tetrahedral | 2.271n | 170n | 18 | 3.2 × 10⁶, 110 | 4.6 × 10⁷, 250o |
| Cu-S100B | × | Buffer/glycerol | 40–120 | ∼Tetrahedral | 2.284n | 162n | 20 | 6.8 × 10⁶, 110 | 5.0 × 10⁷, 250o |
Defined as the dihedral angle between the two chelating N(imine)–Cu–N(pyrrolate) planes.
Values at 100 K from Ref. [15].
Values at 77 K from Ref. [17].
Values at 50 K.
Values at 77 K from Ref. [23].
Values from Ref. [44].
Values at 100 K from Ref. [57].
Fit parameters include a thermally activated process with Atherm = 2.5 × 10¹⁷ s−2, Ea = 650 K, and .
Data from Ref. [58].
Fit includes a thermally activated process with Atherm = 8.6×10¹⁷ s−2, Ea = 650 K, and .
Data can also be fit with a local mode instead of a Raman process.
Values at 77 K from Ref. [21].
Alternate fitting is with a thermal process instead of a local mode using: Atherm = ∼2.5 × 10¹⁷ s−2, Ea = ∼650 K, and .
Values at 70 K, unpublished results, Prof. Kroneck.
Alternate fitting is with a thermal process instead of a local mode using: Atherm = ∼8.6 × 10¹⁷ s−2, Ea = ∼650 K, and .
Best-fit parameters were determined based on relaxation rates calculated using both UPEN and EXPON. Initial estimates of the Debye temperature varied between 80 and 120 K. These values are within the range of 65–168 K previously observed for molecular solids [1,7,43]. Values of θD and ARam are correlated. To permit comparison of values of ARam the Debye temperature was then fixed at 110 K, which is the average value for the eight pyrrolate–imine complexes in 2:1 toluene/chloroform. A Debye temperature of 110 K also was found in a previous study of copper(II) complexes in 2:1 toluene/chloroform solution [44]. The Debye temperatures for the other copper complexes are in this range, so θD also was set at 110 K to permit comparison of the ARam coefficients. The resulting best-fit parameters are given in Table 2.
2.7. Errors in parameters determined by fitting the temperature dependence of 1/T1
Based on residuals between the fit lines calculated with Eq. (2) and the temperature dependence of 1/T1, uncertainty in the characteristic energy for a process (θD or Δloc) is about 10% for the dominant contribution to the relaxation rate. Values for the characteristic energy for a process and the coefficient for that process are correlated. For example, increasing θD from 100 to 110 K requires increasing ARam by between 10 and 30% to give approximately the same relaxation rates. Increasing the value of Δloc from 350 to 360 K requires increasing Aloc by between 10 and 15% to give approximately the same relaxation rates. In addition, uncertainties in temperature, particularly at low temperature, could be a source of larger systemic errors. Uncertainties in fitted parameters are substantially larger for processes that make only a small contribution to the experimental relaxation rate in the temperature range examined.
3. Results
3.1. Spin–lattice relaxation
The overall shapes of the plots of log (1/T1) vs. temperature are similar for all of the complexes studied. Modeling of the temperature dependence required contributions from several processes. Typically, the Raman process dominated between about 20 and 60 K, which is consistent with prior studies of Cu(II) complexes [7,8,44,45]. At higher temperatures, the relaxation rates increased faster than is predicted for the Raman process and these additional contributions were attributed to local modes. Below 20 K, for some of the complexes, there also is a minor contribution from the direct process.
3.1.1. Pyrrolate–imine copper(II) complexes
The temperature dependence of 1/T1 for 1, 7, and 8 in 2:1 toluene/chloroform is shown in Fig. 3 and the fitting parameters are displayed in Table 2. The square-planar complex 1 has slower relaxation rates across the temperature range than the pseudo-tetrahedral complexes 7 and 8 (Figs. 1 and 3). Above about 60 K, where local modes make significant contributions to relaxation, the relaxation rates for the pseudo-tetrahedral complexes are up to a factor of six faster than for the square-planar complexes. The pseudo-tetrahedral complexes 7 and 8 have greater ARam and Aloc values than the square-planar complex 1 (Table 2). The spin–lattice relaxation rate for square-planar copper bleomycin at 17 K is similar to the rate for complex 1 [13].
Spin–lattice relaxation rates for the pyrrolate–imine complexes 1–6 are shown in Fig. 4. The greater scatter at lower temperatures is attributed to uncertainty in temperature. For these six complexes the temperature dependence of 1/T1, and the Adir and ARam parameters are similar (Table 2). Above about 40 K 1/T1 increases in the order 4 (R = diphenylmethyl, 33°) < 5 (R = benzyl, 29°) < 1 (R = H, 0°),2 (R = methyl, 32–33°), 6 (2-adamantyl, 35–37°), 3 (R = n-butyl, 25–29°) < 7 (R = 1-adamantyl, 63.8°) < 8 (R = tert-butyl, 60–61°), where dihedral angles are shown in parentheses. Although the pseudo-tetrahedral complexes have the fastest relaxation rates, the trends in relaxation rates for 1–6 do not correlate with dihedral angle (Table 1).
Fig. 4.
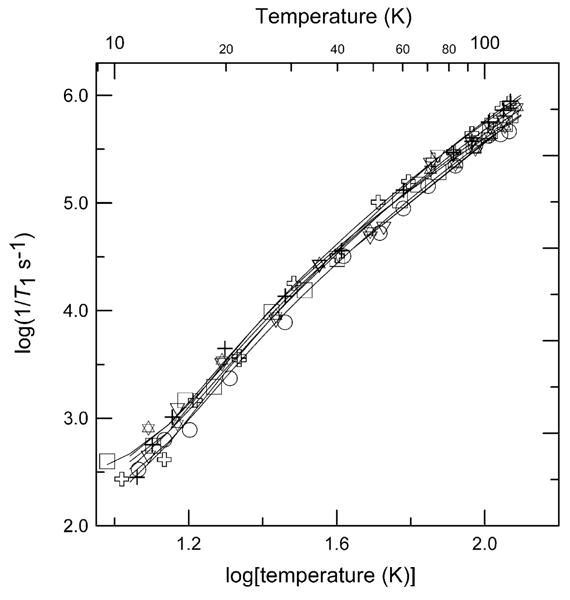
Temperature dependence of X-band spin-lattice relaxation rates for the perpendicular lines in the spectra of 1 (+), 2 (✞), 3 (∇), 4 (○), 5 (✡), and 6 (□) in 2:1 toluene/chloroform solution. The solid lines through the data are fits obtained using Eq. (2) and the parameters in Table 2.
3.1.2. Monodentate copper(II) complexes and CuEDTA in water/glycerol or water/ethylene glycol
Within this series of complexes the relaxation rates at temperatures above about 40 K increase in the order distorted tetrahedral CuMeIm4 < square-planar Cu(OH)4−2, distorted tetrahedral CuIm4 < six-coordinate CuEDTA < six-coordinate Cu(aq)2+ (Fig. 5). Spin–lattice relaxation rates for approximately square-planar Cu(OH)42− in 3 M NaOH solution are faster than for bidentate planar pyrrolate–imine complex 1 (Fig. 5) but slower than for tetrahedral complexes 7 and 8. The relaxation rates converge towards values common to square-planar 1 as the temperature decreases and the Raman process dominates. The relaxation rates for the complexes with higher coordination number, CuEDTA and Cu(aq)2+ in water/glycerol (1:1) above 40 K, are the fastest of the complexes studied (Fig. 5). These results demonstrate that although coordination geometry is a factor influencing relaxation rate, it is not the sole determinant. The relaxation rates observed for Cu(aq)2+ between 30 and 60 K in glassy water/glycerol (θD = 110 K) are a factor of 2–4 slower those observed in ionic Tutton salts (θD = 166–238 K) [45] for which there are large differences in Debye temperatures.
Fig. 5.
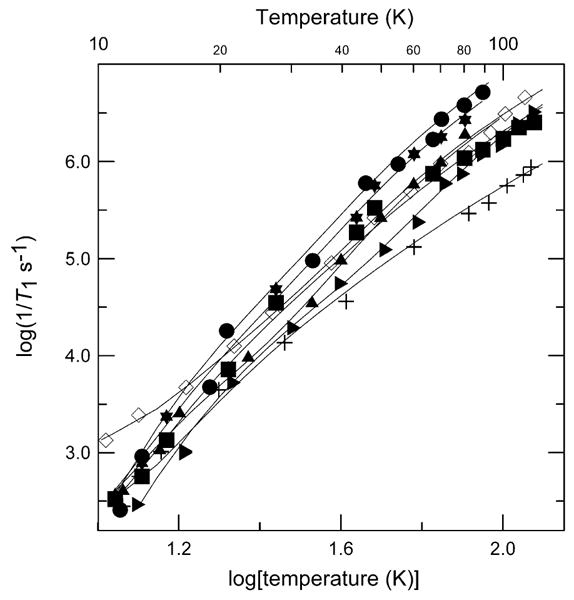
Temperature dependence of X-band spin–lattice relaxation rates for the perpendicular lines in the spectra of 1 (+), and 8 (◊) in 2:1 toluene/chloroform solution; CuEDTA (✶), and Cu(aq)2+ (●) in water/glycerol (1:1); Cu(OH)42− in 3 M NaOH solution (■); CuIm4 (▲), and CuMeIm4 (▶) in 1:1 water/ethylene glycol. The solid lines through the data are fits obtained using Eq. (2) and the parameters in Table 2.
3.1.3. Copper(II) proteins
The temperature dependence of 1/T1 for the copper proteins is plotted along with the data for complexes 1 and 8 in Fig. 6. There were small, but systematic differences between samples. The copper proteins have relaxation rates intermediate between the two extremes of structural types of copper complex studied. Above about 40 K the relaxation rates for the square pyramidal sites in the prion protein octarepeat domain are intermediate between the rates for square-planar 1, and rates for tetrahedral CuIm4 or square-planar Cu(OH)42−. Relaxation rates were similar for Cu-S100B, Cu/Ca-S100B, and other tetrahedral complexes. The value of ARam for the Cu-S100A12 protein is similar to the values for the pseudo-tetrahedral complexes 7 and 8 and Debye temperatures are similar (Table 2). Contributions to relaxation at higher temperatures were modeled as a local mode. It has previously been shown that the relaxation rates of low-spin Fe(III) in small-molecule porphyrin complexes are similar to rates for low-spin methemoglobin [44]. These observations are consistent with the suggestion that the local environment of the metal ion is relatively similar in the protein and in small molecules in glassy solvents [44].
Fig. 6.
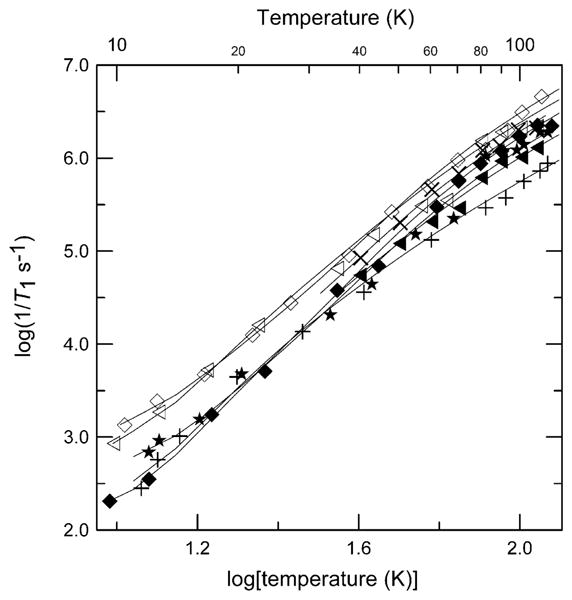
Temperature dependence of X-band spin–lattice relaxation rates for the perpendicular lines in the spectra of 1 (+), 8 (◊) in 2:1 toluene/chloroform; Cu-S100A12 (◁), Cu/Ca-S100B (◆) and Cu-S100B (×) in buffer/glycerol; prion peptide HGGGW (★), and prion protein (23–28, 57–91) (◀) in buffer/glycerol. The solid lines through the data are fits obtained using Eq. (2) and the parameters in Table 2.
3.1.4. Orientation dependence of 1/T1
The spin–lattice relaxation rates (1/T1) were measured by SR at ∼50 K and by inversion recovery at 60 K as a function of position in the spectrum. The relaxation rates showed little orientation dependence, within experimental uncertainty. One exception was CuEDTA, for which there is a 35% change of relaxation rate as a function of orientation at 60 K (T1 = 1.3 μs, on the perpendicular axis, to T1 = 0.84 μs, near the parallel axis, mI = −1/2). A larger change in relaxation rate of about 60% between the low-field and high-field extremes of the spectrum was observed for Cu-S100B, which is thought to have a tetrahedral geometry. For the complexes in which T1 depends on orientation, the range of orientations that contribute to the signal in the “perpendicular” region may be one of the factors that make a sum or distribution of exponentials fit the data better than a single exponential. However, orientation dependence is small compared with the widths of distributions in 1/T1. The orientation dependence observed for these complexes is much less than the factor of about 4 difference in spin–lattice relaxation rates for parallel and perpendicular orientations of nitroxyl radicals at 100 K that are attributed to differences in numbers of vibrational modes [46].
3.2. Spin-echo dephasing
3.2.1. Temperature dependence of 1/Tm
The shapes of the 2-pulse decay curves were fitted using a variable exponent (Eq. (1), variable x). The values of x reflect the mechanism of dephasing. When dephasing is dominated by nuclear spin diffusion (spin flip-flops) x is greater than 1, and often greater than 2 [36,47]. For solvents that contain methyl groups, rotation of the methyl groups contributes to shorter Tm values and lower values of x [47]. Values of x less than 1 are expected when a dynamic process occurs at a rate comparable to the difference between electron-nuclear couplings that are averaged by the dynamic process [36,48]. Samples with deep nitrogen modulation were excluded from the comparison because of the difficulty of calculating Tm in the presence of deep modulation.
The values of x changed with temperature. To convey overall trends in 1/Tm the values in Fig. 7 were calculated with a constant x = 1. The low temperature limiting values of 1/Tm (Fig. 7) are similar to values observed previously at low temperature for S = 1/2 transition metal complexes in glassy solution or doped solids [49]. The limiting values are attributed to interaction of electron spins with surrounding proton nuclear spins [47]. The best fits to the echo decays for the pyrrolate–imine copper(II) complexes 1–5, 7, and 8 in 2:1 toluene/chloroform at low temperatures were obtained using exponents between 1.5 and 1.0. For example, for 1 at 9.8 K Tm = 3.5 μs with x = 1.0. The relatively small values of x in this solvent mixture are attributed to the dynamics of the toluene methyl group [47]. However, for 3 (R = n-butyl) at 9.4 K Tm = 2.3 μs with x = 0.88. The smaller values of Tm and x for this complex than for other samples in this solvent mixture may be due to a dynamic process involving the methyls of the n-butyl groups [36,47]. For samples in 1:1 water/glycerol, including CuEDTA and Cu(aq)2+, and for Cu(OH)42− in 3 M NaOH the values of x at low temperature were about 2.5. For example, for Cu(aq)2+ at 9.8 K Tm = 4.7 μs and x = 2.6, which is in the range expected for proton-containing solvents with no methyl groups [47].
Fig. 7.
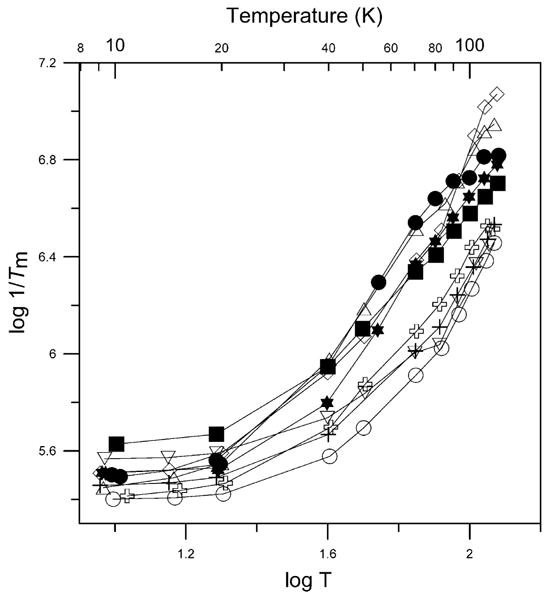
Temperature dependence of X-band spin–spin relaxation rates for the perpendicular lines in the spectra of 1 (+), 2 (✞), 3 (∇), 4 (○), 7 (△), and 8 (◊) in 2:1 toluene/chloroform solution; CuEDTA (✶), and Cu(aq)2+ (●) in water/glycerol (1:1); and Cu(OH)42− in 3 M NaOH solution (■). Tm obtained using a fixed exponent of one. The lines connect the data points.
Values of 1/Tm increased as temperature increased above about 20 K (Fig. 7). A similar temperature dependence was observed for Cu(aq)2+ in Tutton's salts [50]. When the value of x in Eq. (1) was varied to match the experimental curves, x decreased with increasing temperature. Two factors might contribute to these changes—motion and T1. As temperature is increased, the complexes become more mobile, which contributes to changes in resonance frequency of the spin packets on the timescale of the spin-echo experiment, and decreases Tm. When local motion contributes to spin echo dephasing, Tm is shorter in regions of the spectrum where small amplitude motion causes a larger change in resonance [51]. For tetrahedral complexes 7 and 8 at 50 K there was little dependence of 1/Tm on position in the spectrum. However for 1, 2, and 4, with geometries closer to planar, the values of 1/Tm at intermediate orientations with respect to the external field were larger by up to 70% than along the principal axes, which indicates a significant contribution of motion to the dephasing (Fig. 8). The orientation dependence of 1/Tm has been reported for other metal complexes at 50 K [51]. In addition, as temperature increases 1/T1 becomes faster. At higher temperatures 1/T1 becomes comparable to 1/Tm (Fig. 9), and dominates echo dephasing. In the temperature range where 1/T1 dominates 1/Tm, trends in 1/Tm as a function of structure are the same as for 1/T1. Above about 100 K the fit line based on relaxation rates at lower temperatures predicts rates would be faster than the experimental values (Fig. 9). This discrepancy may result from incomplete sampling of the faster components of the distribution.
Fig. 8.
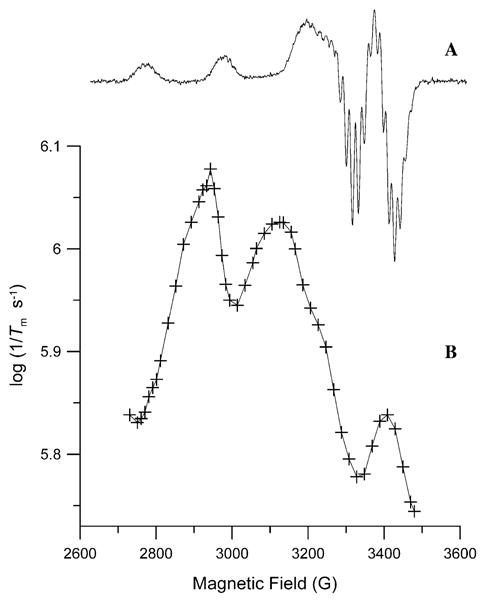
(A) CW spectrum (9.11 GHz) of 2.5 mM 1 in glassy 2:1 toluene/chloroform at 50 K obtained with 0.13 mW microwave power and 12.5 G modulation amplitude at 100 kHz. (B) Dependence of 1/Tm at 50 K on position in the spectrum for (+) 2.5 mM 1.
Fig. 9.
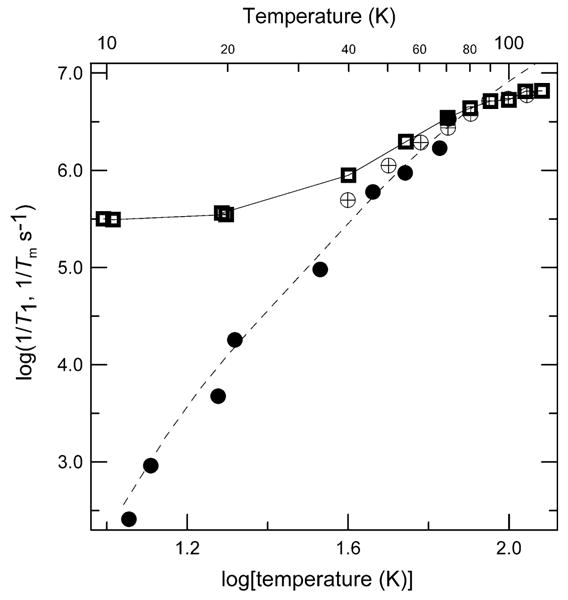
Temperature dependence of X-band relaxation rates for the perpendicular lines in the spectrum of 1.3 mM Cu(aq)2+ in water/glycerol (1:1). ( ) 1/Tm, (●) 1/T1 measured using saturation recovery and (⊕) 1/T1 measured using inversion recovery. The dashed line through the 1/T1 data is a fit obtained using Eq. (2) and the parameters in Table 2. For the Tm values the line connects the data points.
4. Discussion
To model the temperature dependence of 1/T1 it was necessary to invoke contributions from several relaxation processes. Distributions of exponentials gave better fits to the experimental data than single exponentials. Distributions widths were a factor of one to three times the central value. Distributions in g and A values, sometimes called g-strain and A-strain, are commonly observed for Cu(II) complexes [52,53]. These distributions reflect variations in geometry that may also impact relaxation rates, so the observation of distributions in relaxation rates may be characteristic of Cu(II) complexes.
Parameters that were obtained by fitting Eq. (2) to the relaxation rates are summarized in Table 2. Electron spin relaxation rates have been reported previously for Cu(dtc)2, CuTTP, ZnTTPbipy-Cu(hfac)2, and Cu(hfac)2-(Me2-bipy) in 2:1 toluene/chloroform solution [44]. Parameters obtained by modeling the temperature dependence of 1/T1 for these complexes are included in Table 2 and the temperature dependence is plotted in Fig. 10, along with selected comparison data from the current study. The relaxation rates for the six-coordinate Cu(II) in Cu(EDTA) are similar to Cu(aq)2+. However, for what might appear to be a very similar 6-coordinate Cu binding site, the relaxation rates in ZnTTPbipy-Cu(hfac)2 are much slower than for Cu(hfac)2-(Me2-bipy). In ZnTTPbipy-Cu(hfac)2, the bipy moiety is attached to a porphyrin that restricts motion so the decreased relaxation rates are attributed to the more rigid structure. The relaxation rates between 70 and 120 K for 7 and 8 in 2:1 toluene/chloroform, CuEDTA and Cu(aq)2+ in water/glycerol (1:1), Cu(OH)42− in 3 M NaOH solution, CuIm4 and CuMeIm4 in 1:1 water/ethylene glycol are more strongly temperature dependent than rates for the other complexes (Fig. 10).
Fig. 10.
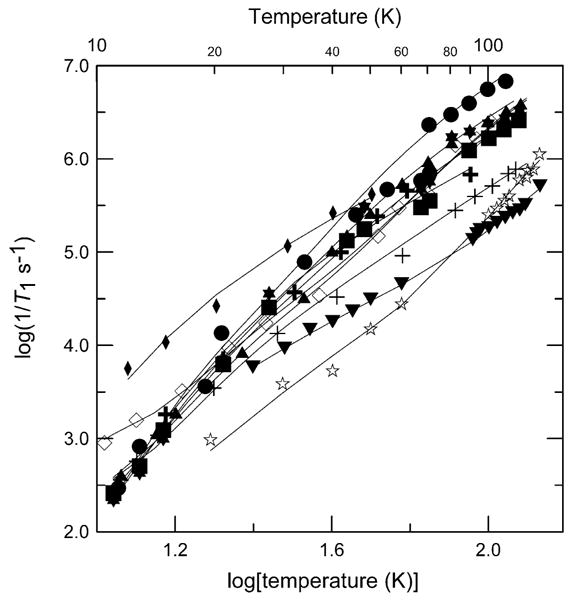
Temperature dependence of X-band spin–lattice spin relaxation rates for the perpendicular lines in the spectra of 1 (+), 8 (◊), Cu(dtc)2 (▼), CuTTP (✰), ZnTTPbipy-Cu(hfac)2 (✚), and Cu(hfac)2−(Me2−bipy) (◆) in 2:1 toluene/chloroform solution; CuEDTA (✶), and Cu(aq)2+ (●) in water/glycerol (1:1); Cu(OH)42− in 3 M NaOH solution (■); CuIm4 (▲) in 1:1 water/ethylene glycol. T1 values were calculated using a single exponent fit to the data. The solid lines through the data are fits obtained using Eq. (2).
4.1. Raman process
For the samples studied, the Raman process is the dominant contribution to the relaxation between about 20 and 60 K. The Debye temperature (θD) that was found by modeling the temperature dependence of 1/T1 was between 80 and 120 K for the small-molecule copper(II) complexes and protein samples. These values are similar to literature values of the Debye temperature for d1 and d9 metalloporphyrins in 2:1 toluene/chloroform and 1:1 water/glycerol (110–135 K) [44]. Values of ARam varied from 1.8 × 10⁶ s−1 for 4 to 1.2 × 10⁷ s−1 for CuEDTA.
Spin–lattice relaxation requires coupling between spin energy levels and energy levels of the lattice. The effectiveness of the Raman process increases as spin-orbit coupling increases. Spin-orbit coupling also is the source of g-value deviation from the free electron value. In the copper complexes studied here, values of gz are greater than either gx or gy and thus are more sensitive to changes in spin–orbit coupling. Since there is a correlation between ARam and θD, data are included in Fig. 11 only for samples with θD between 90 and 125 K. The values of ARam generally increase with increasing gz (Fig. 11), although not linearly. This dependence is consistent with the suggestion that increasing spin–orbit coupling is one of the factors that increases the effectiveness of spin–lattice relaxation via the Raman process. Plots of 1/T1 at 30 or 60 K also showed a correlation with gz, which indicates that the conclusion concerning the significance of spin orbit coupling is not dependent upon the details of the modeling of the data.
Fig. 11.
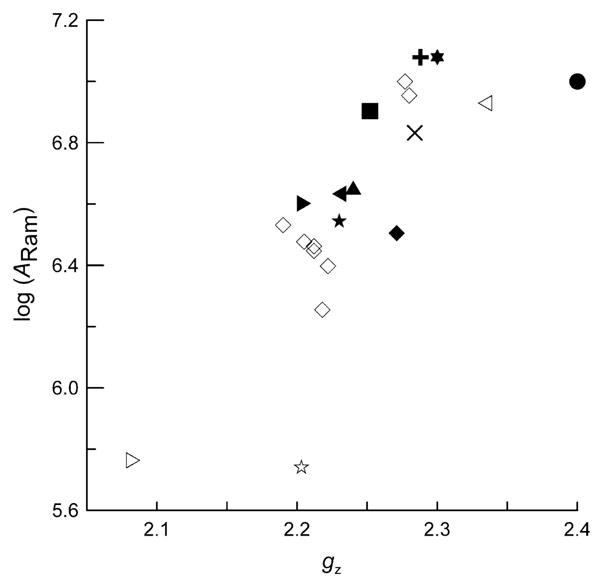
Dependence of log(ARam) on gz for pyrrolate–imine copper(II) complexes 1–8 in 2:1 toluene/chloroform solution (◊); Cu-S100A12 (◁), Cu/Ca-S100B (◆), and Cu-S100B (×) in buffer/glycerol; prion peptide HGGGW (★) and prion protein (23-28, 57-91) (◀) in buffer/glycerol; CuEDTA (✶), and Cu(aq)2+ (●) in 1:1 water/glycerol; Cu(OH)42− (■) in 3 M NaOH solution; CuIm4 (▲) and CuMeIm4 (▶) in 1:1 water/ethylene glycol; Cu(dtc)2 in Ni(dtc)2 (▷), CuTTP (✰), ZnTTPbipy-Cu(hfac)2 (✚) in 2:1 toluene/chloroform.
Within the set of complexes 1–6 with small dihedral angles there are variations in ARam that do not correlate with gz. For example, the smallest value of ARam for these pyrrolate–imine complexes is for 4, which has the bulky R = diphenylmethyl, which may make the structure more rigid. The S100 type proteins have values of ARam that increase in the order Cu/Ca-S100B < Cu-S100B < Cu-S100A12, which parallels the order of increasing gz (Table 2 and Fig. 11). However, the ARam values for these protein samples tend to be smaller than for the small-molecule complexes with similar values of gz. The protein binding environments may be more rigid than for the small molecules because motion of coordinated atoms is coupled to motion of a large number of atoms in the protein structure.
Values of ARam are particularly small for square-planar Cu(dtc)2 and CuTTP (Fig. 11). The coordination environments in these complexes are likely to be more rigid than for the monodentate complexes. The smaller values of ARam are then consistent with the general trend of slower relaxation for more rigid species.
4.2. Direct process
The weak temperature dependence that is characteristic of the direct process was observed for most of the copper(II) systems at low temperature (Table 2). No pattern in Adir as a function of concentration was observed in the experiments performed. Although square-planar copper complex 1 might be expected to stack or dimerize to a greater extent that other complexes [5], the value of Adir for 1 was similar to values for 2–6.
4.3. Local modes
For all of the complexes an additional process with a characteristic energy in the range of 260–360 K (180–250 cm−1) was required to fit the data. This process dominates relaxation above about 70 K. For example, the root mean square error of the fit of Eq. (2) to the temperature dependence of 1/T1 for 1 was 0.069 with the inclusion of a local mode, but without a local mode it was 0.112. These processes are tentatively assigned to local modes by analogy with the analysis of relaxation rates for Cu(dtc)2 [42]. Best fits of Eq. (2) to the experimental data were obtained using an energy of 360 K for copper centers with nitrogen coordination which is a higher energy than found previously for Cu(dtc)2 (250 K), which has a CuS4 coordination sphere. FT-IR bands near 374 K (260 cm−1) have previously been assigned to the υ[Cu–N(His)] of blue copper proteins [54]. The best fits to the relaxation rates for complexes with monodentate oxygen coordination had energy for the local mode of about 260 K. The coefficients, Aloc, range from 0.35 × 10⁷s−1 to 9.0 × 10⁷s−1 (Table 2) and are greater than the order of 105 observed previously for 3d transition metals complexes with a vibrational mode of ∼250 K [44]. The larger coefficient may reflect the greater flexibility of the complexes in this study.
4.4. Thermally activated process
To distinguish between a local mode and a thermally activated process requires experimental data at temperatures up to or beyond the temperature equivalent to the characteristic energy, or relaxation measurements at a second microwave frequency. The relaxation rates for these copper complexes were too fast to measure at temperatures high enough to distinguish between the two processes. Measurements of the relaxation rates at other microwave frequencies would be required to rule out a thermally activated process. For example, in the case of Cu(aq)2+ in 1:1 water/glycerol a dynamic Jahn-Teller process may have temperature dependence characteristic of a thermally activated process.
4.5. NMR studies
Spin–lattice relaxation times for metalloproteins in fluid solution have been derived from NMR and NMRD studies. The copper(II) relaxation times (T1) at room temperature for oxidized plastocyanin from spinach [55] and copper-substituted bovine carbonic anhydrase isoenzyme II [56] are 0.2–0.8 and 1.9 ns, respectively. Extrapolation of the best-fit line for the plots of 1/T1 versus temperature in this current study to 298 K predicted T1 to be in the range 65–82 ns for the prion samples and 35–47 ns for the S100 type proteins. The discrepancy between extrapolated values and values measured by NMRD for copper(II) in plastocyanin or carbonic anhydrase indicates that one or more additional processes contribute to the relaxation in fluid solution, possibly modulation of anisotropic g or hyperfine interaction by motion or modulation of spin–orbit coupling by collisions with solvent molecules.
5. Conclusions
There are substantial similarities in the temperature dependence of spin–lattice relaxation for copper(II) complexes with a range of geometries and coordination geometries. Relaxation rates typically were faster for 6-coordinate and tetrahedral complexes than for approximately square-planar geometries. For similar coordination geometries relaxation rates are similar for small molecules and protein complexes. At 20 K values of T1 for many of the complexes fall between about 100 and 300 μs. Somewhat longer relaxation times are observed for more rigid complexes. Between about 20 and 60 K the Raman process dominates the relaxation. Above about 60 K local vibrational modes make increasingly significant contributions to the relaxation rates and a wider range of relaxation rates is observed. At 100 K values of T1 ranged from about 0.3 to 6 μs. The values of T1 obtained for this series of complexes may be useful in estimating relaxation rates for copper(II) complexes for which measurements of relaxation rates have not yet been made.
Acknowledgments
The support of this work by National Institutes of Health Grant EB02807 (G.R.E. and S.S.E.) from NIBIB, by Grant GM65790 (G.L.M.) and by DFG, TR-SFB 11 (P.K. and G.F.) is gratefully acknowledged.
References
- 1.Kirmse VR, Solovev BV, Tarasov BG. Electronen-spin-gitter- and spin–spin relaxation von Cu(II) in Ni(II)-bis(1,1-dicyanoaethylen-2,2-dithiolat)-einkristallen. Ann Phys. 1974;7:352–360. [Google Scholar]
- 2.Standley KJ, Vaughan RA. Electron Spin Relaxation Phenomena in Solids. Plenum Press; New York: 1969. [Google Scholar]
- 3.Al'tshuler SA, Kozyrev BM. Electron Paramagnetic Resonance in Compounds of Transition Elements. Halsted-Wiley; Jerusalem: 1974. [Google Scholar]
- 4.Froncisz W, Antholine WE. Saturation recovery EPR of Cu(catechol)2. Curr Top Biophys. 1996;20:15–19. [Google Scholar]
- 5.Eaton SS, Eaton GR. Relaxation times of organic radicals and transition metal ions. Biol Magn Reson. 2000;19:29–154. [Google Scholar]
- 6.Bertini I, Martini G, Luchinat C. In: Handbook of Electron Spin Resonance: Data Sources, Computer Technology, Relaxation, and ENDOR. Poole J, Farach H, editors. American Institute of Physics; New York: 1994. [Google Scholar]
- 7.Hoffmann SK, Goslar J. Electron spin relaxation of copper(II) ions in diamagnetic crystals. Appl Magn Reson. 1998;14:293–303. [Google Scholar]
- 8.Hoffmann SK, Hilczer W, Goslar J, Massa MM, Calvo R. Electron spin relaxation in pseudo-Jahn-Teller low-symmetry Cu(II) complexes in diaqua(l-aspartate)Zn(II)·H2O crystals. J Magn Res. 2001;153:92–102. doi: 10.1006/jmre.2001.2434. [DOI] [PubMed] [Google Scholar]
- 9.Goslar J, Hoffmann SK, Hilczer W. Local vibration mode mechanism of electron spin–lattice relaxation of PO32− radicals in γ-irradiated (glycine) H3PO3 crystal and in its deuterated analogue. Solid State Commun. 2002;121:423–427. [Google Scholar]
- 10.Scholes CP, Janakiraman R, Taylor H, King TE. Temperature dependence of the electron spin–lattice relaxation rate from pulsed EPR of copper A and heme a in cytochrome c oxidase. Biophys J. 1984;45:1027–1030. doi: 10.1016/S0006-3495(84)84248-4. [DOI] [PMC free article] [PubMed] [Google Scholar]
- 11.Brudvig GW, Blair DF, Chan SI. Electron spin relaxation of CuA and cytochrome a in cytochrome c oxidase. Comparison to heme, copper, and sulfur radical complexes. J Biol Chem. 1984;259:11001–11009. [PubMed] [Google Scholar]
- 12.Mchaourab HS, Pfenninger S, Antholine WE, Felix CC, Hyde JS, Kroneck PMH. Multiquantum EPR of the mixed valence copper site in nitrous oxide reductase. Biophys J. 1993;64:1576–1579. doi: 10.1016/S0006-3495(93)81527-3. [DOI] [PMC free article] [PubMed] [Google Scholar]
- 13.Pfenninger S, Antholine WE, Barr ME, Hyde JS, Kroneck PMH, Zumft WG. Electron-spin–lattice relaxation of the [Cu(1.5)…Cu(1.5)] dinuclear copper center in nitrous oxide reductase. Biophys J. 1995;69:2761–2769. doi: 10.1016/S0006-3495(95)80149-9. [DOI] [PMC free article] [PubMed] [Google Scholar]
- 14.Eaton SS, Eaton GR. Determination of distances based on T1 and Tm effects. Biol Magn Reson. 2000;19:347–381. [Google Scholar]
- 15.Wansapura CM, Juyoung C, Simpson JL, Szymanski D, Eaton GR, Eaton SS, Fox S. From planar toward tetrahedral copper(II) complexes: structural and electron paramagnetic resonance studies of substituent steric effects in an extended class of pyrrolate–imine ligands. J Coord Chem. 2003;56:975–993. [Google Scholar]
- 16.Grushin VV, Marshall WJ. Water as an ideal solvent for the synthesis of easily hydrolyzable compounds: high-yield preparation of 2-pyrrolecarbaldimines and their CVD/ALD-relevant Cu(II) derivatives in H2O, Adv. Synth Catal. 2004;346:1457–1460. [Google Scholar]
- 17.Chao YH, Kearns DR. Electron spin resonance investigation of the soluble blue copper(II) hydroxide complex. J Phys Chem. 1977;81:666–668. [Google Scholar]
- 18.Oakes J, Smith EG. Nuclear magnetic resonance studies of transition metal complexes of ethylenediaminetetraacetic acid EDTA in aqueous solution. J Chem Soc, Faraday Trans. 1983;1(79):543–552. [Google Scholar]
- 19.McCracken J, Pember S, Benkovic SJ, Villafranca JJ, Miller RJ, Peisach J. Electron spin-echo studies of the copper binding site of phenylalanine hydroxylase from Chromobacterium violaceum. J Am Chem Soc. 1988;110:1069–1074. [Google Scholar]
- 20.Burns CS, Aronoff-Spencer E, Dunham CM, Lario P, Avdievich NI, Antholine WE, Olmstead MM, Vrielink A, Gerfen GJ, Peisach J, Scott WG, Millhauser GL. Molecular features of the copper binding sites in the octarepeat domain of the prion protein. Biochemistry. 2002;41:3991–4001. doi: 10.1021/bi011922x. [DOI] [PMC free article] [PubMed] [Google Scholar]
- 21.Aronoff-Spencer E, Burns CS, Avdievich NI, Gerfen GJ, Peisach J, Antholine WE, Ball HL, Cohen FE, Prusiner SB, Millhauser G. Identification of the Cu2+ binding sites in the N-terminal domain of the prion protein by EPR and CD spectroscopy. Biochemistry. 2000;39:13760–13771. doi: 10.1021/bi001472t. [DOI] [PMC free article] [PubMed] [Google Scholar]
- 22.Moroz OV, Antson AA, Grist SJ, Maitland NJ, Dodson GG, Wilson KS, Lukanidin E, Bronstein IB. Structure of the human S100A12-copper complex: implications for host-parasite defence. Acta Cryst D. 2003;59:859–867. doi: 10.1107/s0907444903004700. [DOI] [PubMed] [Google Scholar]
- 23.Lewis WB, Alei M, Jr, Morgan LO. Magnetic resonance studies on copper(II) complex ions in solution. I. Temperature dependences of the 17O NMR and copper(II) EPR linewidths of Cu(H2O)62+ J Chem Phys. 1966;44:2409–2417. [Google Scholar]
- 24.Frank P, Benfatto M, Szilagy RK, D'Angelo P, Longo SD, Hodgson KO. The solution structure of [Cu(aq)]2+ and its implications for rack-induced bonding in blue copper protein active sites. Inorg Chem. 2005;44:1922–1933. doi: 10.1021/ic0400639. [DOI] [PubMed] [Google Scholar]
- 25.Peisach J, Mims WB. Deviations from centrosymmetry in some simple Cu2+ complexes. Chem Phys Lett. 1976;37:307–310. [Google Scholar]
- 26.Peisach J, Mims WB. The linear electric field effect in Stellacyanin, Azurin and in some simple model compounds. Eur J Biochem. 1978;84:207–214. doi: 10.1111/j.1432-1033.1978.tb12158.x. [DOI] [PubMed] [Google Scholar]
- 27.More KM, Eaton GR, Eaton SS. Metal-nitroxyl interactions. 47. EPR spectra of two-spin-labeled derivatives of EDTA coordinated to paramagnetic metal ions. Inorg Chem. 1986;25:2638–2646. [Google Scholar]
- 28.Stephens FS. Crystal and molecular structure of aquo(dihydrogen ethylenediamine-tetra-acetato)copper(II) J Chem Soc A. 1969:1723. [Google Scholar]
- 29.Wilder PT, Varney KM, Weiss MB, Gitti RK, Weber DJ. Solution structure of zinc- and cadmium-bound rat S100B as determined by nuclear magnetic resonance spectroscopy. Biochemistry. 2005;44:5690–5702. doi: 10.1021/bi0475830. [DOI] [PubMed] [Google Scholar]
- 30.Quine RW, Eaton SS, Eaton GR. Saturation recovery electron paramagnetic resonance spectrometer. Rev Sci Instrum. 1992;63:4251–4262. doi: 10.1063/1.5043316. [DOI] [PMC free article] [PubMed] [Google Scholar]
- 31.Quine RW, Eaton GR, Eaton SS. Pulsed EPR spectrometer. Rev Sci Instrum. 1987;58:1709–1723. [Google Scholar]
- 32.Rinard GA, Quine RW, Harbridge JR, Song R, Eaton GR, Eaton SS. Frequency dependence of EPR signal-to-noise. J Magn Reson. 1999;140:218–227. doi: 10.1006/jmre.1999.1798. [DOI] [PubMed] [Google Scholar]
- 33.Provencher SW. An eigenfunction expansion method for the analysis of exponential decay curves. J Chem Phys. 1976;64:2772–2777. doi: 10.1016/S0006-3495(76)85660-3. [DOI] [PMC free article] [PubMed] [Google Scholar]
- 34.Borgia GC, Brown RJS, Fantazzini P. Uniform-penalty inversion of multiexponential decay data. J Magn Res. 1998;132:65–77. doi: 10.1006/jmre.1998.1387. [DOI] [PubMed] [Google Scholar]
- 35.Borgia GC, Brown RJS, Fantazzini P. Uniform-penalty inversion of multiexponential decay data II. Data spacing, T2 data, systematic errors, and diagnostics. J Magn Res. 2000;147:273–285. doi: 10.1006/jmre.2000.2197. [DOI] [PubMed] [Google Scholar]
- 36.Brown IM. In: Time Domain Electron Spin Resonance. Kevan L, Schwartz RN, editors. John Wiley; New York: 1979. [Google Scholar]
- 37.Salikhov KM, Tsvetkov YD. In: Time Domain Electron Spin Resonance. Kevan L, Schwartz RN, editors. Wiley; New York: 1979. [Google Scholar]
- 38.Abragam A. The Principles of Nuclear Magnetism. Oxford University Press; London: 1961. [Google Scholar]
- 39.Murphy J. Spin-lattice relaxation due to local vibrations with temperature-independent amplitudes. Phys Rev. 1966;145:241–247. [Google Scholar]
- 40.Castle JG, Jr, Feldman DW. Resonance modes at defects in crystalline quartz. Phys Rev A. 1965;137:671–673. [Google Scholar]
- 41.Bowman MK, Kevan L. In: Time Domain Electron Spin Resonance. Kevan L, Schwartz RN, editors. John Wiley; New York: 1979. [Google Scholar]
- 42.Eaton SS, Harbridge J, Rinard GA, Eaton GR, Weber RT. Frequency dependence of electron spin relaxation for three S = 1/2 species doped into diamagnetic solid hosts. Appl Magn Reson. 2001;20:151–157. [Google Scholar]
- 43.Zhou Y, Mitri R, Eaton GR, Eaton SS. Electron spin–lattice relaxation processes for molecular S = 1/2 systems in glassy matrices at temperatures between 10 and 130 K. Curr Top Biophys. 1999;23:63–68. [Google Scholar]
- 44.Zhou Y, Bowler BE, Eaton GR, Eaton SS. Electron spin–lattice relaxation rates for S = 1/2 molecular species in glassy matrices or magnetically dilute solids at temperatures between 10 and 300 K. J Magn Reson. 1999;139:165–174. doi: 10.1006/jmre.1999.1763. [DOI] [PubMed] [Google Scholar]
- 45.Hoffmann SK, Hilczer W, Goslar J, Augustyniak-Jablokow MA. Raman spin–lattice relaxation, Debye temperature and disorder effects studied with electron spin echo of Cu2+ in Tutton salt crystals. J Phys: Condensed Matter. 2001;13:7443–7457. [Google Scholar]
- 46.Du JL, Eaton GR, Eaton SS. Temperature, orientation, and solvent dependence of electron spin–lattice relaxation rates for nitroxyl radicals in glassy solvents and doped solids. J Magn Reson A. 1995;115:213–221. [Google Scholar]
- 47.Zecevic A, Eaton GR, Eaton SS, Lindgren M. Dephasing of electron spin echoes for nitroxyl radicals in glassy solvents by non-methyl and methyl protons. Mol Phys. 1998;95:1255–1263. [Google Scholar]
- 48.Du JL, Eaton GR, Eaton SS. Effect of molecular motion on electron spin phase memory times for copper(II) complexes in doped solids. Appl Magn Reson. 1994;6:373–378. [Google Scholar]
- 49.Du JL, Eaton GR, Eaton SS. Electron spin relaxation in vanadyl, copper(II), and silver(II) porphyrins in glassy solvents and doped solids. J Magn Reson A. 1996;119:240–246. [Google Scholar]
- 50.Hoffmann SK, Goslar J, Hilczer W, Augustyniak-Jablokow MA, Kiczka S. Dephasing relaxation of the electron spin echo of the vibronic Cu(H2O)6 complexes in Tutton salt crystals at low temperatures. J Magn Res. 2001;153:56–68. doi: 10.1006/jmre.2001.2426. [DOI] [PubMed] [Google Scholar]
- 51.Du JL, More KM, Eaton SS, Eaton GR. Orientation dependence of electron spin phase memory relaxation times in copper(II) and vanadyl complexes in frozen solution. Israel J Chem. 1992;32:351–355. [Google Scholar]
- 52.Froncisz W, Hyde JS. Broadening by strains of lines in the g-parallel region of copper (2+) ion EPR spectra. J Chem Phys. 1980;73:3123–3131. [Google Scholar]
- 53.Cannistraro S. Distribution of conformational states as common source of g- and A-strain in the ESR spectra of proteins and glasses. J Phys (Paris) 1990;51:131–139. [Google Scholar]
- 54.Nakamoto K. Infrared and Raman Spectra in Inorganic and Bioinorganic Chemistry. Wiley-Interscience; New York: 1997. [Google Scholar]
- 55.Bertini I, Ciurli S, Dikiy A, Gasanov R, Luchinat C, Martini G, Safarov N. High-field NMR studies of oxidized blue copper proteins: the case of spinach Plastocyanin. J Am Chem Soc. 1999;121:2037–2046. [Google Scholar]
- 56.Banci L, Bertini I, Luchinat C. Electron relaxation. Magn Reson Rev. 1996;11:1–40. [Google Scholar]
- 57.Du JL, Eaton GR, Eaton SS. Temperature and orientation dependence of electron-spin relaxation rates for bis(diethyldithiocarbamato)copper(II) J Magn Reson A. 1995;117:67–72. [Google Scholar]
- 58.Burchfield JM, Du JL, More KM, Eaton SS, Eaton GR. Enhancement of electron spin relaxation rates of metalloporphyrins due to interaction with a faster relaxing metal bound to an appended bipyridyl. Inorg Chim Acta. 1997;263:23–33. [Google Scholar]


