Abstract
The detection of single protein molecules1,2 in blood could help identify many new diagnostic protein markers. We report an approach for detecting hundreds to thousands of individual protein molecules simultaneously that enables the detection of very low concentrations of proteins. Proteins are captured on microscopic beads and labeled with an enzyme, such that each bead has either one or zero enzyme-labeled proteins. By isolating these beads in arrays of 50-femtoliter reaction chambers, single proteins can be detected by fluorescence imaging. By singulating molecules in these arrays, ~10–20 enzymes can be detected in 100 μL (~10−19 M). Single molecule enzyme-linked immunosorbent assays (digital ELISA) based on singulation of enzyme labels enabled the detection of clinically-relevant proteins in serum at concentrations (<10−15 M) much lower than conventional ELISA3-5. Digital ELISA detected prostate specific antigen in all tested sera from patients who had undergone radical prostatectomy, down to 14 fg/mL (0.4 fM).
The clinical use of protein biomarkers for the differentiation of healthy and disease states, and for monitoring disease progression, requires the measurement of low concentrations of proteins in complex samples. Current immunoassays measure proteins at concentrations above 10−12 M,6 whereas the concentration of the majority of proteins important in cancer7, neurological disorders8,9, and the early stages of infection10 are thought to circulate in the range from 10−16 to 10−12 M. Examples where increased sensitivity is required include: a 1 mm3 tumor composed of a million cells that each secrete 5000 proteins into 5 L of circulating blood translates to ~2 × 10⁻¹⁵ M (or 2 femtomolar, fM); early HIV infection with sera containing 10–3000 virions per mL equates to concentrations of p24 antigen ranging from 50 × 10−18 M (50 attomolar, aM) to 15 × 10−15 M (15 fM)10. Attempts to develop methods capable of measuring these concentrations of proteins have focused on the replication of nucleic acid labels on proteins,11,12 or on measuring the bulk, ensemble properties of labeled protein molecules13-16. The work of Mirkin et al.12,17 and others18 using labels based on gold nanoparticles and DNA biobarcodes has pushed the detection of proteins into the low femtomolar range; a recent report using this technology demonstrated the detection of 10 fM of PSA in serum17. The sensitivities achieved by methods for detecting proteins, however, still lag behind those for nucleic acids, such as the polymerase chain reaction (PCR), thereby limiting the number of proteins in the proteome that have been detected in blood6,19. The isolation and detection of single protein molecules provides a promising approach for measuring extremely low concentrations of proteins1,2. For example, Todd et al.2 have developed flow-based methods for serially detecting single fluorescently-labeled detection antibodies that have been released from immunocomplexes formed on solid substrates. Here, we report an approach for detecting thousands of single protein molecules simultaneously using the same reagents as the gold standard for detecting proteins, namely, the enzyme-linked immunosorbent assay (ELISA). This method has been used to detect proteins in serum at sub-femtomolar concentrations.
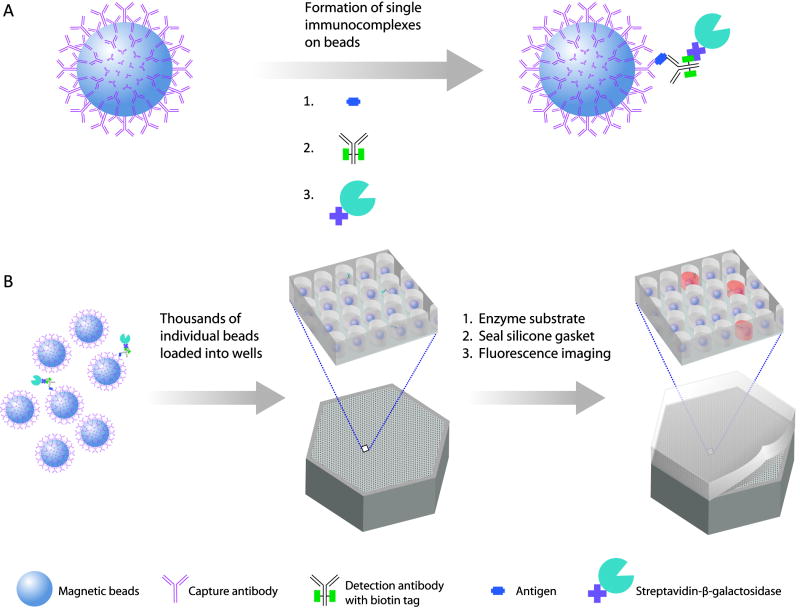
Our approach makes use of arrays of femtoliter-sized reaction chambers (Figure 1C)—which we term Single Molecule Arrays (SiMoA)—that can isolate and detect single enzyme molecules20-24. This approach builds from the work of Walt et al.20-23 who used these arrays to study the kinetics21 and inhibition20 of single enzymes. Our objective was to use the ability to trap and detect single enzymes to detect single protein molecules that had been labeled with an enzyme. In the first step of this single molecule immunoassay (Figure 1A), a sandwich antibody complex is formed on microscopic beads (2.7 μm diam.), and the bound complexes are labeled with an enzyme, as in a conventional bead-based ELISA. When assaying samples containing extremely low concentrations of protein, the ratio of protein molecules (and the resulting enzyme-labeled complex) to beads is small (typically less than 1:1) and, as such, the percentage of beads that contain a labeled immunocomplex follows a Poisson distribution, leading to single immunocomplexes on individual beads. For example, if 50 aM of a protein in 0.1 mL (3000 molecules) was captured and labeled on 200,000 beads, then 1.5% of the beads would have one protein molecule and 98.5% would have zero protein molecules (Figure 1B)22. It is not possible to detect these low numbers of enzyme labels using standard detection technology (e.g., a plate reader), because the fluorophores generated by each enzyme diffuse into a large assay volume (typically 0.1–1 mL), and it takes hundreds of thousands of enzyme labels to generate a fluorescence signal above background (Figure 2A). SiMoA enables the detection of very low concentrations of enzyme labels by confining the fluorophores generated by individual enzymes to extremely small volumes (~50 fL), leading to a high local concentration of fluorescent product molecules. To achieve this localization in an immunoassay, in the second step, beads are loaded into an array of femtoliter-sized wells (Figure 1C). The 2-mm wide arrays used in this work had ~50,000 wells, with diameters of 4.5 μm and depths of 3.25 μm. The loaded array is then sealed against a rubber gasket in the presence of a droplet of fluorogenic enzyme substrate, isolating each bead in a femtoliter reaction chamber. Beads possessing a single enzyme-labeled immunocomplex generate a locally high concentration of fluorescent product in the 50-fL reaction chambers (Figure 1D). By acquiring time-lapsed fluorescence images of the array using standard microscope optics, it is possible to distinguish beads associated with a single enzyme molecule (“on” well) from those not associated with an enzyme (“off” well); Supplementary Figure 1 shows histograms of fluorescence from “on” and “off” wells. Imaging the arrays allows tens to tens of thousands of single immunocomplexes to be detected simultaneously. The protein concentration in the test sample is determined by counting the number of wells containing both a bead and fluorescent product relative to the total number of wells containing beads (Figure 1D). Using SiMoA, concentration is determined digitally rather than by using the total analog signal; we, therefore, call the application of SiMoA to detect single immunocomplexes, digital ELISA.
Figure 1. Digital ELISA based on arrays of femtoliter wells.
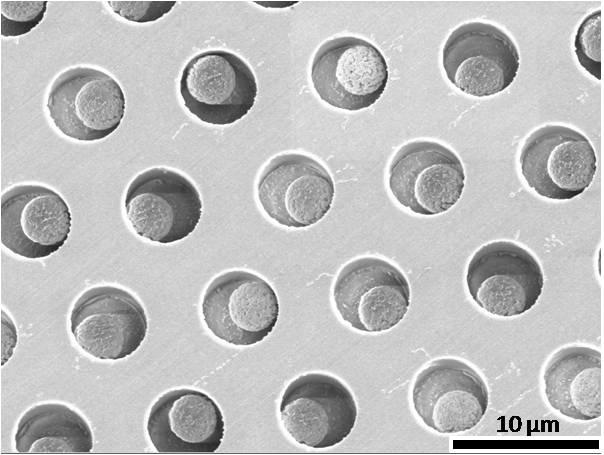
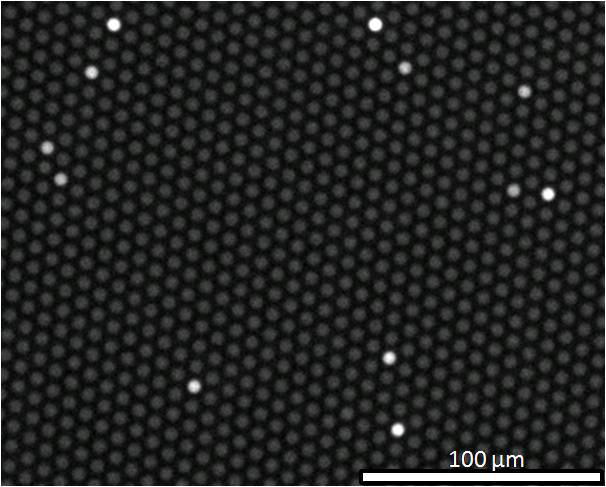
(A) Capturing and labeling single protein molecules on beads using standard ELISA reagents. (B) Loading of beads into femtoliter well arrays for isolation and detection of single molecules. (C) SEM image of a small section of a femtoliter well array after bead loading. 2.7-μm-diam. beads were loaded into an array of wells with diameters of 4.5 μm and depths of 3.25 μm. (D) Fluorescence image of a small section of the femtoliter well array after signals from single enzymes are generated. While the majority of femtoliter chambers contain a bead from the assay, only a fraction of those beads possess catalytic enzyme activity, indicative of a single, bound protein. The concentration of protein in bulk solution is correlated to the percentage of beads that have bound a protein molecule.
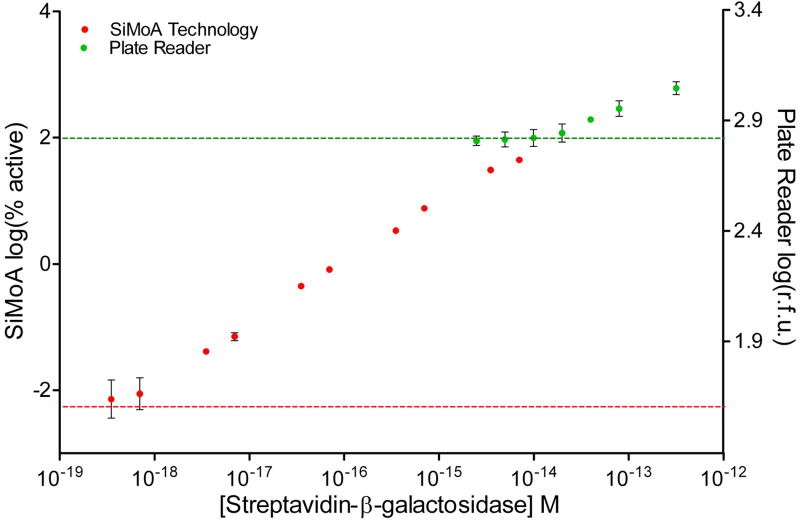
Figure 2. Digitization of enzyme-linked complexes greatly increases sensitivity compared to bulk, ensemble measurements.
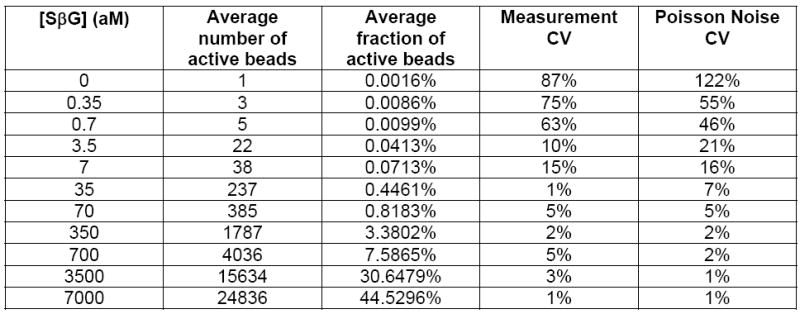
(A) Log-log plot of signal output (% active beads for SiMoA, or r.f.u. for plate reader) as a function of the concentration of SβG captured on biotinylated beads. SβG concentrations for the ensemble readout ranged from 3 fM to 300 fM, with a detection limit of 15 × 10−15 M (15 fM; green line). For the SiMoA assay, SβG concentrations ranged from 350 zM to 7 fM, demonstrating a linear response of greater than 4 logs, with a calculated detection limit of 220 × 10−21 M (220 zM; red line). Error bars are based on the standard deviation over three replicates for both technologies. LODs were determined by extrapolating the concentration from the signal equal to background signal plus three standard deviations of the background signal. (B) The imprecision of SiMoA is determined by the Poisson noise of counting single events. The intrinsic variation (Poisson noise) of counting single active beads is given by √n. Comparing the Poisson noise associated coefficient of variation (%CV = √n/n) with the SiMoA %CV over three measurements confirmed that the imprecision of the assay is determined by counting error.
Initially, we assessed the potential gains in sensitivity to enzyme label that can be achieved by singulating enzyme-labeled molecules compared to a traditional, ensemble measurement. The lowest number of enzyme molecules that can be detected by singulating enzymes provides an indication of the ultimate sensitivity of protein detection assays assuming that background signals arising from non-specific interactions could be eliminated. To evaluate the intrinsic sensitivity, we created populations of beads with well-characterized enzyme-to-bead ratios by mixing 400,000 beads presenting biotin with a range of concentrations of an enzyme conjugate, streptavidin-β-galactosidase (SβG). For convenience, biotinylated beads were provided by hybridizing biotinylated DNA with beads functionalized with complementary DNA. [We note that this experiment should not be construed as a sensitive DNA assay; the sensitivity of such an assay is limited by non-specific interactions between the enzyme conjugate and surface-bound DNA as shown in Supplementary Fig. 2]. These beads were read out in two different ways. First, an ensemble of beads was read out in 100 μL on a fluorescence plate reader after 1 h incubation with 100 μM resorufin-β-D-galactopyranoside (RGP), a fluorogenic substrate for β-galactosidase. The detection limit for enzyme on the plate reader was 15 fM of SβG (Figure 2). Second, the beads were loaded into femtoliter arrays and, after sealing a solution of RGP into the wells of the array, the signal from single enzymes was allowed to accumulate in the reaction chambers for 2.5 min, with fluorescent images acquired every 30 s. A white light image of the array was acquired at the end of the experiment to identify wells that contained beads (bead-containing wells scatter light differently than empty wells). The fluorescent images were used to determine which of those beads had an associated bound enzyme (from increasing intensity in time-lapsed fluorescent images). Figure 2 shows a log-log plot of the percentage of beads that contained an enzyme as a function of bulk SβG concentration. The lowest concentration of enzyme conjugate detected was 350 zeptomolar (zM) and the calculated limit of detection (LOD)—determined by extrapolating the enzyme concentration at a signal equal to background plus three standard deviations of the background signal—was 220 zeptomolar. The sensitivity of SiMoA to intrinsic label was, therefore, ~10–20 enzymes in 100 μL, corresponding to an increase in sensitivity over ensemble measurements using the plate reader of a factor of about 68,000. For comparison, chemiluminescence detection of alkaline phosphatase4, a highly sensitive enzyme reporter system widely used in clinical diagnostics, has an LOD of about 30 aM (see http://www.turnerbiosystems.com/doc/appnotes/S_0096.php). The high sensitivity of SiMoA to enzyme label derives from singulation of the signal from each molecule, and the high thermodynamic and kinetic efficiency of the capture and detection processes (see discussion below and Supplementary Table 1).
The linear dynamic range of digital detection of enzyme labels by SiMoA is determined by the ability to distinguish “on” and “off” wells. At low ratios of enzyme-to-beads (less than about 1:10), Poisson statistics show that the only statistically significant populations of beads are those with zero and one enzymes. Single enzymes can be detected provided that sufficient beads are interrogated and the number of active beads rises above the Poisson noise of counting active beads. At higher ratios of enzyme-to-beads (greater than about 1:10), the fraction of active beads becomes much higher, and Poisson statistics show that there are a significant number of beads with multiple enzymes. To quantitate the number of detected enzymes and maintain linearity in the sub-populations of beads with multiple enzymes, we use Poisson statistics to convert the number of active beads to the number of detected enzymes (see Supplementary Table 1). As the percentage of active beads approaches 50% (ratios of enzyme-to-beads greater than ~1:1.5), however, distinguishing “on” and “off” wells using image analysis software becomes challenging, and we reach a practical upper limit of the digital dynamic range. For example, the signal at 7 fM (~45% active) in Figure 2 deviates from linearity. As a result, the digital, linear dynamic range demonstrated here using 50,000 wells was from 3.5 fM down to 350 zM, i.e., about four logs. Provided that proteins are labeled using appropriate enzyme concentrations (see below), this dynamic range is sufficient for many clinical applications.
We have developed assays for two clinically-relevant proteins—prostate specific antigen (PSA) and tumor necrosis factor-α (TNF-α)—to determine if the high enzyme label sensitivity provided by singulation translates into highly sensitive assays for detecting proteins in blood. Digital ELISAs for both proteins were developed as outlined in Figure 1. The critical parameters in developing these assays were: bead concentration and the concentrations of the two labeling reagents (detection antibody and enzyme conjugate). The choice of bead concentration depends on several competing factors. First, sufficient beads must be present to capture most of the target analyte from thermodynamic and kinetic perspectives. Thermodynamically, 200,000 beads in 100 μL that each have about 80,000 antibodies25 bound to them equates to an antibody concentration of about 0.3 nM, and the antibody-protein equilibrium at that concentration gives rise to a high capture efficiency (>70%) (D.M.R., E.P.F., D.C.D., unpublished work). Kinetically, for 200,000 beads dispersed in 100 μL, the average distance between beads is about 80 μm. Proteins the size of TNF-α and PSA (17.3 and 30 kDa, respectively) will diffuse 80 μm in less than 1 min, suggesting that, over a 2 h incubation, capture of the protein molecules will not be limited kinetically. Second, sufficient beads must be present to be loaded onto the arrays to limit Poisson noise. 200,000 beads loaded into 50,000-well arrays typically results in 20,000–30,000 beads being trapped in femtoliter wells. For a typical background signal of 1% active beads (see below), this loading results in a background signal of 200–300 active beads detected, corresponding to an acceptable coefficient of variation (CV) from Poisson noise of 6–7%. Third, excessive bead concentrations can lead to: a) increases in non-specific binding that reduces signal-to-background; and b) low ratios of analyte-to-bead such that the fraction of active beads is too low, resulting in high CVs from Poisson noise. The balance of these factors means that 200,000 to 1,000,000 beads per 100 μL of test sample is optimal for digital ELISA. The concentrations of detection antibody and enzyme conjugate were also minimized to yield the acceptable background signal (1%) and Poisson noise (see Supplementary Discussion).
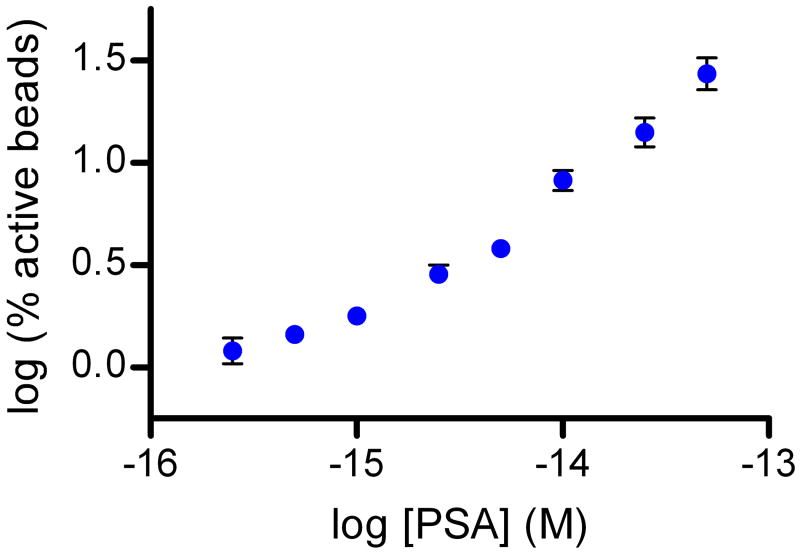
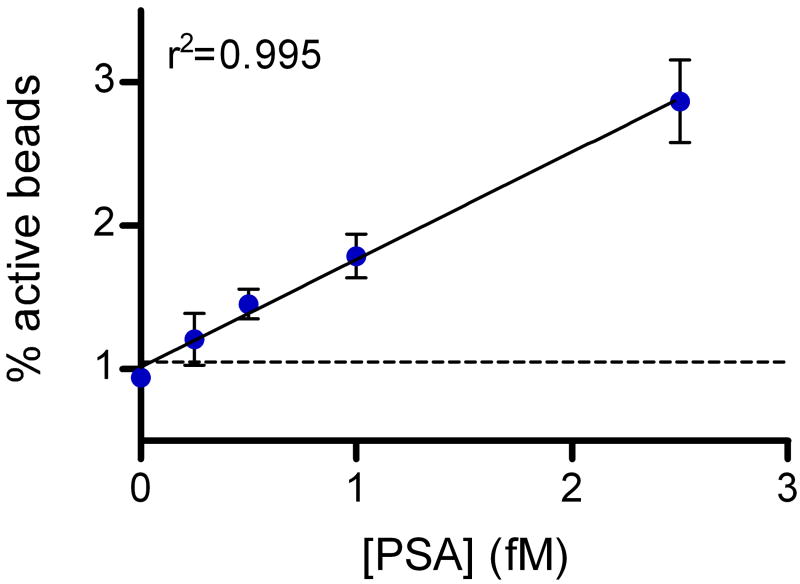
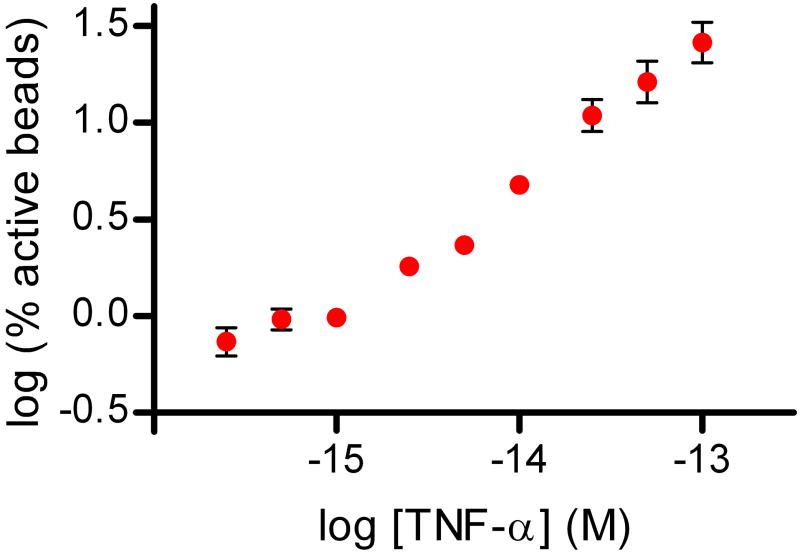
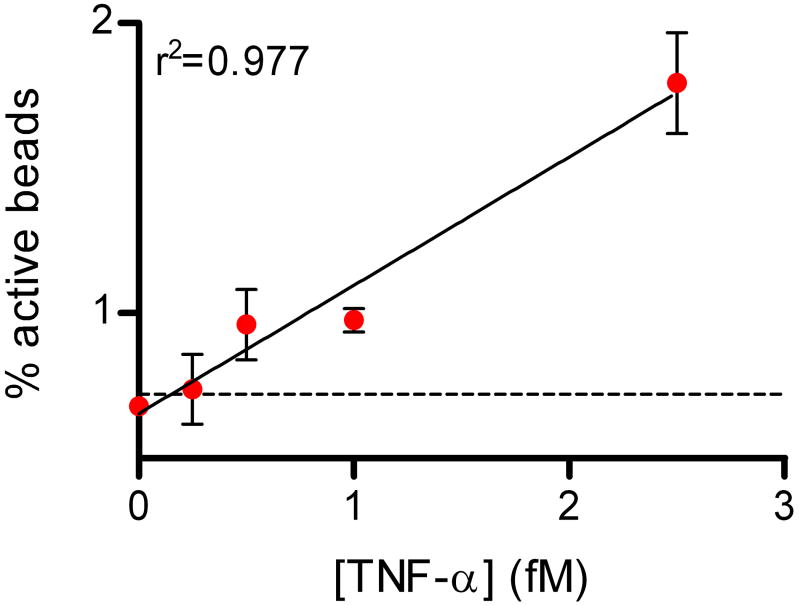
Figure 3 shows data from digital ELISAs for PSA and TNF-α. The human forms of the proteins were spiked into 25% bovine serum to be representative of clinical test samples; a four-fold dilution factor is typically used to reduce matrix effects in immunoassays4. Using digital ELISA to detect PSA in 25% serum, an LOD of ~50 aM (1.5 fg/mL) was determined from this experiment, equating to an LOD in whole serum of ~200 aM (6 fg/mL). The lowest concentration tested and detected was 250 aM in 25% serum, corresponding to 1 fM in whole serum. As LOD is determined by extrapolating the concentration at background plus three standard deviations of the background, LODs for different runs are dependent on the CV of the background. Over several experiments with typical background variances, sub-femtomolar LODs of PSA in whole serum were maintained. For comparison, a leading commercial PSA assay (ADVIA Centaur, Siemens) reports an LOD of 3 pM (0.1 ng/mL) in human serum, and ultra-sensitive assays have been reported with LODs in the range of 10–30 fM17,26. The detection limit determined from the TNF-α digital ELISA was ~150 aM (2.5 fg/mL), corresponding to ~600 aM (10 fg/mL) in whole serum; the highest sensitivity commercially-available ELISA for TNF-α has an LOD of 21 fM (0.34 pg/mL) in serum (Supplementary Fig. 3). The zero concentration spike of target protein for both assays provide a useful negative control for these experiments: 25% serum contains millimolar concentrations of a wide variety of proteins, and very low concentrations of target protein can be detected above these high protein backgrounds. We also developed a proof-of-principle digital assay for DNA to show that low concentrations of nucleic acids can be detected without replication of the target (Supplementary Fig. 2).
Figure 3. Sub-femtomolar detection of proteins in serum using digital ELISA.
Plots of % active beads against analyte concentration for: (A) Human PSA spiked into 25% serum; and (B) Human TNF-α spiked into 25% serum. The concentrations plotted on the x-axes refer to the final concentration of spiked protein in the diluted sample. The plots on the left hand side show the assay response over the concentration range tested in log-log space. The plots on the right hand side show the assay response in the femtomolar range in linear-linear space to illustrate the limit of detection and linearity of response. Error bars are plotted as the standard deviation over three replicates. LODs were determined by extrapolating the concentration from the signal equal to background signal plus three standard deviations of the background signal; the dashed lines show the signal at the LOD.
The ability of digital ELISA to measure much lower concentrations of proteins compared to conventional ELISA derives from two effects: 1) the high sensitivity of SiMoA to enzyme label; and, 2) the low background signals that can be achieved by digitizing the detection of proteins. The sensitivity of any immunoassay is determined by the sensitivity of the detection technology to the label, the antibody affinity, the assay background, and the variance (%CV) of the background measurement27. SiMoA is very sensitive to enzyme labels (Figure 2) providing the basis for detecting sub-femtomolar concentrations of labeled proteins in digital ELISA. That said, for antibodies of given affinity, the sensitivity of the immunoassay will be determined by the assay background, and the high label sensitivity of SiMoA helps reduce this background. Control experiments have shown that backgrounds in digital ELISA arise from non-specific binding (NSB) of detection antibody and enzyme conjugate to the capture bead surface (Supplementary Table 2). As SiMoA provides superior label sensitivity over conventional assays, significantly less detection antibody (~1 nM) and enzyme conjugate (1–50 pM) are needed to detect binding events compared to conventional assays (labeling reagent concentrations ~10 nM). The decreased label concentration greatly reduces NSB to the capture surface, resulting in much lower background signals. For example, in the TNF-α and PSA digital ELISAs, the NSB levels were equivalent to the signal produced by 1.8 fM and 1.2 fM of target protein, respectively (Figure 3). The highest sensitivity commercial TNF-α assay has an NSB level equivalent to 85 fM of TNF-α (Supplementary Fig. 3), a factor of 50 higher than the digital ELISA. The ability to reduce backgrounds in digital ELISA by lowering the concentration of labeling reagents translates to immunoassays with better sensitivity than conventional assays.
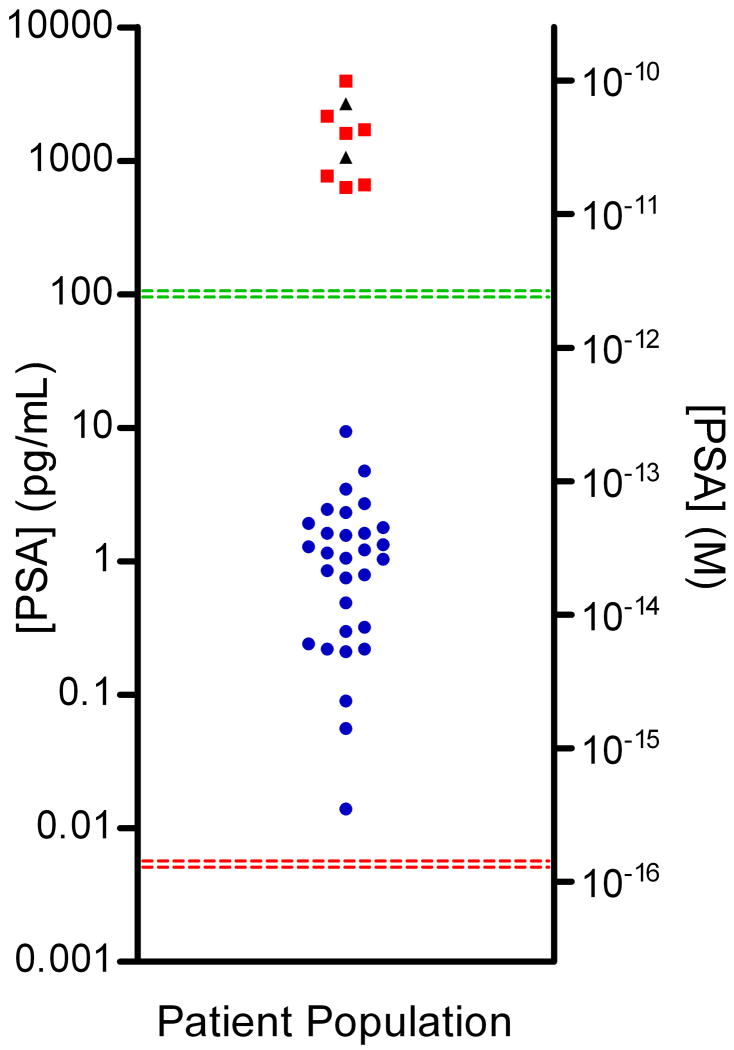
To demonstrate the possible diagnostic value of detecting very low concentrations of proteins in blood using digital ELISA, PSA was measured in serum samples from patients who had undergone radical prostatectomy (RP). PSA is a serum biomarker for prostate cancer used as both a screening tool and to monitor for recurrence in patients who have undergone radical prostatectomy28. After radical prostatectomy, the vast majority of PSA is eliminated, and levels fall below the detection limit of standard commercial assays (3 pM or 0.1 ng/mL). Regular monitoring of these patients for return of PSA can detect recurrence of prostate cancer, but several years may pass post-surgery for biochemical recurrence to be detected by current immunoanalyzers. The ability to accurately quantify PSA levels in post-prostatectomy patients at very low concentrations (<300 fM or 10 pg/mL) should provide early indication of recurrence if PSA levels increase17,29. Figure 4 shows PSA levels measured using digital ELISA in the serum of 30 patients (age 60–89) who had undergone radical prostatectomy and whose blood was collected at least six weeks post-surgery. The PSA levels in the sera of all 30 patients were below the detection limit of commercial assays. Whole serum samples were diluted 1:4 in buffer and measured using the PSA digital ELISA (Figure 3A). PSA was successfully detected in all 30 patients using digital ELISA, with concentrations ranging from 14 fg/mL to 9.4 pg/mL, with an average of 1.5 pg/mL. Further clinical studies are required to establish the diagnostic benefit of measuring PSA at fg/mL levels in RP patients.
Figure 4. Digital detection of PSA in serum samples of patients who had undergone radical prostatectomy.
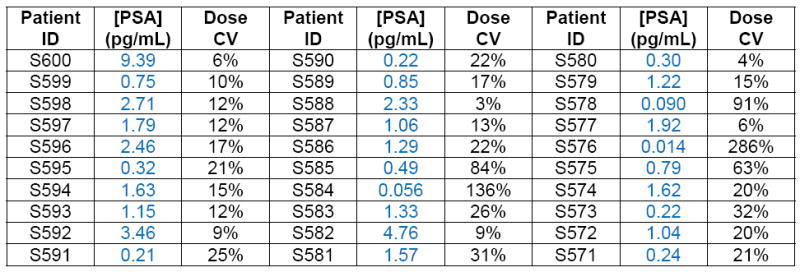
Concentrations of PSA in serum samples from RP patients ( ), healthy control samples (
 ), and Bio-Rad PSA control samples (▲) determined using digital ELISA. RP patient samples (SeraCare Life Sciences, Milford, MA) all had undetectable PSA levels as measured by a leading clinical diagnostic assay (ADVIA Centaur); the green line represents the detection limit of the ADVIA Centaur PSA assay (100 pg/mL or 3 pM). All 30 patient samples were above the detection limit of the PSA digital ELISA, shown by the red line (0.006 pg/mL or ~200 aM), with the lowest patient PSA concentrations measured at 0.014 pg/mL (~400 aM) using digital ELISA. Patient samples with the lowest PSA levels were detectable, but approached the LOD of the assay resulting in a large imprecision in the concentration determined (high dose %CV). The digital ELISA was validated for specificity to PSA using control standards (Bio-Rad) and serum from healthy individuals (ProMedDx) that had been assayed using the ADVIA Centaur PSA assay (See Supplementary Table 3).
By isolating and detecting single immunocomplexes in arrays of femtoliter wells, digital ELISA has enabled the measurement of clinically important proteins in serum at sub-femtomolar concentrations. We believe that the improvement in sensitivity shown by digital ELISA over previously reported approaches will translate into diagnostic benefits. For example, PSA levels in nine of the thirty RP samples determined in this work fell below the LOD of the previously highest sensitivity PSA assay based on nanoparticle labels17. An attractive feature of this approach is the ability to directly use reagents developed for standard ELISA to provide significant improvements in sensitivity. We continue to improve the SiMoA technology in two key areas. First, potentially two more logs of sensitivity in detection of proteins are available based on the sensitivity to enzyme label (Figure 2), if non-specific interactions that cause background signals could be minimized. The ability to isolate and interrogate single molecules on individual beads provides avenues for distinguishing antibody-antigen binding events from non-specifically bound complexes. Second, we are simplifying the logistics of the assays. Even in its present form, however, we believe that digital ELISA has the potential to facilitate the early diagnosis and treatment of disease.
METHODS
Materials
Optical fiber bundles were purchased from Schott North America (Southbridge, MA). Non-reinforced gloss silicone sheeting was obtained from Specialty Manufacturing (Saginaw, MI). Hydrochloric acid, anhydrous ethanol, and molecular biology grade Tween-20 were all from Sigma-Aldrich (Saint Louis, MO). 2.7-μm-diam. carboxyl-terminated magnetic beads were purchased from Varian, Inc. (Lake Forest, CA). Monoclonal anti-human TNF-α capture antibody, polyclonal anti-human TNF-α detection antibody, and recombinant human TNF-α were purchased from R&D Systems (Minneapolis, MN). Monoclonal anti-PSA capture antibody, monoclonal anti-PSA detection antibody, and purified PSA were purchased from BiosPacific (Emeryville, CA); the detection antibody was biotinylated using standard methods. 1-ethyl-3-(3-dimethylaminopropyl) carbodiimide hydrochloride (EDC), N-hydroxysulfosuccinimide (NHS), and SuperBlock® T-20 Blocking Buffer were purchased from Thermo Scientific (Rockford, IL). Purified DNA was purchased from Integrated DNA Technologies (Coralville, IA). Streptavidin-β-galactosidase (SβG) was conjugated in house using standard protocols. Resorufin-β-D-galactopyranoside (RGP) was purchased from Invitrogen (Carlsbad, CA). The fiber polisher and polishing consumables were purchased from Allied High Tech Products (Rancho Dominguez, CA).
Preparation of magnetic beads presenting biotin-labeled DNA and capture of enzyme conjugate (Figure 2)
Beads functionalized with DNA capture probe (5’-NH2/C12-GTT GTC AAG ATG CTA CCG TTC AGA G-3’) were prepared according to the manufacturer’s instructions. These beads were incubated with 1 μM of biotinylated complementary DNA (5’-biotin-C TCT GAA CGG TAG CAT CTT GAC AAC-3’) overnight (16 h) in TE buffer containing 0.5M NaCl and 0.01% Tween-20. After incubation, the beads were washed three times in PBS buffer containing 0.1% Tween-20. The bead stock was distributed into a microtiter plate giving 400,000 beads per well in 100 μL. The buffer was aspirated from the microtiter plate wells, the beads were resuspended and incubated with various concentrations of SβG in Superblock containing 0.05% Tween-20 for 5 h. The beads were then separated and washed six times with 5× PBS buffer containing 0.1% Tween-20. For detection of enzyme, the beads were either: a) resuspended in 20 μL of PBS containing 0.1% Tween-20, and 10 μL aliquots were loaded onto two femtoliter well arrays for SiMoA detection, or; b) resuspended in 100 μL of 100 μM RGP in PBS, incubated for 1 h at 23 °C, and read on a fluorescence plate reader (Infinite M200, Tecan).
Capture of proteins on magnetic beads and formation of enzyme-labeled immunocomplex (Figures 3 and 4)
Beads functionalized with an antibody to the target protein were prepared according to the manufacturer’s instructions. 100-μL test solutions containing the protein of interest were incubated with suspensions of 200,000 magnetic beads for 2 h at 23 °C. The beads were then separated and washed three times in PBS and 0.1% Tween-20. The beads were resuspended and incubated with solutions containing detection antibody (typically around 1 nM) for 45 min at 23 °C. The beads were then separated and washed three times in PBS and 0.1% Tween-20. The beads were incubated with solutions containing SβG (1–50 pM) for 30 min at 23 °C, separated, and washed six times in PBS and 0.1% Tween-20. The beads were then resuspended in 10 μL of PBS and loaded onto a femtoliter well array. The total time of the assay was ~6 h.
Capture of DNA on magnetic beads and formation of enzyme-labeled complex (Supplementary Figure 2)
200,000 beads functionalized with DNA capture probe were incubated with 100-μL solutions containing the target DNA (5’-TT GAC GGC GAA GAC CTG GAT GTA TTG CTC C TCT GAA CGG TAG CAT CTT GAC AAC-3’) for 2 h. After incubation, the DNA target solution was removed and the beads were washed three times in 0.2× SSC buffer containing 0.1% Tween-20. The beads were then resuspended and mixed with 10 nM biotinylated signal probe (5’-TAC ATC CAG GTC TTC GCC GTC AA/Biotin/-3’) that is also specific to the target DNA for 1 h. The beads were then washed three times in 0.2× SSC buffer containing 0.1% Tween-20 after removing the signal probe. A solution of 10 pM SβG was then added to the bead pellet, resuspended, and mixed for 1 h. The beads were separated and washed six times in 5× PBS buffer containing 0.1% Tween-20. The beads were then resuspended in 10 μL of PBS and loaded onto a femtoliter well array.
Preparation of femtoliter well arrays
Optical fiber bundles approximately 5-cm long were sequentially polished on a polishing machine using 30-, 9-, and 1-micron-sized diamond lapping films. The polished fiber bundles were chemically etched in a 0.025 M HCl solution for 130 seconds, and then immediately submerged into water to quench the reaction. The etched fibers were sonicated for 5 s in water, washed in water for 5 min, and dried under vacuum. The differential etch rate of the core and cladding glass of the fiber bundle arrays caused 4.5-μm diameter wells to formed in the core fibers30. Different etch times resulting in different well depths were initially investigated. If wells were too deep, then multiple beads were deposited in each well and sealing was disrupted; if wells were too shallow, then the beads were not retained in the wells and poor loading efficiencies were observed. Well depths of 3.25±0.5 μm were optimal for retaining single beads in wells while maintaining good seals.
Loading of beads into femtoliter well arrays
A short length of PVC tubing was placed on the etched end of a fiber bundle to create a reservoir to hold the bead solution. 10 μL of the concentrated bead solution was pipetted into this reservoir. The fiber bundle was then centrifuged at 1300 g for 10 min to force the beads into the etched wells. The PVC tubing was removed after centrifugation. The fiber bundle was dipped in PBS solution to wash off excess bead solution and the surface was swabbed with deionized water. In addition to well depth (see above), bead concentration was an important parameter for maximizing bead loading efficiencies. Above concentrations of 200,000 beads per 10 μL loaded, typically 40–60% of wells in a 50,000-well array were occupied by a single bead, resulting in % active beads with acceptable Poisson noise. At concentrations below 200,000 beads per 10 μL loaded, bead loading efficiency dropped, resulting in fewer active beads and higher Poisson noise. In these experiments, therefore, at least 200,000 beads per reaction were used and loaded onto the arrays.
Detection of beads and enzyme-labeled beads in femtoliter well arrays
A custom-built imaging system containing a mercury light source, filter cubes, objectives, and a CCD camera was used for acquiring fluorescence images.21,23 Fiber bundles were mounted on the microscope stage using a custom fixture. A droplet of β-galactosidase substrate (RGP) was placed on the silicone gasket material, and placed in contact with the well arrays. A precision mechanical platform moved the silicone sheet into contact with the end of the fiber bundle, creating an array of isolated femtoliter reaction vessels. Fluorescence images were acquired (558 nm excitation; 577 nm emission) with an exposure time of 1011 ms. Five frames (at 30 s intervals) were taken for each femtoliter well array. The product of the enzymatic reaction used in these studies—resorufin—has high photostability with a low photobleaching rate (rate of photobleaching, kph = 0.0013 s−1)21, making multiple exposures possible. We performed time-course fluorescence measurements to allow: a) stable fluorescent artifacts to be removed from images; and, b) to ensure that the signal from a beaded well was from an enzyme. For a), the first fluorescent image was subtracted from fluorescent images acquired at each subsequent time point. This process removed light intensity that did not change with time, e.g., fluorescence from dust and scattered light. For b), a positive or “on” well was identified only where fluorescence intensity in a beaded well increased in every frame, and by at least 20% over four frames. This process removed false positives from random changes in fluorescence during image acquisition. Supplemental Figure 1 shows histograms of fluorescence from wells with and without enzymes, showing the good distinction between “on” and “off” wells. Arrays were also imaged with white light to identify those wells that contain beads. After acquiring the fluorescence images, the arrays were illuminated with white light and imaged on the CCD camera. Due to scattering of light by the beads, those wells that contained a bead appeared brighter in the image than wells without beads. The fluorescence and white light images were analyzed using customized software.
Supplementary Material
Acknowledgments
The project described was supported by Award Number R43CA133987 from the National Cancer Institute. The content is solely the responsibility of the authors and does not necessarily represent the official views of the National Cancer Institute or the National Institutes of Health.
Footnotes
Author Contributions D.M.R., C.W.K., D.R.F., D.R.W, and D.C.D. conceived the approach. D.R.F. built the imaging system. D.M.R., C.W.K., T.G.C., S.C.H., L.S., P.P.P., A.J.R., E.P.F., J.D.R., and G.K.P conducted the experiments. T.P. wrote the image analysis software. L.C. prepared reagents. D.M.R. and D.C.D. wrote the manuscript. All authors were involved in designing experiments, reviewing and discussing data, and commented on the manuscript.
Supplementary Information is available on the Nature Biotechnology website.
Competing Financial Interests All authors are employees or advisors of Quanterix Corporation and have a minority ownership or ownership option position in the company.
References
- 1.Tessler LA, Reifenberger JG, Mitra RD. Protein Quantification in Complex Mixtures by Solid Phase Single-Molecule Counting. Analytical Chemistry. 2009;81:7141–7148. doi: 10.1021/ac901068x. [DOI] [PubMed] [Google Scholar]
- 2.Todd J, et al. Ultrasensitive flow-based immunoassays using single-molecule counting. Clinical Chemistry. 2007;53:1990–1995. doi: 10.1373/clinchem.2007.091181. [DOI] [PubMed] [Google Scholar]
- 3.Gosling JP. A DECADE OF DEVELOPMENT IN IMMUNOASSAY METHODOLOGY. Clinical Chemistry. 1990;36:1408–1427. [PubMed] [Google Scholar]
- 4.Wild D. The Immunoassay Handbook, 3rd Edition. Third Edition. Elsevier; 2005. p. 930. [Google Scholar]
- 5.Zhang HQ, Zhao Q, Li XF, Le XC. Ultrasensitive assays for proteins. Analyst. 2007;132:724–737. doi: 10.1039/b704256f. [DOI] [PubMed] [Google Scholar]
- 6.Giljohann DA, Mirkin CA. Drivers of biodiagnostic development. Nature. 2009;462:461–464. doi: 10.1038/nature08605. [DOI] [PMC free article] [PubMed] [Google Scholar]
- 7.Srinivas PR, Kramer BS, Srivastava S. Trends in biomarker research for cancer detection. Lancet Oncology. 2001;2:698–704. doi: 10.1016/S1470-2045(01)00560-5. [DOI] [PubMed] [Google Scholar]
- 8.Galasko D. Biomarkers for Alzheimer’s disease - Clinical needs and application. Journal of Alzheimer’s Disease. 2005;8:339–346. doi: 10.3233/jad-2005-8403. [DOI] [PubMed] [Google Scholar]
- 9.de Jong D, Kremer BPH, Olde Rikkert MGM, Verbeek MM. Current state and future directions of neurochemical biomarkers for Alzheimer’s disease. Clinical Chemistry and Laboratory Medicine. 2007;45:1421–1434. doi: 10.1515/CCLM.2007.320. [DOI] [PubMed] [Google Scholar]
- 10.Barletta JM, Edelman DC, Constantine NT. Lowering the Detection Limits of HIV-1 Viral Load Using Real-Time Immuno-PCR for HIV-1 p24 Antigen. American Journal of Clinical Pathology. 2004;122:20–27. doi: 10.1309/529T-2WDN-EB6X-8VUN. [DOI] [PubMed] [Google Scholar]
- 11.Adler M, Wacker R, Niemeyer CM. Sensitivity by combination: immuno-PCR and related technologies. Analyst. 2008;133:702–718. doi: 10.1039/b718587c. [DOI] [PubMed] [Google Scholar]
- 12.Nam JM, Thaxton CS, Mirkin CA. Nanoparticle-based bio-bar codes for the ultrasensitive detection of proteins. Science. 2003;301:1884–1886. doi: 10.1126/science.1088755. [DOI] [PubMed] [Google Scholar]
- 13.Armani AM, Kulkarni RP, Fraser SE, Flagan RC, Vahala KJ. Label-Free, Single-Molecule Detection with Optical Microcavities. Science. 2007;317:783–787. doi: 10.1126/science.1145002. [DOI] [PubMed] [Google Scholar]
- 14.Cui Y, Wei QQ, Park HK, Lieber CM. Nanowire nanosensors for highly sensitive and selective detection of biological and chemical species. Science. 2001;293:1289–1292. doi: 10.1126/science.1062711. [DOI] [PubMed] [Google Scholar]
- 15.Gaster RS, et al. Matrix-insensitive protein assays push the limits of biosensors in medicine. Nat Med. 2009;15:1327–1332. doi: 10.1038/nm.2032. [DOI] [PMC free article] [PubMed] [Google Scholar]
- 16.Fan R, et al. Integrated barcode chips for rapid, multiplexed analysis of proteins in microliter quantities of blood. Nat Biotech. 2008;26:1373–1378. doi: 10.1038/nbt.1507. [DOI] [PMC free article] [PubMed] [Google Scholar]
- 17.Thaxton CS, et al. Nanoparticle-based bio-barcode assay redefines “undetectable” PSA and biochemical recurrence after radical prostatectomy. Proceedings of the National Academy of Sciences of the United States of America. 2009;106:18437–18442. doi: 10.1073/pnas.0904719106. [DOI] [PMC free article] [PubMed] [Google Scholar]
- 18.Bao YP, et al. Detection of Protein Analytes via Nanoparticle-Based Bio Bar Code Technology. Analytical Chemistry. 2006;78:2055–2059. doi: 10.1021/ac051798d. [DOI] [PubMed] [Google Scholar]
- 19.Anderson NL, Anderson NG. The human plasma proteome: history, character, and diagnostic prospects. Molecular Cell Proteomics. 2002;1:845–867. doi: 10.1074/mcp.r200007-mcp200. [DOI] [PubMed] [Google Scholar]
- 20.Gorris HH, Rissin DM, Walt DR. Stochastic inhibitor release and binding from single-enzyme molecules. Proceedings of the National Academy of Sciences. 2007;104:17680–17685. doi: 10.1073/pnas.0705411104. [DOI] [PMC free article] [PubMed] [Google Scholar]
- 21.Rissin DM, Gorris HH, Walt DR. Distinct and Long-Lived Activity States of Single Enzyme Molecules. Journal of the American Chemical Society. 2008;130:5349–5353. doi: 10.1021/ja711414f. [DOI] [PubMed] [Google Scholar]
- 22.Rissin DM, Walt DR. Digital Readout of Target Binding with Attomole Detection Limits via Enzyme Amplification in Femtoliter Arrays. Journal of the American Chemical Society. 2006;128:6286–6287. doi: 10.1021/ja058425e. [DOI] [PubMed] [Google Scholar]
- 23.Rissin DM, Walt DR. Digital Concentration Readout of Single Enzyme Molecules Using Femtoliter Arrays and Poisson Statistics. Nano Letters. 2006;6:520–523. doi: 10.1021/nl060227d. [DOI] [PubMed] [Google Scholar]
- 24.Tan W, Yeung ES. Monitoring the Reactions of Single Enzyme Molecules and Single Metal Ions. Analytical Chemistry. 1997;69:4242–4248. [Google Scholar]
- 25.Rissin DM, Walt DR. Duplexed sandwich immunoassays on a fiber-optic microarray. Analytica Chimica Acta. 2006;564:34–39. doi: 10.1016/j.aca.2005.10.012. [DOI] [PubMed] [Google Scholar]
- 26.Ferguson R, Yu H, Kalyvas M, Zammit S, Diamandis E. Ultrasensitive detection of prostate-specific antigen by a time- resolved immunofluorometric assay and the Immulite immunochemiluminescent third-generation assay: potential applications in prostate and breast cancers. Clin Chem. 1996;42:675–684. [PubMed] [Google Scholar]
- 27.Jackson TM, Ekins RP. Theoretical limitations on immunoassay sensitivity. Current practice and potential advantages of fluorescent Eu3+ chelates as non-radioisotopic tracers. Journal of Immunological Methods. 1986;87:13–20. doi: 10.1016/0022-1759(86)90338-8. [DOI] [PubMed] [Google Scholar]
- 28.Bock JL, Klee GG. How sensitive is a prostate-specific antigen measurement? How sensitive does it need to be? Archives of Pathology & Laboratory Medicine. 2004;128:341–343. doi: 10.5858/2004-128-341-HSIAPA. [DOI] [PubMed] [Google Scholar]
- 29.Trock BJ, et al. Prostate cancer-specific survival following salvage radiotherapy vs observation in men with biochemical recurrence after radical prostatectomy. Jama-Journal of the American Medical Association. 2008;299:2760–2769. doi: 10.1001/jama.299.23.2760. [DOI] [PMC free article] [PubMed] [Google Scholar]
- 30.Pantano P, Walt DR. Ordered Nanowell Arrays. Chemistry of Materials. 1996;8:2832–2835. [Google Scholar]
Associated Data
This section collects any data citations, data availability statements, or supplementary materials included in this article.


