

Abstract
To investigate mechanisms in outbred animals that increase propensity to consume ethanol, it is important to identify and characterize these animals before or at early stages in their exposure to ethanol. In the present study, different measures were examined in adult, Sprague-Dawley rats to determine whether they can predict long-term propensity to over-consume ethanol. Prior to consuming 9% ethanol with a two-bottle choice paradigm, rats were examined with the commonly-used behavioral measures of novelty-induced locomotor activity and anxiety, as assessed during 15 min in an open field activity chamber. Two additional measures, intake of a low 2% ethanol concentration or circulating triglyceride levels after a meal, were also examined with respect to their ability to predict chronic 9% ethanol consumption. The results revealed significant positive correlations across individual rats between the amount of 9% ethanol ultimately consumed and three of these different measures, with high scores for activity, 2% ethanol intake, and triglycerides identifying rats that consume 150% more ethanol than rats with low scores. Measurements of hypothalamic peptides that stimulate ethanol intake suggest that they contribute early to the greater ethanol consumption predicted by these high scores. Rats with high 2% ethanol intake or high triglycerides, two measures found to be closely related, had significantly elevated expression of enkephalin and galanin in the hypothalamic paraventricular nucleus (PVN) but no change in neuropeptide Y in the arcuate nucleus (ARC). This is in contrast to rats with high activity scores, which in addition to elevated PVN enkephalin expression showed enhanced neuropeptide Y in the ARC but no change in galanin. Whereas elevated enkephalin is a common characteristic related to all three predictors of chronic ethanol intake, the other peptides differentiate these predictors, with galanin enhanced with high 2% ethanol intake and triglyceride measures but neuropeptide Y related to activity.
Keywords: Ethanol, Prediction, Locomotor activity, Triglycerides, Enkephalin, Sprague-Dawley
Introduction
Substantial research efforts have been aimed at predicting individual differences in vulnerability to alcohol consumption. In outbred animals, this ability to predict allows researchers to determine, before alcohol abuse, any differences in brain mechanisms that may exist between animals prone to over-consuming ethanol and those relatively protected from this behavior. Studies examining possible predictors have linked measures of novelty-induced locomotor activity and anxiety to the consumption of ethanol, although some inconsistent results have been obtained. Outbred rats characterized by high locomotor activity compared to low activity scores in a novel open field are found to self-administer more ethanol or drink more 8% ethanol in a two-bottle choice paradigm (Bisaga and Kostowski, 1993; Nadal et al., 2002). Although not confirmed in all reports (Bienkowski et al., 2001; Koros et al., 1999), this positive relationship is supported by clinical studies showing novelty-seeking to be positively associated with alcohol dependence (Bardo et al., 1996). While anxiety in humans has also been associated with alcohol dependence (Marquenie et al., 2007), studies in rats have yielded mixed results. Selectively bred rats that show high anxiety in an open field are found to consume more ethanol at concentrations of 6% or 10% (Izidio and Ramos, 2007), but not at 2% or 4% (Da Silva et al., 2004). Further, studies in outbred rodents using an elevated plus maze have also demonstrated a positive relationship (Spanagel et al., 1995), although this was not confirmed in a recent study in Swiss mice (Correia et al., 2009).
In addition to these locomotor-based behaviors, there is evidence that some short-term consummatory behaviors may successfully predict ethanol intake. Consumption of or preference for sweet substances is found to be positively related to the intake of ethanol, in outbred as well as selectively-bred rats (Carroll et al., 2008; Gahtan et al., 1996; Gosnell and Krahn, 1992; Rogowski et al., 2002; Sinclair et al., 1992). There is also evidence that initial intake of ethanol when first available may also correlate with later ethanol intake during chronic access. In adolescent, Sprague-Dawley rats, ethanol consumed during day 3 of forced consumption is found to be positively correlated with the amount of 8% ethanol ingested during days 8–10 of the choice phase and also after deprivation (Schramm-Sapyta et al., 2008). Consistent with a variety of studies showing a positive relationship between the ingestion of fat and ethanol (Fisher and Gordon, 1985; Herbeth et al., 1988; Jones et al., 1982; Mitchell, 1985; Swinburn et al., 1998), outbred rats exhibiting a preference for or chronically maintained on a high-fat compared to a low-fat diet are later found to consume more ethanol (Carrillo et al., 2004; Krahn and Gosnell, 1991; Pekkanen et al., 1978). This positive association between these two consummatory behaviors is suggested to involve circulating lipids, in particular triglycerides (TG), which are increased by consumption of ethanol as well as fat (Chang et al., 2007a; Gaysinskaya et al., 2007; Leibowitz, 2007). The consumption of ethanol is found to be enhanced by a lipid emulsion (Carrillo et al., 2004), and it is reduced by a drug that lowers TG levels (Barson et al., 2009b). With evidence showing TG levels after a single, fat-rich meal to predict later consumption of a high-fat diet (Karatayev et al., 2009), we are led to consider the possibility that higher TG after a meal may be a hallmark of animals prone to over-consumption, not only of food but perhaps also of ethanol.
With such measures as activity level, anxiety, and consummatory behavior predicting subsequent ethanol intake in outbred animals, an important question is whether those identified by these behavioral indices as prone or resistant to future ethanol consumption exhibit disturbances in brain peptides that may contribute to their differential phenotype. Most investigations to date have examined these peptides in selectively-bred rodents. Compared to non-preferring animals, endogenous expression of the opioid, enkephalin (ENK), is found to be increased in the prefrontal, cingulate and cerebral cortices of ethanol-preferring rats (Fadda et al., 1999; Guitart-Masip et al., 2006; Marinelli et al., 2000) and also in the nucleus accumbens and caudate putamen of ethanol-preferring mice (Jamensky and Gianoulakis, 1999). While such studies of ENK measurements are lacking in the hypothalamus, the ENK analogue, D-Ala-Gly-Phe-Met-NH2 (DALA), is found to stimulate ethanol intake when injected in the hypothalamic paraventricular nucleus (PVN) similar to the nucleus accumbens (Barson et al., 2009a; Barson et al., 2010), supporting a role for this opioid peptide in the hypothalamus in promoting the over-consumption of ethanol. Another peptide transcribed in the hypothalamus, galanin (GAL), has been implicated in human alcoholism (Belfer et al., 2007; Belfer et al., 2006). While there is one study in the locus coeruleus showing no change in GAL expression in ethanol-preferring rats (Hwang et al., 2000), the injection of this peptide in the PVN stimulates ethanol intake in outbred rats (Rada et al., 2004; Schneider et al., 2007), suggesting that hypothalamic GAL may also be involved in promoting ethanol intake. With regard to measurements of neuropeptide Y (NPY) in the arcuate nucleus (ARC), studies in selectively-bred, ethanol-preferring rats compared to non-preferring rats have yielded mixed results, with some reporting an increase (Hwang et al., 1999), decrease (Hwang et al., 1999; Spence et al., 2005), or no difference (Caberlotto et al., 2001; Spence et al., 2005), depending on the lines examined. Thus, the literature identifies ENK, GAL and NPY as brain peptides that may be involved in driving ethanol intake.
Building on these studies, the present investigation in outbred, Sprague-Dawley rats was designed, first, to examine several possible predictors of ethanol consumption and, second, to explore possible neurochemical differences between those that are prone to or protected from future ethanol consumption. We chose to use two behavioral predictors previously tested in the literature, namely, locomotor activity and anxiety, and also examine two novel measures related to short-term, consummatory behaviors, namely, initial ethanol intake and TG levels after a fat-rich meal. Since ethanol is a calorie-containing food as well as a drug of abuse, we then measured hypothalamic expression of the orexigenic peptides, ENK, GAL and NPY, to determine whether differences in these endogenous peptides can be detected in outbred animals predicted to consume high versus low amounts of 9% ethanol. We hypothesized that the expression of these peptides known to stimulate ethanol intake would be elevated in the rats predicted by the different measures to over-consume ethanol.
Materials and methods
Subjects
Adult, male Sprague–Dawley rats (275–325 g, Charles River Laboratories International, Inc., Wilmington, MA) were housed individually, on a 12-hour reversed light/dark cycle. All animals were allowed 1 week to acclimate to their individual housing conditions, during which time they received ad libitum access to standard rodent chow (LabDiet Rodent Chow 5001, St. Louis, MO) and water, which was delivered via a plastic 8 oz water bottle at the top of the cage (PETCO Animal Supplies, Inc, San Diego, CA). The housing facility was fully accredited by AAALAC. Behavioral protocols were approved by the Rockefeller University Animal Care Committee and followed the NIH Guide for the Care and Use of Laboratory Animals. Adequate measures were taken to minimize animal pain and discomfort.
Ethanol training
Rats were trained to consume ethanol by making it available, along with water, in an additional 8 oz bottle at the top of the cage (PETCO Animal Supplies, Inc, San Diego, CA), with the relative position of the water and ethanol bottles alternated each day to prevent place preference. Access to the ethanol-containing bottle was provided for 12 hours each day, with ethanol presented at dark onset. The concentration of ethanol was increased stepwise, every 4 days, from 1% to 2%, 4%, 7%, and then 9% v/v.
High-fat diet
The high-fat diet used in this report has been described in detail in previous publications (Dourmashkin et al., 2006; Leibowitz et al., 2004a). The constituents were fat from 75% lard (Armour) and 25% vegetable oil (Crisco), carbohydrate from 30% dextrin, 30% cornstarch (ICN Pharmaceuticals), and 40% sucrose (Domino), and protein from casein (Bioserv) and 0.03% L-cysteine hydrochloride (ICN Pharmaceuticals). This solid diet was supplemented with minerals (USP XIV Salt Mixture Briggs; ICN Pharmaceuticals) and vitamins (Vitamin Diet Fortification Mixture; ICN Pharmaceuticals). The macronutrient composition of the diet was calculated as percentage of total kcal, with the diet containing 50% fat, 25% carbohydrate, and 25% protein (5.2 kcal/g).
Experimental procedures
Experiment 1 was designed to confirm the ability of some commonly-used, non-consummatory measures to predict later 9% ethanol consumption. Rats (N=14) underwent tests of anxiety and novelty-induced locomotion. During the dark period, each rat was moved from the vivarium to a sound-attenuated room. Within this room, the rat was placed for 15 minutes in a 17.0″ × 17.0″ (43.2 cm × 43.2 cm) activity test chamber (Med Associates, Inc., St. Albans, VT), with a red light shining into the center of the chamber, and its movements within this 15-min period were recorded. Activity counts were quantified as the number of infrared beam breaks, and time spent in the center versus periphery was recorded as a measure of anxiety. After completion of these tests, the animals were trained to consume 9% ethanol as described above. Daily intake was measured during four days of 9% access and averaged together as the measure of 9% ethanol intake. The ethanol preference ratio was calculated for each of the four days and averaged together as the measure of ethanol preference.
Experiment 2 attempted to establish a novel, early ethanol intake measure as a predictor of later 9% ethanol consumption. A separate group of rats (N=30) was trained to consume ethanol. Daily intake and preference was recorded, with the four days of measurements for each concentration (1%, 2%, 4%, 7%, and 9% v/v) averaged together as the measures for each concentration. This procedure was replicated with an additional group of rats (N=30) to confirm the results of this novel method.
Experiment 3 further determined whether a measure related to a fat-rich meal, which avoids any ethanol exposure, can predict later consumption of 9% ethanol, similar to its ability to predict later food intake (Karatayev et al., 2009). Rats (N=18) were tested for their TG response to consumption of dietary fat. For 3 days, they were acclimated to this procedure by being given a daily 15-kcal, 50% high-fat meal for 1 h, with lab chow removed. Then, for the following 3 days, chow was removed at dark onset, the rats 1 h later were given a 15-kcal high-fat meal for 1 h, and then tail vein blood was sampled for measurement of serum TG. The TG values over the 3 days were averaged together for a measure of fat-induced TG. Following these procedures, the rats were trained to consume 9% ethanol. This procedure was replicated with an additional group of rats (N=18) to confirm the results of this novel method.
Experiment 4 was designed to determine whether the successful predictors of 9% ethanol consumption, novelty-induced locomotor activity, 2% ethanol intake, and fat-induced TG, showed some relationship when examined in the same animals. On day 1, the rats (N=24) were tested for 15 min in an activity chamber, as in Experiment 1. On days 2–4, animals were acclimated to the high-fat meal, and on days 5–7, they were tested for fat-induced TG as in Experiment 3. Starting on day 8, animals were given access to 1% ethanol to train them to consume ethanol, and on days 12–15, their intake of and preference for 2% ethanol was measured.
Experiment 5 examined the expression of different peptides in the hypothalamus, to determine if they are differentially expressed and thus may contribute to the different patterns of ethanol consumption. The rats (N=45) were separated into three groups, tested for the significant predictors of ethanol intake, and were examined using quantitative real-time polymerase chain reaction (qRT-PCR) for their expression of ENK and GAL mRNA in the PVN and NPY in the ARC. Although changes in mRNA are not always accompanied by similar changes in peptide levels, this has generally been found to occur in studies of PVN ENK (Chang et al., 2007a; Chang et al., 2007b), PVN GAL (Leibowitz et al., 2003; Tang et al., 1997; Villar et al., 1990), and ARC NPY (Wang et al., 1999; Wang et al., 1997). In group 1, animals (N=15) were tested for differences in locomotor activity as in Experiment 1, subgrouped as “high activity” or “low activity” (n=5/group) as described below in Data analysis, and then sacrificed 1 h after testing. In group 2, animals (N=15) were trained to consume 2% ethanol as in Experiment 2, ranked according to their 4-day intake and subgrouped as high or low 2% drinkers (n=5/group) (see Data analysis), and then on day 5 of 2% access, were sacrificed after 1 h of ethanol-drinking. In group 3, animals (N=15) were tested for their fat-induced TG as in Experiment 3, ranked according to their 3-day TG levels and subgrouped as high or low TG levels (n=5/group) (see Data analysis), and on test day 4, were sacrificed 1 h after the 15 kcal high-fat meal.
Brain dissection
Immediately after sacrifice in Experiment 5, each brain was placed in a matrix slicing guide with the ventral surface facing up. A total of four coronal cuts, yielding three slices, were made. The first cut was made in the anterior middle optic chiasm (Bregma −0.8 mm), according to the atlas of Paxinos and Watson (1998). The second cut was made 1.0 mm caudal to this, yielding a slice used for microdissection of the PVN (Bregma −0.8 to −1.8 mm). A third slice, made 1.0 mm rostral to this, yielded a slice that was discarded. The fourth slice, 0.5 mm thick, was then used for microdissection of the ARC (Bregma − 1.8 to −2.8mm). These sections were placed on a glass slide and rapidly dissected under a microscope. The PVN, from the 1.0 mm slice (Bregma −0.8 to −1.8 mm), was dissected as an inverted isosceles triangle, 1.0 mm bilateral to the third ventricle and between the fornix structures (Chang et al., 2004). The ARC, from the 0.5 mm slice (Bregma −1.8 to −2.8mm), was dissected from the area adjacent to the bottom of the third ventricle, with the width from the border of the ventricle approximately 0.3 mm at the bottom narrowing to 0.1 mm at the top.
Quantitative real-time PCR
As previously described (Chang et al., 2004), total RNA from pooled microdissected samples was extracted with TRIzol reagent. RNA was treated with RNase-free DNase I before RT. For qRT-PCR, cDNA and minus RT were synthesized using an oligo-dT primer with or without SuperScript II Reverse Transcriptase. The SYBR Green PCR core reagents kit (Applied Biosystems, Foster City, CA) was used, with β-actin as an endogenous control. Several housekeeping genes, including β-actin, cyclophilin, and GAPDH, were assessed as endogenous controls, but β-actin produced the most stable results for our primers and cDNAs. qRT-PCR was performed in MicroAmp Optic 96-well Reaction Plates (Applied Biosystems). This was done on an ABI PRISM 7900 Sequence Detection system (Applied Biosystems), under the condition of 2 minutes at 50°C, 10 minutes at 95°C, and 40 cycles of 15 seconds at 95°C and 1 minute at 60°C. Each study consisted of 4 independent runs of qRT-PCR in triplicate, and each run included a standard curve, a nontemplate control, and a negative RT control. The levels of target gene expression were quantified relative to the level of β-actin, using the standard curve method. The primers, designed with ABI Primer Express V.1.5a software from published sequences, were: (1) β-actin: 5′-GGCCAACCGTGAAAAGATGA-3′ (forward) and 5′-CACAGCCTGGATGGCTACGT-3′ (reverse); (2) ENK: 5′-GGACTGCGCTAAATGCAGCTA-3′ (forward) and 5′-GTGTGCATGCCAGGAAGTTG-3′ (reverse); (3) GAL: 5′-TTCCCACCACTGCTCAAGATG-3′ (forward) and 5′-TGGCTGACAGGGTTGCAA-3′ (reverse); and (4) NPY: 5′-CACAGAAAATGCCCCCAGAA-3′ (forward) and 5′-GTCAGGAGAGCAAGTTTCATTTCC-3′ (reverse). The concentrations of primers were 100 nM. All reagents, unless indicated, were from Invitrogen (Carlsbad, CA).
Triglyceride assessment
Serum from tail vein was assayed for TG using a Triglyceride Assay kit (Sigma-Aldrich Co., St. Louis, MO).
Data analysis
For Experiments 1–4, which determined if certain behaviors were able to predict intake of ethanol and were themselves related, each behavior was correlated using a Pearson’s product moment coefficient, except for the activity data (Experiment 1) which failed the D’Agostino-Pearson K2 omnibus test for normality and thus was analyzed using a Spearman’s rank correlation. In addition, animals were rank-ordered according to their behavioral measures and then divided into subgroups from the bottom (lowest tertile; “low” group) and top (highest tertile; “high” group) according to their rank. For qRT-PCR, mRNA measures for high scorers were calculated as a percentage of low scorers. Differences between the various measures in these subgroups, including the hypothalamic peptides examined in Experiment 5, were tested using Student’s unpaired two-tailed t-tests, as all of these data passed the test for normality. All data are expressed as mean ± SEM.
Results
Experiment 1: Prediction of ethanol intake by novelty-induced locomotor activity and anxiety
This experiment was performed to confirm the ability of some commonly-used, non-consummatory measures, novelty-induced locomotor activity and anxiety, to predict later 9% ethanol consumption. Novelty-induced locomotion, as measured by ambulatory counts in 15 min, correlated significantly with 9% ethanol intake (N=14, r=+0.64, p<0.05) (Fig. 1A) and preference (r=+0.73, p<0.01). Thus, rats ranked as high activity compared to low activity rats (n=5/group, 990 ± 27 vs. 565 ± 19 counts) consumed significantly more ethanol (2.53 ± 0.25 vs. 0.99 ± 0.32 g/kg/day, p<0.01) (Fig. 1B) and showed significantly greater ethanol preference (0.38 ± 0.04 vs. 0.13 ± 0.05, p<0.01). In contrast, time spent in the center of the activity chamber in this 15-min test did not significantly correlate with ethanol intake (N=14, r=−0.14, ns) or preference (r=−0.20, ns), and rats ranked as more anxious (n=5/group, 441 ± 20 vs. 652 ± 16 s in center) did not consume more ethanol than those ranked as less anxious (1.93 ± 0.49 vs. 1.65 ± 0.38 g/kg/day, ns) nor did they show greater ethanol preference (0.29 ± 0.09 vs. 0.24 ± 0.04, ns). Thus, novelty-induced locomotor activity, but not anxiety, may predict voluntary 9% ethanol intake.
Fig. 1.
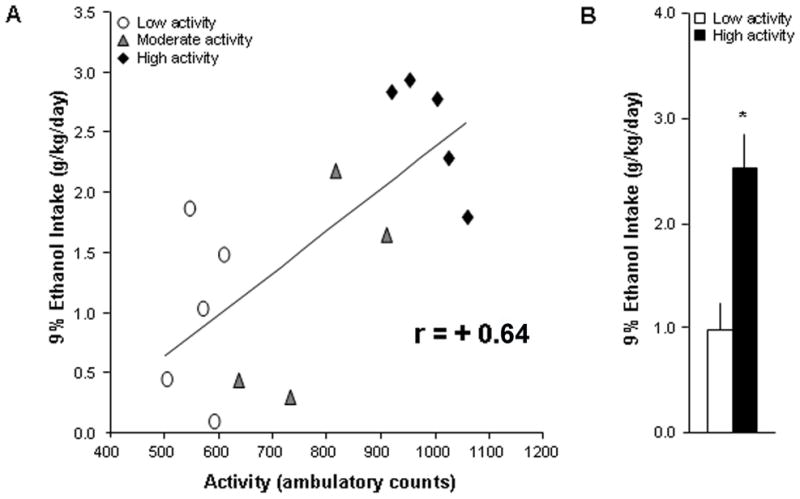
Novelty-induced locomotor activity is significantly related to 9% ethanol intake. (A) Novelty-induced locomotion correlated significantly with 9% ethanol intake (N=14, p<0.05). (B) Rats ranked as high activity compared to low activity (n=5/group, 990 ± 27 vs. 565 ± 19 counts) consumed significantly more 9% ethanol (p<0.01).
Experiment 2: Prediction of ethanol intake by low concentration ethanol intake
This experiment was performed to establish a novel, early predictor of chronic 9% ethanol drinking by examination of initial, short-term consumption of a low concentration of ethanol. Voluntary intake of 2% ethanol correlated significantly with 9% ethanol intake (N=30, r=+0.69, p<0.001) (Fig. 2A) and preference (r=+0.65, p<0.001). Additionally, preference for 2% ethanol correlated significantly with 9% ethanol intake (r=+0.68, p<0.001) and preference (r=+0.61, p<0.001). Furthermore, rats ranked as high 2% drinkers compared to low 2% drinkers (n=10/group, 0.77 ± 0.05 vs. 0.11 ± 0.02 g/kg/day) later consumed significantly more 9% ethanol (2.28 ± 0.2 vs. 0.90 ± 0.15 g/kg/day, p<0.001) (Fig. 2B) and showed significantly greater ethanol preference (0.33 ± 0.02 vs. 0.13 ± 0.02, p<0.001). These results were confirmed in a second group of rats, where intake of 2% ethanol again significantly correlated with 9% ethanol intake (N=30, r=+0.57, p<0.01). During the step-wise ethanol training, the 2% concentration was the earliest at which 9% consumption could be predicted, with consumption of 1% ethanol not significantly related to 9% ethanol intake (r=+0.26, ns) or preference (r=−0.08, ns). These results show that early, short-term consumption of a low ethanol concentration can predict a rat’s later propensity to consume a high concentration of ethanol.
Fig. 2.
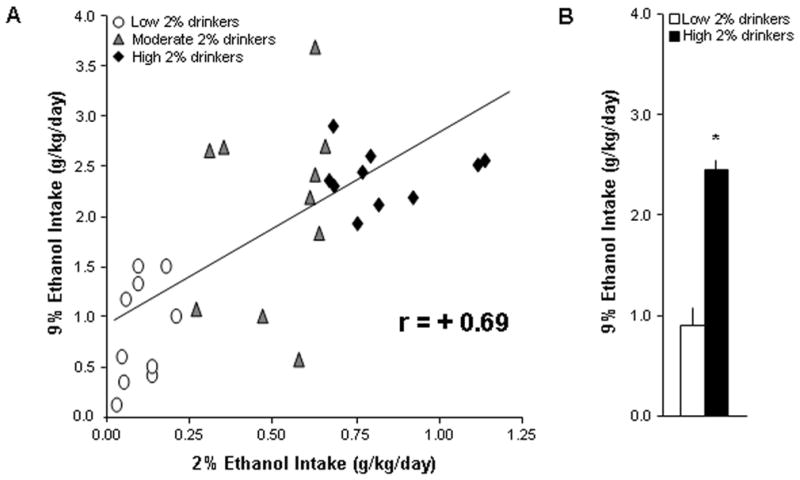
Voluntary intake of 2% ethanol is significantly related to 9% ethanol intake. (A) Intake of 2% ethanol correlated significantly with 9% ethanol intake (N=30, p<0.001). (B) Rats ranked as high 2% drinkers compared to low 2% drinkers (n=10/group, 0.77 ± 0.05 vs. 0.11 ± 0.02 g/kg/day) later consumed significantly more 9% ethanol (p<0.001).
Experiment 3: Prediction of ethanol intake by fat-induced triglyceride levels
Given the positive relationship that exists between the consumption of ethanol and a high-fat diet (see Introduction), Experiment 3 was performed to determine whether an acute, fat-related measure, which additionally avoids any ethanol exposure, might predict later 9% ethanol consumption. The results showed that levels of TG after a small high-fat meal correlate significantly with 9% ethanol intake (N=18, r=+0.68, p<0.001) (Fig. 3A) and preference (r=+0.63, p<0.01). Furthermore, rats ranked as high TG compared to low TG responders (n=6/group, 249 ± 13 vs. 90 ± 4 mg/dl) later consumed significantly more 9% ethanol (2.65 ± 0.32 vs. 1.14 ± 0.22 g/kg/day, p<0.01) (Fig. 3B) and showed significantly greater ethanol preference (0.41 ± 0.05 vs. 0.15 ± 0.03, p<0.001). These results were confirmed in a second group of rats, where levels of TG again significantly correlated with 9% ethanol intake (N=18, r=+0.56, p<0.01). These findings show fat-induced TG to be a strong predictor of 9% ethanol intake.
Fig. 3.
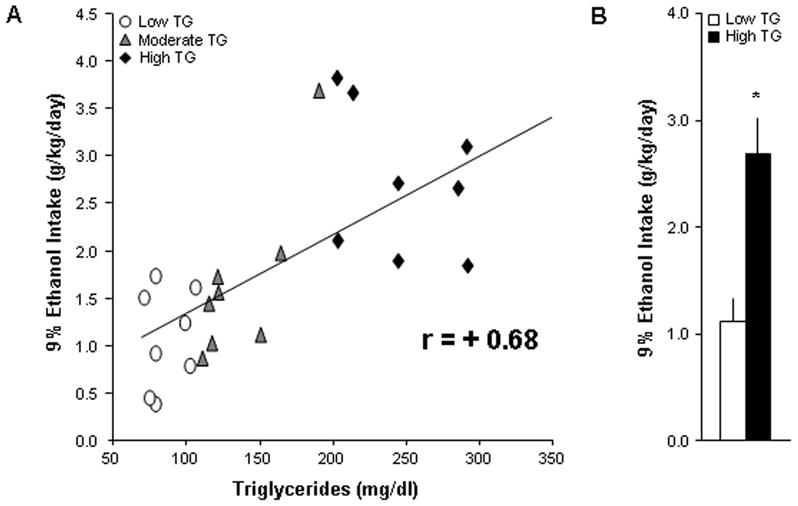
Levels of TG after a small high-fat meal are significantly related to 9% ethanol intake. (A) Levels of TG correlate significantly with 9% ethanol intake (N=18, p<0.001). (B) Rats ranked as high TG compared to low TG animals (n=6/group, 249 ± 13 vs. 90 ± 4 mg/dl) later consumed significantly more 9% ethanol (p<0.01).
Experiment 4: Correlation of prediction measures
Experiment 4 was performed to determine if the significant predictors of 9% ethanol consumption were evident in the same animals (N=24) and thus possibly related. Of the three successful predictors, the measures of 2% ethanol intake and fat-induced TG levels were found to be related to each other but not to novelty-induced locomotor activity (Fig. 4). A significant, positive correlation was obtained between the scores for 2% ethanol intake and preference (r=+0.94, p<0.001) and between 2% ethanol intake and TG levels (r=+0.50, p<0.05), whereas the scores for locomotor activity showed only weak correlations to the 2% ethanol intake (r=+0.11, ns) and TG (r=+0.32, ns) measures. Furthermore, rats classified as high TG compared to low TG responders (143 ± 6 vs. 71 ± 4 mg/dl) consumed significantly more 2% ethanol (0.19 ± 0.03 vs. 0.10 ± 0.03 g/kg/day, p<0.05) and showed significantly greater ethanol preference (0.62 ± 0.07 vs. 0.37 ± 0.09, p<0.05), and rats classified as high 2% drinkers compared to low 2% ethanol drinkers (0.26 ± 0.02 vs. 0.06 ± 0.01 g/kg/day) showed a strong trend of higher TG after a meal (118 ± 13 vs. 90 ± 11 mg/dl, p=0.10). This is in contrast to rats classified as high activity compared to low activity (1150 ± 31 vs. 443 ± 46 counts), which were not significantly different in their 2% ethanol intake (0.17 ± 0.04 vs. 0.16 ± 0.03 mg/kg/day, ns) or preference (0.53 ± 0.11 vs. 0.49 ± 0.09, ns) or TG levels (122 ± 13 vs. 97 ± 12 mg/dl, ns). Thus, while all of these measures predict 9% ethanol intake, the 2% drinking and TG responses are more closely related as predictors and may be evident in similar populations, with common underlying mechanisms.
Fig. 4.
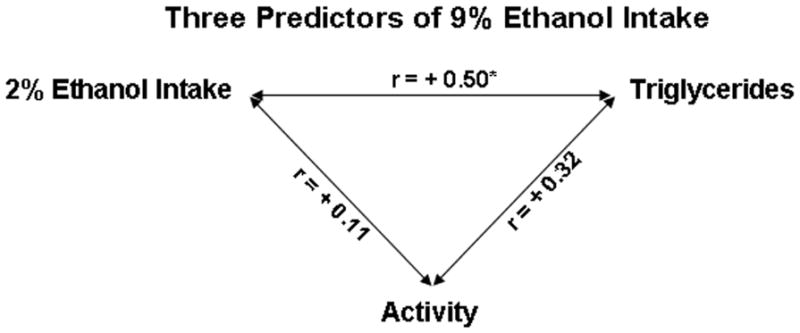
A significant, positive correlation was obtained between the scores for fat-induced TG and 2% ethanol intake (N=24, p<0.05), with only a weak correlation between locomotor activity and these two measures.
Experiment 5: Peptide expression in relation to predictors of ethanol consumption
Building on evidence suggesting a positive relationship between the hypothalamic peptides, ENK, GAL and NPY, and chronic consumption of ethanol (see Introduction), we tested whether the early predictors of ethanol intake are themselves related to disturbances in the expression of these endogenous peptides, just as they are with later consumption of ethanol. Experiment 5 tested animals with each of the successful predictors of 9% ethanol intake, as described in Experiments 1–3, and measured via qRT-PCR the expression of ENK and GAL mRNA in the PVN and NPY mRNA in the ARC as a function of the rats’ predicted propensity to over-consume ethanol. Three sets of animals were tested for novelty-induced activity, 2% ethanol intake, or fat-induced TG levels, and they were ranked and subgrouped (n=5/group) according to these measures as high activity versus low activity (986 ± 28 vs. 470 ± 93 counts), high 2% versus low 2% drinkers (0.76 ± 0.07 vs. 0.25 ± 0.08 g/kg/day), and high TG versus low TG (168 ± 15 vs. 63 ± 5 mg/dl). The peptide measurements revealed group differences for PVN ENK that were similar for all three predictors but differences for PVN GAL and ARC NPY that varied across the predictors (Fig. 5). Specifically, ENK mRNA levels in the PVN were significantly elevated in animals predicted to be high ethanol consumers by each of the three measures (p<0.001). However, GAL mRNA was increased in the PVN of rats predicted to be high ethanol drinkers by two of the measures, 2% ethanol intake (p<0.001) and TG levels (p<0.001), but was unaltered in animals predicted to consume more ethanol by the measure of locomotor activity (ns). Conversely, NPY mRNA in the ARC was elevated only in the rats with high scores for locomotor activity (p<0.05) but showed no group differences in relation to the 2% ethanol intake and TG predictors. These findings suggest the involvement of these three peptides in promoting ethanol intake in rats predicted to be high consumers and further suggest that the precise phenotype predicted by these different measures may involve different neurochemical substrates.
Fig. 5.
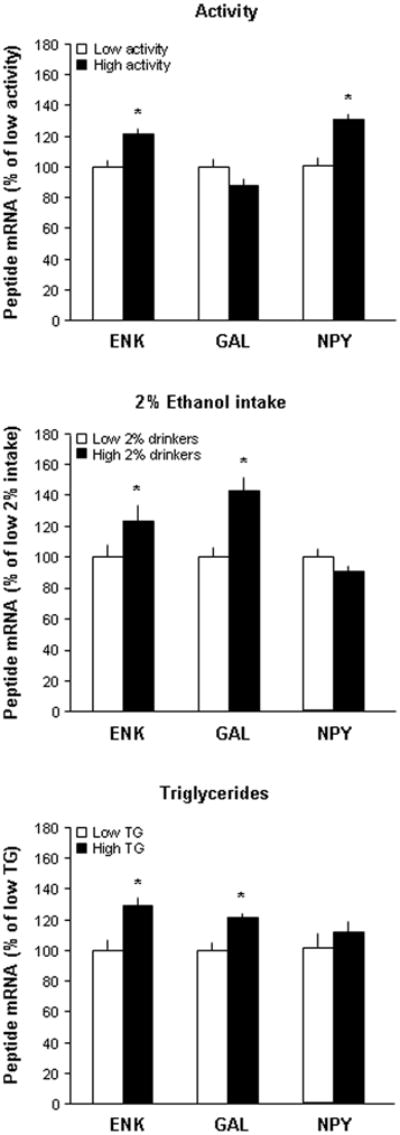
Animals predicted to consume high amounts of 9% ethanol showed different gene expression patterns depending on the predictor used. ENK mRNA levels in the PVN were significantly elevated in animals predicted to consume high amounts of 9% ethanol by each of the three measures (n=5/group), novelty-induced locomotor activity (p<0.001), 2% ethanol intake (p<0.001), and fat-induced TG (p<0.001). In contrast, GAL mRNA was significantly elevated in the PVN of rats with high scores for 2% ethanol intake and TG levels but not activity, while NPY mRNA was elevated in the ARC only in animals with high activity scores.
Discussion
Behavioral predictors of ethanol consumption
With many studies investigating mechanisms underlying individual differences in vulnerability to alcohol abuse, there is a strong need to identify predictors that can reliably identify high-risk individuals prior to or at an early stage in the development of alcoholism. While the clinical literature reveals positive relationships between chronic alcohol intake and certain behavioral measures, such as novelty-seeking and anxiety (Bardo et al., 1996; Marquenie et al., 2007), studies in selectively bred and outbred rats have yielded mixed results with these behaviors (see Introduction). In the present study, we investigated this relationship further in outbred, Sprague-Dawley rats using measures of novelty-induced locomotor activity and anxiety and of ethanol intake using a 2-bottle choice paradigm that is routinely employed in our laboratory (Barson et al., 2010; Morganstern et al., 2010). In agreement with a report in outbred rats using operant ethanol self-administration (Nadal et al., 2002), the measure of locomotor activity significantly predicted consumption of and preference for 9% ethanol and allowed rats to be separated into high and low activity groups, with the high activity animals ultimately consuming 150% more ethanol than the low group. The measure of anxiety, in contrast, did not yield a significant relationship with or ability to predict future ethanol drinking, consistent with other studies in outbred animals (Correia et al., 2009). This outcome with the activity measure suggests that similar mechanisms may underlie locomotor activity in a novel environment and a propensity to consume ethanol. While ethanol itself generally suppresses activity (Criswell et al., 1994), a study in Wistar rats suggests that its effects differ in high versus low responders to novelty, with a low dose of ethanol enhancing activity only in the high responders (Gingras and Cools, 1996). Thus, rats displaying high novelty-induced locomotor activity may be more sensitive to some effects of ethanol and for that reason consume more ethanol. The association found between novelty-induced locomotion and ethanol intake in the present study substantiates the ability of a behavioral measure, one not involving ethanol exposure, to accurately identify rats that have an increased propensity to consume excess ethanol when it is chronically available.
Early ethanol intake as a predictor of ethanol consumption
There are additional studies suggesting that consummatory behavior itself may predict long-term patterns of ethanol consumption. This is seen with a measure of preference for sweet substances, which is positively associated with excessive ethanol consumption in both outbred and selectively-bred populations (Carroll et al., 2008; Gahtan et al., 1996). It is also observed with a chronic measure of preference for or intake of a fat-rich diet, which is positively associated with ethanol consumption in outbred rats (Carrillo et al., 2004; Krahn and Gosnell, 1991; Pekkanen et al., 1978). Surprisingly, there appear to be no studies in adult rats relating initial intake of ethanol when first available to later chronic ethanol consumption. There is only one study in adolescent rats, which showed a positive relationship between the amount of 10% ethanol consumed during an initial forced consumption period and subsequent amounts of 8% ethanol consumption in a two-bottle choice paradigm (Schramm-Sapyta et al., 2008). Consistent with this finding relating early to later patterns of ethanol intake, the present study in two separate groups of adult rats voluntarily consuming ethanol with increasing concentrations showed that their initial intake of 2% ethanol significantly predicted 9% ethanol consumption and preference. The variability of the scores for 2% ethanol intake allowed rats to be identified as high 2% drinkers that consumed 150% more of the 9% ethanol compared to the low 2% drinkers. This prediction was confirmed in a second test, establishing this measure in adult rats as a reliable predictor of subsequent ethanol over-consumption at higher concentrations. The measure of 2% ethanol intake specifically identified animals with an increased propensity to consume ethanol rather than fluid in general as reflected by the fact that the high consumers throughout these studies consistently showed a greater preference for ethanol than the low consumers. While Sprague-Dawley rats as a strain can detect differences between 2% and 8% ethanol, as indicated by a change in their preference for ethanol (Morrow et al., 1993; Tordoff et al., 2008), measures of neural activity in the nucleus of the solitary tract show similarities in their taste responsiveness to ethanol across these increasing concentrations (Lemon et al., 2004), which may underlie the ability of 2% ethanol consumption to predict intake of 9% ethanol.
Circulating TG as a predictor of ethanol consumption
In further tests, we examined the possibility that a metabolic signal, which is related to ethanol as well as dietary fat and is positively related to consummatory behavior, may itself be a reliable predictor of an animal’s propensity to consume ethanol. Our studies have shown that circulating TG are similarly stimulated by consumption of both ethanol and fat (Chang et al., 2007a; Leibowitz et al., 2003) and that rats with elevated TG after a fat-rich meal compared to low TG animals are hyperphagic, both during a subsequent single chow meal and chronically on a high-fat diet (Karatayev et al., 2009). Further, consumption of a small high-fat meal or injection of a lipid emulsion, which raise TG levels, stimulates the consumption of ethanol (Carrillo et al., 2004; Chang et al., 2007a; Chang et al., 2004), while a reduction of TG levels with gemfibrozil suppresses ethanol intake (Barson et al., 2009b). These positive relationships between TG levels and subsequent consummatory behavior encouraged us to consider the possibility that a measure of fat-induced TG may predict chronic patterns of ethanol consumption. This was demonstrated here in two separate groups. These tests revealed a significant positive relationship between TG levels and subsequent 9% ethanol intake and preference and showed the ability of elevated TG levels to identify rats that consume almost 150% more ethanol compared to rats with low TG levels. It is interesting to consider the possibility that a difference in lipid metabolism in outbred rats may underlie the positive relationship of fat-induced TG with high ethanol intake. This is consistent with the evidence for differences in hepatic ethanol metabolism between ethanol-preferring and non-preferring rats (Koivisto and Eriksson, 1994; Lodge and Lawrence, 2003).
Relationship between the different predictors of ethanol intake
The identification of three significant predictors of ethanol drinking, novelty-induced locomotor activity, intake of 2% ethanol, and fat-induced TG, raises a question as to whether these predictors are related to each other and evident in the same animals. When they were examined in a single group of rats, the results revealed a significant, positive correlation between the measures of 2% ethanol intake and TG levels. Thus, rats prone to drinking high amounts of 9% ethanol exhibited both greater intake of 2% ethanol and higher levels of TG after a meal, indicating that these two measures may have common mechanisms underlying their ability to predict the high-ethanol drinking phenotype. This is consistent with evidence showing that elevated TG levels like a fat-rich meal can stimulate ethanol intake (Carrillo et al., 2004) and that rats with higher meal-induced TG subsequently consume a larger meal (Karatayev et al., 2009). The third predictor of 9% ethanol consumption, novelty-induced locomotion, failed to correlate with these two measures, suggesting that it reflects different mechanisms underlying ethanol intake. This result is not unexpected, since a locomotor response in a novel environment is very different from the consummatory-related responses, 2% ethanol intake and fat-induced TG levels, that predict chronic intake of ethanol. Given the moderate levels of intake that occurred in these rats, these findings will not permit us to draw conclusions regarding ethanol dependence, particularly as high ethanol consumption does not necessarily lead to the development of compulsive drinking (Vengeliene et al., 2009).
Disturbances in orexigenic peptides in relation to predictors of ethanol intake
With these three different measures predicting chronic consumption of 9% ethanol, the next question is whether these predictors are associated with disturbances in hypothalamic peptides that, in turn, may contribute to the over-consumption of ethanol. Previous studies have shown the opioid ENK in the PVN to be positively related to circulating TG and to be stimulated by the injection of ethanol as well as ingestion of a high-fat diet (Chang et al., 2007a; Chang et al., 2004). It is also increased in rats that have higher TG levels after a fat-rich meal (Karatayev et al., 2009). When injected into the PVN, this peptide stimulates the consumption of ethanol as well as a high-fat diet (Barson et al., 2010; Naleid et al., 2007), suggesting the existence of a positive feedback loop between TG and ENK in controlling ethanol and fat intake. The present study provides further support for a stimulatory effect of this endogenous opioid on ethanol consumption. Rats with higher activity level, higher 2% ethanol intake, or higher TG levels, each of which predicts greater 9% ethanol intake, all exhibited increased expression of ENK in the PVN when compared to their respective groups with low predictor scores. While a novel environment or high-fat meal that increases TG can stimulate PVN ENK expression (Chang et al., 2007b; Chang et al., 2004; Yukhananov and Handa, 1997), it is unlikely that the tests directly affected our results, as all rats in the present experiment were exposed to the same conditions. Also, whereas the high 2% drinkers consumed more ethanol than the low 2% drinkers, this low concentration is unlikely to have any effect on ENK in the PVN, as demonstrated by a study showing little change in ENK in rats drinking 1 g/kg/day of 9% ethanol (Chang et al., 2007a). In addition to confirming the recent reports showing a positive relationship between ENK, TG and ethanol (Barson et al., 2009b; Chang et al., 2007a; Karatayev et al., 2009), the new finding that rats with high novelty-induced locomotor activity also exhibited elevated ENK in the PVN suggests that this opioid may be a common characteristic of animals prone to consuming greater 9% ethanol and a significant contributor to their overconsumption. Other studies, showing ethanol-preferring rats or mice to have elevated expression of ENK in the nucleus accumbens, caudate putamen and cortex (Fadda et al., 1999; Guitart-Masip et al., 2006; Jamensky and Gianoulakis, 1999; Marinelli et al., 2000), suggest that this opioid may function within multiple brain areas to stimulate ethanol intake in animals at risk.
In contrast to ENK, the results obtained with GAL revealed a difference between the three measures that predict ethanol intake. Like ENK, GAL in the PVN is stimulated by consumption of ethanol or a high-fat diet and also by injection of a lipid emulsion that elevates TG levels (Chang et al., 2004; Leibowitz et al., 2003; Leibowitz et al., 2004b), and this peptide when injected in the PVN stimulates ingestion of fat and ethanol (Schneider et al., 2007; Tempel et al., 1988). Consistent with this evidence, the present study demonstrated that rats consuming higher levels of 2% ethanol or with higher fat-induced TG also have elevated expression of GAL in the PVN, suggesting that this peptide may contribute to their over-consumption of 9% ethanol predicted by these measures. Since PVN GAL is inconsistently found to be stimulated by 1 g/kg/day or less of 9–10% ethanol (Chang et al., 2007a; Leibowitz et al., 2003), it cannot be entirely ruled out that the drinking of 2% ethanol produced this increase in GAL expression. Interestingly, rats identified by their higher activity level showed no difference in their PVN GAL compared to their low activity counterparts, indicating that this peptide may not be actively involved in the over-consumption predicted by this measure. This interpretation is consistent with the finding that transgenic mice that overexpress the GAL gene, while consuming more ethanol and fat compared to their wild-type controls (Karatayev et al., 2009), show no change in their locomotor activity in an open field (Kuteeva et al., 2005a, b). This indicates that the positive feedback loop, which relates TG and PVN GAL in the stimulation of ethanol and fat intake, may not be involved in promoting the ethanol consumption in rats showing high novelty-induced locomotor activity. Together with our finding that the measures of 2% ethanol and TG levels are closely related to each other but not to locomotor activity, these results suggest that the former two measures may share common mechanisms, while the latter predicts a somewhat different behavioral phenotype that involves the actions of ENK but not GAL.
As with GAL, the results with NPY were different between the measures that predict ethanol intake. Unlike ENK and GAL, the expression of NPY in the ARC is suppressed by a high-fat diet (Hansen et al., 2004; Wang et al., 2002) and unaffected by injection of a lipid emulsion (Chang et al., 2004) or chronic ethanol intake (Leibowitz et al., 2003). Whereas PVN injection of NPY has little effect on high-fat diet intake (Leibowitz and Alexander, 1991; Stanley et al., 1985), it is found to stimulate the consumption of ethanol (Gilpin et al., 2004; Kelley et al., 2001), despite the fact that mice that overexpress NPY have a lower preference for ethanol than controls (Thiele et al., 1998). In the present study, rats with greater locomotor activity in response to novelty demonstrated elevated NPY mRNA in the ARC, while those consuming higher levels of 2% ethanol or having higher TG levels showed no change in this peptide. The 2% ethanol exposure in this case probably did not affect levels of NPY, as rats that drink 0.8 g/kg/day of 10% ethanol show no change in ARC NPY expression (Leibowitz et al., 2003). The present evidence suggests that NPY may be a neurochemical marker that is specific to animals with higher activity and may help elucidate mechanisms that mediate the over-consumption predicted by this behavioral measure.
Neurocircuitry of peptide actions
Although the present study has focused on the hypothalamic actions of ENK, GAL and NPY in driving ethanol intake, these peptides are known to operate within multiple nuclei to affect a variety of behaviors, including locomotor activity in addition to different consummatory behaviors. The involvement of ENK and NPY in locomotion, possibly with different actions, is demonstrated by studies of ENK knockout mice, which exhibit increased locomotor activity in an open field (Konig et al., 1996), and of NPY knockouts, which show suppressed locomotor activity (Karl et al., 2008). Further, injection studies suggest that NPY increases locomotor activity in part through actions in the frontal cortex (Smialowska et al., 1994; Smialowski et al., 1992), while it may suppress activity through effects in the PVN (Lopez-Valpuesta et al., 1996; Tiesjema et al., 2007). This is in contrast to GAL, where studies with knockouts have shown no change in open field activity (Lu et al., 2008). All three peptides, however, are found to increase consummatory behaviors. Injection studies consistently reveal a stimulatory effect of these peptides on both food and ethanol intake and show these peptides to act in the PVN (Barson et al., 2010; Kelley et al., 2001; Schneider et al., 2007). In addition, extra-hypothalamic nuclei that mediate reward aspects of ethanol intake appear to be involved. The peptide ENK is believed to stimulate ethanol consumption by acting in both the nucleus accumbens (Barson et al., 2009a; Zhang and Kelley, 2002) and central nucleus of the amygdala (Foster et al., 2004; Kim et al., 2004). In the amygdala, GAL has a similar effect to ENK (Corwin et al., 1993; Smith et al., 1996), whereas NPY suppresses ethanol intake (Gilpin et al., 2008; Thorsell et al., 2007). These investigations underscore the fact that these peptides, in addition to acting in the hypothalamus to stimulate ethanol intake, have a variety of effects and different sites of action that need to be considered in studies of animals prone to drinking high amounts of ethanol, as compared to those protected against this behavior.
Summary and Conclusions
Using outbred Sprague-Dawley rats, this investigation has demonstrated the ability of three different behaviors to predict consumption of ethanol. Novelty-induced locomotor activity, 2% ethanol consumption, and fat-induced TG levels all significantly correlated with 9% ethanol consumption, although the activity measure appeared unrelated to the other two measures. Rats predicted to consume high levels of 9% ethanol with these measures all showed elevated expression of the opioid ENK in the hypothalamus, affirming that this peptide is important in driving ethanol consumption. In contrast, elevated expression of hypothalamic GAL was observed in rats predicted to consume higher ethanol using the 2% ethanol and TG predictors, while NPY was elevated only in rats with higher activity level as a predictor. Future studies with these genetically heterogeneous rats predicted by these measures to over-consume ethanol should help to establish differences in neurochemical processes that may contribute to alcohol use disorders and may, in the future, open the door to more effective, preventative treatments of alcoholism at a personal level.
Acknowledgments
This research was supported by USPHS Grant AA12882. Gratitude is expressed to Mr. Si-Yi Chang for his valuable assistance with the peptide analyses.
Footnotes
Publisher's Disclaimer: This is a PDF file of an unedited manuscript that has been accepted for publication. As a service to our customers we are providing this early version of the manuscript. The manuscript will undergo copyediting, typesetting, and review of the resulting proof before it is published in its final citable form. Please note that during the production process errors may be discovered which could affect the content, and all legal disclaimers that apply to the journal pertain.
References
- Bardo MT, Donohew RL, Harrington NG. Psychobiology of novelty seeking and drug seeking behavior. Behav Brain Res. 1996;77:23–43. doi: 10.1016/0166-4328(95)00203-0. [DOI] [PubMed] [Google Scholar]
- Barson JR, Carr AJ, Soun JE, Sobhani NC, Leibowitz SF, Hoebel BG. Opioids in the nucleus accumbens stimulate ethanol intake. Physiol Behav. 2009a;98:453–459. doi: 10.1016/j.physbeh.2009.07.012. [DOI] [PMC free article] [PubMed] [Google Scholar]
- Barson JR, Carr AJ, Soun JE, Sobhani NC, Rada P, Leibowitz SF, Hoebel BG. Opioids in the hypothalamic paraventricular nucleus stimulate ethanol intake. Alcohol Clin Exp Res. 2010;34:214–222. doi: 10.1111/j.1530-0277.2009.01084.x. [DOI] [PMC free article] [PubMed] [Google Scholar]
- Barson JR, Karatayev O, Chang GQ, Johnson DF, Bocarsly ME, Hoebel BG, Leibowitz SF. Positive relationship between dietary fat, ethanol intake, triglycerides, and hypothalamic peptides: counteraction by lipid-lowering drugs. Alcohol. 2009b;43:433–441. doi: 10.1016/j.alcohol.2009.07.003. [DOI] [PMC free article] [PubMed] [Google Scholar]
- Belfer I, Hipp H, Bollettino A, McKnight C, Evans C, Virkkunen M, Albaugh B, Max MB, Goldman D, Enoch MA. Alcoholism is associated with GALR3 but not two other galanin receptor genes. Genes Brain Behav. 2007;6:473–481. doi: 10.1111/j.1601-183X.2006.00275.x. [DOI] [PubMed] [Google Scholar]
- Belfer I, Hipp H, McKnight C, Evans C, Buzas B, Bollettino A, Albaugh B, Virkkunen M, Yuan Q, Max MB, et al. Association of galanin haplotypes with alcoholism and anxiety in two ethnically distinct populations. Mol Psychiatry. 2006;11:301–311. doi: 10.1038/sj.mp.4001768. [DOI] [PMC free article] [PubMed] [Google Scholar]
- Bienkowski P, Koros E, Kostowski W. Novelty-seeking behaviour and operant oral ethanol self-administration in Wistar rats. Alcohol Alcohol. 2001;36:525–528. doi: 10.1093/alcalc/36.6.525. [DOI] [PubMed] [Google Scholar]
- Bisaga A, Kostowski W. Individual behavioral differences and ethanol consumption in Wistar rats. Physiol Behavior. 1993;54:1125–1131. doi: 10.1016/0031-9384(93)90336-e. [DOI] [PubMed] [Google Scholar]
- Caberlotto L, Thorsell A, Rimondini R, Sommer W, Hyytia P, Heilig M. Differential expression of NPY and its receptors in alcohol-preferring AA and alcohol-avoiding ANA rats. Alcohol Clin Exp Res. 2001;25:1564–1569. [PubMed] [Google Scholar]
- Carrillo CA, Leibowitz SF, Karatayev O, Hoebel BG. A high-fat meal or injection of lipids stimulates ethanol intake. Alcohol. 2004;34:197–202. doi: 10.1016/j.alcohol.2004.08.009. [DOI] [PubMed] [Google Scholar]
- Carroll ME, Morgan AD, Anker JJ, Perry JL, Dess NK. Selective breeding for differential saccharin intake as an animal model of drug abuse. Behav pharmacol. 2008;19:435–460. doi: 10.1097/FBP.0b013e32830c3632. [DOI] [PubMed] [Google Scholar]
- Chang GQ, Karatayev O, Ahsan R, Avena NM, Lee C, Lewis MJ, Hoebel BG, Leibowitz SF. Effect of ethanol on hypothalamic opioid peptides, enkephalin, and dynorphin: relationship with circulating triglycerides. Alcohol Clin Exp Res. 2007a;31:249–259. doi: 10.1111/j.1530-0277.2006.00312.x. [DOI] [PubMed] [Google Scholar]
- Chang GQ, Karatayev O, Ahsan R, Gaysinskaya V, Marwil Z, Leibowitz SF. Dietary fat stimulates endogenous enkephalin and dynorphin in the paraventricular nucleus: role of circulating triglycerides. American J Physio. 2007b;292:E561–570. doi: 10.1152/ajpendo.00087.2006. [DOI] [PubMed] [Google Scholar]
- Chang GQ, Karatayev O, Davydova Z, Leibowitz SF. Circulating triglycerides impact on orexigenic peptides and neuronal activity in hypothalamus. Endocrinology. 2004;145:3904–3912. doi: 10.1210/en.2003-1582. [DOI] [PubMed] [Google Scholar]
- Correia D, Ribeiro AF, Brunialti Godard AL, Boerngen-Lacerda R. Trait anxiety and ethanol: anxiolysis in high-anxiety mice and no relation to intake behavior in an addiction model. Prog Neuropsychopharmacology Biol Psychiatry. 2009;33:880–888. doi: 10.1016/j.pnpbp.2009.04.015. [DOI] [PubMed] [Google Scholar]
- Corwin RL, Robinson JK, Crawley JN. Galanin antagonists block galanin-induced feeding in the hypothalamus and amygdala of the rat. Eur J Neurosci. 1993;5:1528–1533. doi: 10.1111/j.1460-9568.1993.tb00221.x. [DOI] [PubMed] [Google Scholar]
- Criswell HE, Knapp DJ, Overstreet DH, Breese GR. Effects of ethanol, chlordiazepoxide, and MK-801 on performance in the elevated-plus maze and on locomotor activity. Alcohol Clin Exp Res. 1994;18:596–601. doi: 10.1111/j.1530-0277.1994.tb00916.x. [DOI] [PubMed] [Google Scholar]
- Da Silva GE, Ramos A, Takahashi RN. Comparison of voluntary ethanol intake by two pairs of rat lines used as genetic models of anxiety. Brazilian journal of medical and biological research = Revista brasileira de pesquisas medicas e biologicas/Sociedade Brasileira de Biofisica [et al. 2004;37:1511–1517. doi: 10.1590/s0100-879x2004001000010. [DOI] [PubMed] [Google Scholar]
- Dourmashkin JT, Chang GQ, Hill JO, Gayles EC, Fried SK, Leibowitz SF. Model for predicting and phenotyping at normal weight the long-term propensity for obesity in Sprague-Dawley rats. Physiol Behav. 2006;87:666–678. doi: 10.1016/j.physbeh.2006.01.008. [DOI] [PubMed] [Google Scholar]
- Fadda P, Tronci S, Colombo G, Fratta W. Differences in the opioid system in selected brain regions of alcohol-preferring and alcohol-nonpreferring rats. Alcohol Clin Exp Res. 1999;23:1296–1305. [PubMed] [Google Scholar]
- Fisher M, Gordon T. The relation of drinking and smoking habits to diet: the Lipid Research Clinics Prevalence Study. The American journal of clinical nutrition. 1985;41:623–630. doi: 10.1093/ajcn/41.3.623. [DOI] [PubMed] [Google Scholar]
- Foster KL, McKay PF, Seyoum R, Milbourne D, Yin W, Sarma PV, Cook JM, June HL. GABA(A) and opioid receptors of the central nucleus of the amygdala selectively regulate ethanol-maintained behaviors. Neuropsychopharmacology. 2004;29:269–284. doi: 10.1038/sj.npp.1300306. [DOI] [PubMed] [Google Scholar]
- Gahtan E, Labounty LP, Wyvell C, Carroll ME. The relationships among saccharin consumption, oral ethanol, and i.v cocaine self-administration. Pharmacol Biochem Behav. 1996;53:919–925. doi: 10.1016/0091-3057(95)02148-5. [DOI] [PubMed] [Google Scholar]
- Gaysinskaya VA, Karatayev O, Chang GQ, Leibowitz SF. Increased caloric intake after a high-fat preload: relation to circulating triglycerides and orexigenic peptides. Physiol Behav. 2007;91:142–153. doi: 10.1016/j.physbeh.2007.02.002. [DOI] [PubMed] [Google Scholar]
- Gilpin NW, Stewart RB, Badia-Elder NE. Neuropeptide Y suppresses ethanol drinking in ethanol-abstinent, but not non-ethanol-abstinent, Wistar rats. Alcohol. 2008;42:541–551. doi: 10.1016/j.alcohol.2008.07.001. [DOI] [PMC free article] [PubMed] [Google Scholar]
- Gilpin NW, Stewart RB, Murphy JM, Badia-Elder NE. Neuropeptide Y in the paraventricular nucleus of the hypothalamus increases ethanol intake in high- and low-alcohol-drinking rats. Alcohol Clin Exp Res. 2004;28:1492–1498. doi: 10.1097/01.alc.0000141813.27875.d5. [DOI] [PubMed] [Google Scholar]
- Gingras MA, Cools AR. Analysis of the biphasic locomotor response to ethanol in high and low responders to novelty: a study in Nijmegen Wistar rats. Psychopharmacology. 1996;125:258–264. doi: 10.1007/BF02247337. [DOI] [PubMed] [Google Scholar]
- Gosnell BA, Krahn DD. The relationship between saccharin and alcohol intake in rats. Alcohol. 1992;9:203–206. doi: 10.1016/0741-8329(92)90054-e. [DOI] [PubMed] [Google Scholar]
- Guitart-Masip M, Gimenez-Llort L, Fernandez-Teruel A, Canete T, Tobena A, Ogren SO, Terenius L, Johansson B. Reduced ethanol response in the alcohol-preferring RHA rats and neuropeptide mRNAs in relevant structures. Eur J Neurosci. 2006;23:531–540. doi: 10.1111/j.1460-9568.2005.04556.x. [DOI] [PubMed] [Google Scholar]
- Hansen MJ, Jovanovska V, Morris MJ. Adaptive responses in hypothalamic neuropeptide Y in the face of prolonged high-fat feeding in the rat. J Neurochem. 2004;88:909–916. doi: 10.1046/j.1471-4159.2003.02217.x. [DOI] [PubMed] [Google Scholar]
- Herbeth B, Didelot-Barthelemy L, Lemoine A, Le Devehat C. Dietary behavior of French men according to alcohol drinking pattern. J Stud Alcohol. 1988;49:268–272. doi: 10.15288/jsa.1988.49.268. [DOI] [PubMed] [Google Scholar]
- Hwang BH, Wang GM, Wong DT, Lumeng L, Li TK. Norepinephrine uptake sites in the locus coeruleus of rat lines selectively bred for high and low alcohol preference: a quantitative autoradiographic binding study using [3H]-tomoxetine. Alcohol Clin Exp Res. 2000;24:588–594. [PubMed] [Google Scholar]
- Hwang BH, Zhang JK, Ehlers CL, Lumeng L, Li TK. Innate differences of neuropeptide Y (NPY) in hypothalamic nuclei and central nucleus of the amygdala between selectively bred rats with high and low alcohol preference. Alcohol Clin Exp Res. 1999;23:1023–1030. [PubMed] [Google Scholar]
- Izidio GS, Ramos A. Positive association between ethanol consumption and anxiety-related behaviors in two selected rat lines. Alcohol. 2007;41:517–524. doi: 10.1016/j.alcohol.2007.07.008. [DOI] [PubMed] [Google Scholar]
- Jamensky NT, Gianoulakis C. Comparison of the proopiomelanocortin and proenkephalin opioid peptide systems in brain regions of the alcohol-preferring C57BL/6 and alcohol-avoiding DBA/2 mice. Alcohol. 1999;18:177–187. doi: 10.1016/s0741-8329(99)00002-6. [DOI] [PubMed] [Google Scholar]
- Jones BR, Barrett-Connor E, Criqui MH, Holdbrook MJ. A community study of calorie and nutrient intake in drinkers and nondrinkers of alcohol. Amer J Clin Nutrition. 1982;35:135–139. doi: 10.1093/ajcn/35.1.135. [DOI] [PubMed] [Google Scholar]
- Karatayev O, Gaysinskaya V, Chang GQ, Leibowitz SF. Circulating triglycerides after a high-fat meal: predictor of increased caloric intake, orexigenic peptide expression, and dietary obesity. Brain Res. 2009;1298:111–122. doi: 10.1016/j.brainres.2009.08.001. [DOI] [PMC free article] [PubMed] [Google Scholar]
- Karl T, Duffy L, Herzog H. Behavioural profile of a new mouse model for NPY deficiency. Eur J Neurosci. 2008;28:173–180. doi: 10.1111/j.1460-9568.2008.06306.x. [DOI] [PubMed] [Google Scholar]
- Kelley SP, Nannini MA, Bratt AM, Hodge CW. Neuropeptide-Y in the paraventricular nucleus increases ethanol self-administration. Peptides. 2001;22:515–522. doi: 10.1016/s0196-9781(01)00361-8. [DOI] [PMC free article] [PubMed] [Google Scholar]
- Kim EM, Quinn JG, Levine AS, O’Hare E. A bi-directional mu-opioid-opioid connection between the nucleus of the accumbens shell and the central nucleus of the amygdala in the rat. Brain Res. 2004;1029:135–139. doi: 10.1016/j.brainres.2004.10.001. [DOI] [PubMed] [Google Scholar]
- Koivisto T, Eriksson CJ. Hepatic aldehyde and alcohol dehydrogenases in alcohol-preferring and alcohol-avoiding rat lines. Biochem Pharmacol. 1994;48:1551–1558. doi: 10.1016/0006-2952(94)90199-6. [DOI] [PubMed] [Google Scholar]
- Konig M, Zimmer AM, Steiner H, Holmes PV, Crawley JN, Brownstein MJ, Zimmer A. Pain responses, anxiety and aggression in mice deficient in pre-proenkephalin. Nature. 1996;383:535–538. doi: 10.1038/383535a0. [DOI] [PubMed] [Google Scholar]
- Koros E, Piasecki J, Kostowski W, Bienkowski P. Development of alcohol deprivation effect in rats: lack of correlation with saccharin drinking and locomotor activity. Alcohol Alcohol. 1999;34:542–550. doi: 10.1093/alcalc/34.4.542. [DOI] [PubMed] [Google Scholar]
- Krahn DD, Gosnell BA. Fat-preferring rats consume more alcohol than carbohydrate-preferring rats. Alcohol. 1991;8:313–316. doi: 10.1016/0741-8329(91)90465-9. [DOI] [PubMed] [Google Scholar]
- Kuteeva E, Hokfelt T, Ogren SO. Behavioural characterisation of transgenic mice overexpressing galanin under the PDGF-B promoter. Neuropeptides. 2005a;39:299–304. doi: 10.1016/j.npep.2005.01.004. [DOI] [PubMed] [Google Scholar]
- Kuteeva E, Hokfelt T, Ogren SO. Behavioural characterisation of young adult transgenic mice overexpressing galanin under the PDGF-B promoter. Regulatory Peptides. 2005b;125:67–78. doi: 10.1016/j.regpep.2004.07.028. [DOI] [PubMed] [Google Scholar]
- Leibowitz S, Dourmashkin J, Chang G, Hill J, Gayles E, Fried S, Wang J. Acute high-fat diet paradigms link galanin to triglycerides and their transport and metabolism in muscle. Brain Res. 2004a;1008:168–178. doi: 10.1016/j.brainres.2004.02.030. [DOI] [PubMed] [Google Scholar]
- Leibowitz SF. Overconsumption of dietary fat and alcohol: mechanisms involving lipids and hypothalamic peptides. Physiol Behav. 2007;91:513–521. doi: 10.1016/j.physbeh.2007.03.018. [DOI] [PMC free article] [PubMed] [Google Scholar]
- Leibowitz SF, Alexander JT. Analysis of neuropeptide Y-induced feeding: dissociation of Y1 and Y2 receptor effects on natural meal patterns. Peptides. 1991;12:1251–1260. doi: 10.1016/0196-9781(91)90203-2. [DOI] [PubMed] [Google Scholar]
- Leibowitz SF, Avena NM, Chang GQ, Karatayev O, Chau DT, Hoebel BG. Ethanol intake increases galanin mRNA in the hypothalamus and withdrawal decreases it. Physiol Behav. 2003;79:103–111. doi: 10.1016/s0031-9384(03)00110-0. [DOI] [PubMed] [Google Scholar]
- Leibowitz SF, Dourmashkin JT, Chang GQ, Hill JO, Gayles EC, Fried SK, Wang J. Acute high-fat diet paradigms link galanin to triglycerides and their transport and metabolism in muscle. Brain Res. 2004b;1008:168–178. doi: 10.1016/j.brainres.2004.02.030. [DOI] [PubMed] [Google Scholar]
- Lemon CH, Brasser SM, Smith DV. Alcohol activates a sucrose-responsive gustatory neural pathway. J Neurophysiol. 2004;92:536–544. doi: 10.1152/jn.00097.2004. [DOI] [PubMed] [Google Scholar]
- Lodge DJ, Lawrence AJ. Comparative analysis of hepatic ethanol metabolism in Fawn-Hooded and Wistar-Kyoto rats. Alcohol. 2003;30:75–79. doi: 10.1016/s0741-8329(03)00097-1. [DOI] [PubMed] [Google Scholar]
- Lopez-Valpuesta FJ, Nyce JW, Griffin-Biggs TA, Ice JC, Myers RD. Antisense to NPY-Y1 demonstrates that Y1 receptors in the hypothalamus underlie NPY hypothermia and feeding in rats. Proc Biol Sci. 1996;263:881–886. doi: 10.1098/rspb.1996.0130. [DOI] [PubMed] [Google Scholar]
- Lu X, Ross B, Sanchez-Alavez M, Zorrilla EP, Bartfai T. Phenotypic analysis of GalR2 knockout mice in anxiety- and depression-related behavioral tests. Neuropeptides. 2008;42:387–397. doi: 10.1016/j.npep.2008.04.009. [DOI] [PMC free article] [PubMed] [Google Scholar]
- Marinelli PW, Kiianmaa K, Gianoulakis C. Opioid propeptide mRNA content and receptor density in the brains of AA and ANA rats. Life Sci. 2000;66:1915–1927. doi: 10.1016/s0024-3205(00)00517-8. [DOI] [PubMed] [Google Scholar]
- Marquenie LA, Schade A, van Balkom AJ, Comijs HC, de Graaf R, Vollebergh W, van Dyck R, van den Brink W. Origin of the comorbidity of anxiety disorders and alcohol dependence: findings of a general population study. European Addiction Res. 2007;13:39–49. doi: 10.1159/000095814. [DOI] [PubMed] [Google Scholar]
- Mitchell MC. Alcohol-induced impairment of central nervous system function: behavioral skills involved in driving. J Stud Alcohol Suppl. 1985;10:109–116. doi: 10.15288/jsas.1985.s10.109. [DOI] [PubMed] [Google Scholar]
- Morganstern I, Chang GQ, Barson JR, Ye Z, Karatayev O, Leibowitz SF. Differential effects of acute and chronic ethanol exposure on orexin expression in the perifornical lateral hypothalamus. Alc Clin Exp Res. 2010 doi: 10.1111/j.1530-0277.2010.01161.x. [DOI] [PMC free article] [PubMed] [Google Scholar]
- Morrow NS, Kiefer SW, Metzler CW. Gustatory and olfactory contributions to alcohol consumption in rats. Alcohol. 1993;10:263–267. doi: 10.1016/0741-8329(93)90003-7. [DOI] [PubMed] [Google Scholar]
- Nadal R, Armario A, Janak PH. Positive relationship between activity in a novel environment and operant ethanol self-administration in rats. Psychopharmacology. 2002;162:333–338. doi: 10.1007/s00213-002-1091-5. [DOI] [PubMed] [Google Scholar]
- Naleid AM, Grace MK, Chimukangara M, Billington CJ, Levine AS. Paraventricular opioids alter intake of high-fat but not high-sucrose diet depending on diet preference in a binge model of feeding. Am J Physiol Regul Integr Comp Physiol. 2007;293:R99–105. doi: 10.1152/ajpregu.00675.2006. [DOI] [PubMed] [Google Scholar]
- Paxinos G, Watson C. The rat brain in stereotaxic coordinates. 4. San Diego: Academic Press; 1998. [DOI] [PubMed] [Google Scholar]
- Pekkanen L, Eriksson K, Sihvonen ML. Dietarily-induced changes in voluntary ethanol consumption and ethanol metabolism in the rat. British J Nutrition. 1978;40:103–113. doi: 10.1079/bjn19780100. [DOI] [PubMed] [Google Scholar]
- Rada P, Avena NM, Leibowitz SF, Hoebel BG. Ethanol intake is increased by injection of galanin in the paraventricular nucleus and reduced by a galanin antagonist. Alcohol. 2004;33:91–97. doi: 10.1016/j.alcohol.2004.05.002. [DOI] [PubMed] [Google Scholar]
- Rogowski A, Kostowski W, Bienkowski P. Sucrose self-administration predicts only initial phase of ethanol-reinforced behaviour in Wistar rats. Alcohol Alcohol. 2002;37:436–440. doi: 10.1093/alcalc/37.5.436. [DOI] [PubMed] [Google Scholar]
- Schneider ER, Rada P, Darby RD, Leibowitz SF, Hoebel BG. Orexigenic peptides and alcohol intake: differential effects of orexin, galanin, and ghrelin. Alcohol Clin Exp Res. 2007;31:1858–1865. doi: 10.1111/j.1530-0277.2007.00510.x. [DOI] [PubMed] [Google Scholar]
- Schramm-Sapyta NL, Kingsley MA, Rezvani AH, Propst K, Swartzwelder HS, Kuhn CM. Early ethanol consumption predicts relapse-like behavior in adolescent male rats. Alcohol Clin Exp Res. 2008;32:754–762. doi: 10.1111/j.1530-0277.2008.00631.x. [DOI] [PMC free article] [PubMed] [Google Scholar]
- Sinclair JD, Kampov-Polevoy A, Stewart R, Li TK. Taste preferences in rat lines selected for low and high alcohol consumption. Alcohol. 1992;9:155–160. doi: 10.1016/0741-8329(92)90027-8. [DOI] [PubMed] [Google Scholar]
- Smialowska M, Gastol-Lewinska L, Tokarski K. The role of alpha-1 adrenergic receptors in the stimulating effect of neuropeptide Y (NPY) on rat behavioural activity. Neuropeptides. 1994;26:225–232. doi: 10.1016/0143-4179(94)90074-4. [DOI] [PubMed] [Google Scholar]
- Smialowski A, Lewinska-Gastol L, Smialowska M. The behavioural effects of neuropeptide Y (NPY) injection into the rat brain frontal cortex. Neuropeptides. 1992;21:153–156. doi: 10.1016/0143-4179(92)90038-x. [DOI] [PubMed] [Google Scholar]
- Smith BK, York DA, Bray GA. Effects of dietary preference and galanin administration in the paraventricular or amygdaloid nucleus on diet self-selection. Brain Res Bull. 1996;39:149–154. doi: 10.1016/0361-9230(95)02086-1. [DOI] [PubMed] [Google Scholar]
- Spanagel R, Montkowski A, Allingham K, Stohr T, Shoaib M, Holsboer F, Landgraf R. Anxiety: a potential predictor of vulnerability to the initiation of ethanol self-administration in rats. Psychopharmacology. 1995;122:369–373. doi: 10.1007/BF02246268. [DOI] [PubMed] [Google Scholar]
- Spence JP, Liang T, Habegger K, Carr LG. Effect of polymorphism on expression of the neuropeptide Y gene in inbred alcohol-preferring and -nonpreferring rats. Neuroscience. 2005;131:871–876. doi: 10.1016/j.neuroscience.2004.10.013. [DOI] [PMC free article] [PubMed] [Google Scholar]
- Stanley BG, Daniel DR, Chin AS, Leibowitz SF. Paraventricular nucleus injections of peptide YY and neuropeptide Y preferentially enhance carbohydrate ingestion. Peptides. 1985;6:1205–1211. doi: 10.1016/0196-9781(85)90452-8. [DOI] [PubMed] [Google Scholar]
- Swinburn BA, Walter L, Ricketts H, Whitlock G, Law B, Norton R, Jackson R, MacMahon S. The determinants of fat intake in a multi-ethnic New Zealand population. Fletcher Challenge--University of Auckland Heart and Health Study Management Committee. Int J Epidemiol. 1998;27:416–421. doi: 10.1093/ije/27.3.416. [DOI] [PubMed] [Google Scholar]
- Tang C, Akabayashi A, Manitiu A, Leibowitz SF. Hypothalamic galanin gene expression and peptide levels in relation to circulating insulin: possible role in energy balance. Neuroendocrinology. 1997;65:265–275. doi: 10.1159/000127184. [DOI] [PubMed] [Google Scholar]
- Tempel DL, Leibowitz KJ, Leibowitz SF. Effects of PVN galanin on macronutrient selection. Peptides. 1988;9:309–314. doi: 10.1016/0196-9781(88)90265-3. [DOI] [PubMed] [Google Scholar]
- Thiele TE, Marsh DJ, Ste Marie L, Bernstein IL, Palmiter RD. Ethanol consumption and resistance are inversely related to neuropeptide Y levels. Nature. 1998;396:366–369. doi: 10.1038/24614. [DOI] [PubMed] [Google Scholar]
- Thorsell A, Repunte-Canonigo V, O’Dell LE, Chen SA, King AR, Lekic D, Koob GF, Sanna PP. Viral vector-induced amygdala NPY overexpression reverses increased alcohol intake caused by repeated deprivations in Wistar rats. Brain. 2007;130:1330–1337. doi: 10.1093/brain/awm033. [DOI] [PMC free article] [PubMed] [Google Scholar]
- Tiesjema B, la Fleur SE, Luijendijk MC, Brans MA, Lin EJ, During MJ, Adan RA. Viral mediated neuropeptide Y expression in the rat paraventricular nucleus results in obesity. Obesity. 2007;15:2424–2435. doi: 10.1038/oby.2007.288. [DOI] [PubMed] [Google Scholar]
- Tordoff MG, Alarcon LK, Lawler MP. Preferences of 14 rat strains for 17 taste compounds. Physiol Behav. 2008;95:308–332. doi: 10.1016/j.physbeh.2008.06.010. [DOI] [PMC free article] [PubMed] [Google Scholar]
- Vengeliene V, Celerier E, Chaskiel L, Penzo F, Spanagel R. Compulsive alcohol drinking in rodents. Addiction Biol. 2009;14:384–396. doi: 10.1111/j.1369-1600.2009.00177.x. [DOI] [PubMed] [Google Scholar]
- Villar MJ, Meister B, Cortes R, Schalling M, Morris M, Hokfelt T. Neuropeptide gene expression in hypothalamic magnocellular neurons of normal and hypophysectomized rats: a combined immunohistochemical and in situ hybridization study. Neuroscience. 1990;36:181–199. doi: 10.1016/0306-4522(90)90361-7. [DOI] [PubMed] [Google Scholar]
- Wang H, Storlien LH, Huang XF. Effects of dietary fat types on body fatness, leptin, and ARC leptin receptor, NPY, and AgRP mRNA expression. American J Physiol. 2002;282:E1352–1359. doi: 10.1152/ajpendo.00230.2001. [DOI] [PubMed] [Google Scholar]
- Wang J, Dourmashkin JT, Yun R, Leibowitz SF. Rapid changes in hypothalamic neuropeptide Y produced by carbohydrate-rich meals that enhance corticosterone and glucose levels. Brain Res. 1999;848:124–136. doi: 10.1016/s0006-8993(99)02040-5. [DOI] [PubMed] [Google Scholar]
- Wang Q, Bing C, Al-Barazanji K, Mossakowaska DE, Wang XM, McBay DL, Neville WA, Taddayon M, Pickavance L, Dryden S, et al. Interactions between leptin and hypothalamic neuropeptide Y neurons in the control of food intake and energy homeostasis in the rat. Diabetes. 1997;46:335–341. doi: 10.2337/diab.46.3.335. [DOI] [PubMed] [Google Scholar]
- Yukhananov RY, Handa RJ. Estrogen alters proenkephalin RNAs in the paraventricular nucleus of the hypothalamus following stress. Brain Res. 1997;764:109–116. doi: 10.1016/s0006-8993(97)00432-0. [DOI] [PubMed] [Google Scholar]
- Zhang M, Kelley AE. Intake of saccharin, salt, and ethanol solutions is increased by infusion of a mu opioid agonist into the nucleus accumbens. Psychopharmacology. 2002;159:415–423. doi: 10.1007/s00213-001-0932-y. [DOI] [PubMed] [Google Scholar]