

Abstract
We performed molecular dynamics (MD) simulations of hydrated bilayers containing mixtures of dimyristoylphosphatidylcholine (DMPC) and Cholesterol at various ratios, to study the effect of cholesterol concentration on its orientation, and to characterize the link between cholesterol tilt and overall phospholipid membrane organization. The simulations show a substantial probability for cholesterol molecules to transiently orient perpendicular to the bilayer normal, and suggest that cholesterol tilt may be an important factor for inducing membrane ordering. In particular, we find that as cholesterol concentration increases (1%–40% cholesterol) the average cholesterol orientation changes in a manner strongly (anti)correlated with the variation in membrane thickness. Furthermore, cholesterol orientation is found to be determined by the aligning force exerted by other cholesterol molecules. To quantify this aligning field, we analyzed cholesterol orientation using, to our knowledge, the first estimates of the cholesterol tilt modulus χ from MD simulations. Our calculations suggest that the aligning field that determines χ is indeed strongly linked to sterol composition. This empirical parameter (χ) should therefore become a useful quantitative measure to describe cholesterol interaction with other lipids in bilayers, particularly in various coarse-grained force fields.
Keywords: cholesterol tilt, molecular dynamics, nematic field, condensing effect
Introduction
An essential component of mammalian cell membranes, cholesterol is known to be critical for membrane organization, dynamics and function(1–5). The non-uniform distribution of cholesterol between cellular organelles(3), lipid membrane compartments(4; 6–10), and even between leaflets of the same bilayer(11), highlights cholesterol’s role in influencing the biophysical properties of a fluid lipid matrix, and in the stabilization and function of membrane proteins through specific interactions. The great variability found in the concentration of cholesterol among various cells, and between the plasma membrane and the variety of membranes of other cellular organelles underscores the importance of tightly regulated cholesterol content for proper function at the subcellular level(12; 13). In fact, inborn errors of cholesterol synthesis lead to major developmental abnormalities, and conversely, an excess of cholesterol is widely acknowledged as detrimental(14; 15).
Experimentally, it has been shown that sterols have affinities for certain lipid types when introduced to lipid mixtures. A strong preferential interaction seems to exist for saturated phospholipids with phosphatidylcholine (PC) headgroups(16). At least for moderate concentrations in PC membranes, cholesterol resides in the membrane such that the hydroxyl group is solvated in the lipid headgroup region, while the hydrophobic tail is buried deep in the hydrocarbon region of the lipids(17; 18). Theory and simulation show that cholesterol can be expected to be positioned in lipid membranes in a slightly tilted configuration(19–25), with the hydroxyl group positioned in the lipid headgroup area.
However, this simple picture does not hold true, for example, when the membrane is composed of poly-unsaturated fatty acids (PUFAs). Recently, it was found that in the presence of lipids containing PUFAs, the cholesterol moiety - the sterol (aromatic) ring and its hydroxyl group - can situate deep inside the hydrocarbon region, lying either immersed in the membrane’s hydrocarbon core, or possibly in a flipped orientation(16). It is possible that the restrictive nature of the cholesterol molecule prohibits the approach of disordered PUFA chains: the entropic penalty created by the steric interactions with the planar rigid cholesterol molecules oriented along the membrane normal becomes too large. Moreover, a recent combined X-ray scattering and molecular dynamics study of cholesterol with 0.4 mole fraction in thin, short-chain monounssaturated diC14:1PC lipid bilayers(26) showed multiple instances when cholesterol molecules transiently orient perpendicular to the bilayer normal, with the hydroxyl group submerged in the center of the bilayer. However, this study showed that “lying down” of cholesterol was absent in mixtures containing the longer-chained diC22:1PC lipid. These evidences clearly underscore the interplay between the forces that act on the cholesterol molecule and the forces with which it acts on its lipid environment.
Here we focus on mixtures of cholesterol (Chol) in dimyristoylphosphatidylcholine (DMPC) lipids, a 14-carbon disaturated lipid that possess a neutral (zwitterionic) PC headgroup (see Figure 1). To further explore cholesterol’s tilt degree of freedom and its effect on membrane structural properties, we have produced and analyzed trajectories from molecular dynamics (MD) simulations of DMPC-Chol mixed bilayers at different sterol concentration. We find that Chol molecules in DMPC membranes frequently transiently orient perpendicular to the bilayer normal, similar to their behavior in diC14:1PC bilayers(26) (lipids differing only by a single double bond in each hydrocarbon chain) suggesting that, at least at high sterol content, cholesterol orientation in DMPC and diC14:1PC may be similar.
Figure 1.
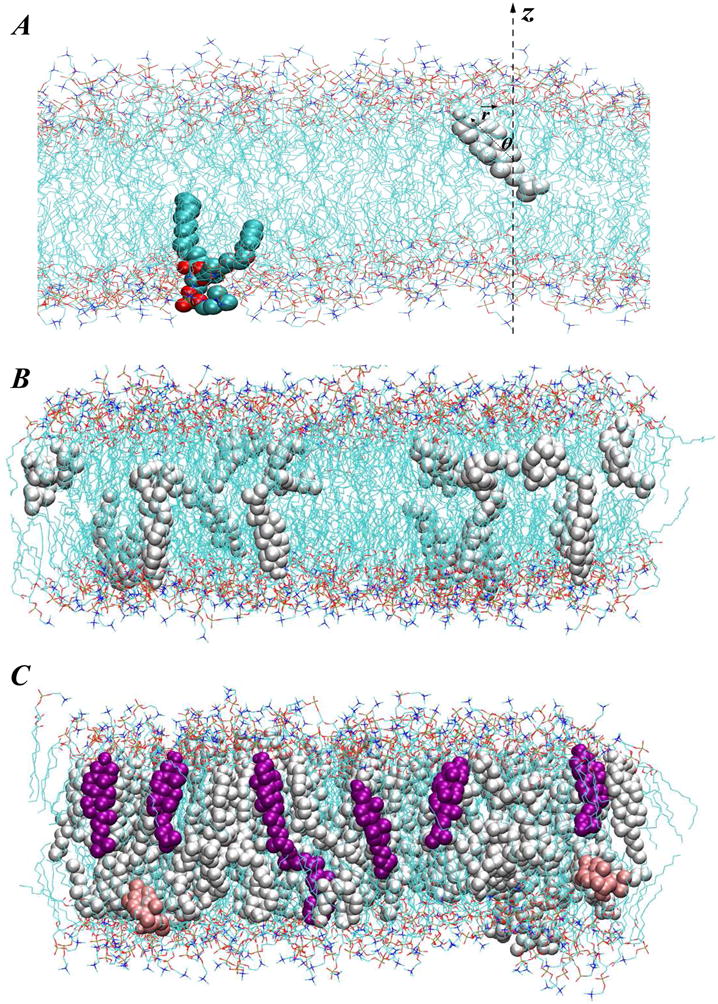
(A) Fragment of simulated DMPC-Cholesterol bilayer at 10% Chol concentration showing the definition of cholesterol tilt angle. For clarity, only one cholesterol molecule is shown (in white), and water molecules are removed. For illustration purposes, one DMPC lipid molecule is also highlighted in space-fill. The tilt angle θ of cholesterol is defined as the angle between the cholesterol ring plane vector r⃗ (connecting Chol C3 and C17 atoms) and z axis of the simulation box. Panels (B) and (C) depict snapshots of DMPC-Cholesterol bilayers at 5% and 30% Chol compositions respectively, and illustrate the different level of cholesterol organization in high and low Chol content membranes. On both panels DMPC lipids are shown as lines, and cholesterols are depicted in space-fill. Chols in purple in panel C highlight increased long-range orientational order of cholesterols in 30% mixture compared to that in 5%. However, note that some instances still can be found, even at 30% Chol, when cholesterol molecules transiently orient perpendicular to the bilayer normal (pink colored space-fill in panel C).
Our study further suggests that cholesterol tilt may be an important factor capable of inducing membrane ordering. In particular, we find that, as Chol concentration increases, the change in average cholesterol orientation is strongly (anti)correlated with the concomitant increase in membrane thickness, and that this correlation persists for the wide cholesterol content range studied (1%–40% Chol). Notably, over this range of concentrations and for temperatures above the main fluid-to-gel phase transition temperature of pure DMPC lipid (~297K(27)), DMPC-Chol mixtures are known to transition through different levels of organization as a function of cholesterol concentration(27). Specifically, for sterol compositions lower than ~10%, DMPC-Chol mixtures exhibit fluid-like properties; at moderate Chol densities (between ~10% and ~30% Chol), the temperature-composition diagram(27) predicts coexistence of fluid and Chol-rich liquid-ordered states; and lastly, at the high Chol concentration regime (above ~30% Chol), DMPC-Cholesterol mixtures are expected to be in the one-phase liquid-ordered state. We have been able to relate cholesterol’s preferred orientation to these fluidity states, thereby establishing a link between cholesterol orientation and the well-known lipid condensing effect(28; 29).
We also find that cholesterol orientation is strongly determined by the aligning force induced by other cholesterol molecules, somewhat similar to the density-induced “lying down” to “standing up” transitions that are observed in Langmuir monolayers(30; 31). This aligning field is discussed in terms of a cholesterol tilt modulus calculated here for the first time from MD simulations.
Computational Methods and Procedures
Model systems and simulation details
MD simulations were performed on hydrated (14:0) DMPC-Cholesterol mixtures at 0%, 1%, 3%, 5%, 10%, 20%, 30% and 40% Chol concentrations. Our choice of lipid is dictated by several factors: DMPC is a widely studied phospholipid, and forms a good basis for comparing our computational results with experiments(29; 32–34), and also with previous model calculations(20; 23; 24); The system is particularly amenable to physicochemical studies because of its relatively low gel-to-fluid transition temperature(27); and lastly, DMPC is generally considered a “good” solvent for cholesterol, so that studies of these mixtures should provide a setting for discussing the effects of cholesterol on lipids that generally do not segregate away from it in multicomponent membranes.
The bilayers were constructed from previously equilibrated pure DMPC membranes containing 100 lipids at a temperature T = 303K(35). To build the model systems, the DMPC bilayer was first depleted from all solvent molecules and replicated 4 times in the membrane plane. Appropriate cholesterol fractions were then created by randomly substituting phospholipids with Chol molecules oriented along the bilayer normal. After hydration, the final mixtures all contained 200 molecules per monolayer leaflet and were solvated by ~32 SPCE water molecules per lipid head-group.
All simulations were performed using the GROMACS simulation suite(36; 37). The LINCS algorithm was used to constrain all bond lengths(38) allowing for 2fs time steps. Periodic boundary conditions were applied in all three dimensions, and long-range electrostatics were calculated using the Particle-Mesh-Ewald algorithm(39). A cutoff of 18Å was employed for van der Waals interactions. The systems were simulated in an NPT ensemble. A constant pressure of 1 atm was maintained using the Parrinello-Rahman semi-isotropic pressure coupling scheme(40; 41). The simulations were performed at T = 308K (corresponding to a reduced temperature (T−T0)/T0 of 0.039, T0 being the DMPC fluid-to-gel phase transition temperature) using the Noose-Hoover temperature coupling method(42). By simulating DMPC/Chol bilayers at 308K and for various sterol concentration we expect to explore different regimes of fluidity in these mixtures, according to the previously proposed temperature-composition diagram for DMPC/Cholesterol membranes(27) (see Results).
For each model system, an equilibration phase was performed at T = 308K and with velocity reset frequency of 100ps, followed by a continuous production run. The lengths of the equilibration and production phases for different membrane mixtures are summarized in Table 1. The recently improved united atom GROMOS96 43A1 force-field was utilized throughout. This parameter set, described in detail in Ref.(35), has been successfully tested for various lipid membrane systems(35; 43), and is publicly available from http://www.nanoconductor.org.
Table 1.
Duration of equilibration and production phases for all simulated mixtures
| System | Equilibration | Production |
|---|---|---|
| 0% CHOL | 10 ns | 15ns |
| 1% CHOL | 10 ns | 35ns |
| 3% CHOL | 10 ns | 30ns |
| 5% CHOL | 10 ns | 30ns |
| 10% CHOL | 25 ns | 20ns |
| 20% CHOL | 25 ns | 20ns |
| 30% CHOL | 20 ns | 20ns |
| 40% CHOL | 15 ns | 17ns |
Evaluating cholesterol tilt angle probability distributions plots
The orientation of cholesterol molecules in the membrane is described here using the unit vector n̂ of the vector joining C3–C17 groups on Chol ring, commonly used to describe cholesterol tilt, and the bilayer normal(see Figure 1A). This vector is described in the lab (simulation box) reference frame in polar coordinates by the angle θ, defined as the angle between n̂ and the bilayer normal z axis. As usual for polar coordinates, θ is defined in the range [0°; 180°]. In this definition θ=0 represents a cholesterol orientation where the ring plane is parallel to the bilayer normal z axis. An additional polar angle φ, describing the angle that the projection of n̂ on the xy plane makes with the x axis of the simulation box, varries within [0°; 360°]. Note that any angle θ can have multiple values for φ. The number of available states grows with θ, since the vector n̂ can circumscribe larger circles for larger θ.
In order to investigate cholesterol orientation in different compositional mixtures, we examined cholesterol tilt angle distributions (see Results). To this end we constructed normalized probability densities P (θ) (summed for each θ over all φ angles) of cholesterol tilt angle in DMPC/Chol membranes of various sterol content(Fig. 5A). To obtain probability densities, the [0°; 180°] angular interval for θ was divided into 180 bins with size δθ = 1°, and a cholesterol orientational angle histogram was collected for each system. The histograms were then normalized by the total number of entries to obtain the P (θ) distributions. By construction, P (θ) is symmetrical around θ = 90°.
Figure 5.

(A) Normalized probability distributions P (θ) of cholesterol tilt angle in DMPC/Chol membranes of various sterol concentrations. The tilt angle is defined as the angle between the vector describing cholesterol ring plane orientation and the bilayer normal (see Methods). For comparison we also plot the expected distribution of tilt angles in a non-interacting system of Chol molecules where cholesterols are oriented randomly. This random distribution is given by P0(θ) = sin θ. (B) Plots of P (θ)=P0(θ) for different DMPC/Cholesterol mixtures derived from panel A. (C) Potential of mean force (PMF) plots from the distributions in panel B (see text for details). (D) Correlation between average cholesterol tilt 〈θ〉 and bilayer thickness dHH in simulated systems (lines are guides to the eye). (E) Loss in cholesterol orientational entropy with increasing cholesterol concentration.
We note that distribution plots like the ones shown in Fig. 5A are generally strongly dependent on the extent of sampling during the simulation. To ensure adequate sampling in mixtures containing a small number of Chol molecules, these systems were allowed to propagate in the production phase for longer periods compared to bilayers containing high concentrations of cholesterol (see Table 1). To judge the sampling quality, we monitored for all simulated systems the number of times a cholesterol molecule visits a certain [θ,θ + δθ] angular bin. For instance, we found that in 1% Chol mixture, each cholesterol molecule visits any [θ, θ + δθ] bin for θ ∈ [10°, 60°] more than 200 times for the duration of the production run. Overall, in all mixtures on average cholesterol molecules sampled each [θ, θ + δθ] bin for θ ∈ [8°, 60°] at least 90 times. Therefore, we safely assume that all P (θ) distributions are well-converged, at least for θ ∈ [8°, 60°].
Results and Discussion
Structural properties of model DMPC/Cholesterol bilayers validated by experiments
Figures 1B and 1C illustrate final snapshots of simulated 5% and 30% Chol mixtures, and highlight the different level of cholesterol organization in low and high Chol-containing membranes. In particular, with increasing concentration, cholesterol molecules appear to exhibit long-range orienational order around the bilayer normal. At the same time, the membrane overall appears to become more condensed lateraly, and concomitantly becomes thicker. To quantitatively characterize and validate our simulations we computed several key structural properties of the model bilayers including X-ray form factors, electron densities, NMR order parameters, as well as molecular areas and volumes.
Figure 2 compares form factors F (q) derived from our MD simulations to those from small angle X-ray scattering (SAXS) experiments of DMPC at a temperature of T = 308K, and in the presence of various cholesterol concentrations (as previously described in (32)). For the SAXS experiments, form factors were calculated from X-ray scattering intensities(32; 44–47). To obtain F (q) from simulations, the electron density profile for each model membrane was first constructed by dividing the simulation cell into slabs in the z direction, and the number of electrons corresponding to the atoms in each slab was counted. The corresponding form factors were then evaluated using the following expression:
| (1) |
where D is the average length of the simulation cell in the z direction, ρe(z) is the symmetric electron density of the system, and is the electron density of bulk water.
Figure 2.

Comparison of experimental and simulation form factors F (q) for DMPC-Cholesterol mixtures in the presence of 0%, 1%, 3%, 5%, 10%, 20%, and 40% Chol. F (q)-s computed in small angle X-ray scattering (SAXS) experiments were obtained from Ref.(32) and are shown as symbols. MD form factors are depicted as solid lines.
Fig. 2 illustrates the remarkable agreement between SAXS and simulation data for all DMPC/Chol mixtures, at least for the first two lobes of the form factor. (Note, that no SAXS data were available for 30% DMPC/Chol.) Furthermore, these plots reveal that upon increasing cholesterol concentration, the maxima of the form factors shift towards lower q values, giving rise to additional peaks in the high q-range. These features are usually indicative of bilayer thickening, and suggest increased ordering within the membrane.
The trend is even more apparent in the electron density and lipid tail NMR order parameter profiles. Specifically, a peak-to-peak (or head-head(33)) distance in the electron density can be assigned to an average separation between phosphate atoms on lipids from opposite leaflets, and thus provides a measure of bilayer thickness. In Figure 3A we present head-head distances derived from the model electron density profiles (normalized by the thickness of the pure DMPC bilayer derived from simulation) versus cholesterol content in different DMPC/Chol mixtures. For comparison, the panel also shows the same measure as calculated from the SAXS experiments(32) (normalized by the thickness of the pure DMPC bilayer derived from the experiment). Fig. 3A illustrates near perfect agreement between MD simulations and the SAXS data, and confirms the well-established observation for fluid bilayers, whereby upon Chol addition the membrane thickness increases with composition in a nonlinear fashion(29; 33; 48–51). Furthermore, Fig. 3A reveals that the bilayer thickness starts saturating at around 20% Chol. Similar progression has been observed in recent X-ray diffraction studies on DMPC/Cholesterol mixtures at T = 303K and at different hydration levels(29; 33). Overall, in our simulations 40% cholesterol thickens DMPC bilayers by ~5.3Å, a value close to that previously reported(29; 32–34).
Figure 3.

(A) Comparison of experimental(32) and simulation peak-to-peak distances (dHH ) from the electron density profiles for different DMPC/Cholesterol mixtures. The panel shows dHH normalized by the thickness of the pure DMPC bilayer d0 in experiment and simulations. (B) Volume per molecule v(x) as a function of cholesterol concentration (symbols). Two lines represent linear fits to the data in two cholesterol concentration regimes: x ≤ 0.2 and x > 0.2 respectively. (C) Change in area per molecule a(x) with cholesterol fraction.
Bilayer thickening upon cholesterol addition is due to ordering of the lipid hydrocarbon chains, as illustrated in the simulated deuterium order parameter −SCD plots in Figure 4. The order parameters for (saturated) carbons on the hydrocarbon tails of DMPC lipid in simulations that use the united atom force field is determined by(52):
| (2) |
where Sxx and Syy are the components of the order parameter tensor:
| (3) |
Figure 4.

Deuterium order parameter profiles derived from simulations, averaged over two hydro-carbon chains of DMPC lipid at different cholesterol concentrations.
αi being the angle made by the i-th molecular axis with the bilayer normal and δij representing the Kronecker delta function.
Consistent with our electron density profiles, and in line with experimental (18; 33; 53–57) and theoretical (20; 21; 23; 24; 58; 59) data on DMPC/Chol mixtures, Figure 4 reveals that the ordering of hydrocarbon chains of DMPC lipid increases with cholesterol content, and saturates at ≈ 20% cholesterol.
Another key structural property of mixed membranes is the partial molecular volumes of individual bilayer components, i.e. the partial volumes of DMPC, VDMPC and cholesterol, VCHOL. In the spirit of the derivation presented by Greenwood et al(28), we evaluate the partial molecular volumes by first expressing the total volume of the simulation box as
| (4) |
where NW and VW =30.5Å2 are the number of waters and volume of a single water molecule respectively (35), and x = NCHOL=(NDMPC + NCHOL) is the number fraction of cholesterol in the mixture. We then calculate the volume per lipid in the bilayer at each Chol concentration using(28; 43):
| (5) |
Figure 3B shows the volumes v(x) versus cholesterol fraction x. The plot reveals a near linear decrease in v(x) with Chol content, indicating a “condensing” effect of cholesterol as described in Ref.(28). Furthermore, similar to the experimental measurements by Greenwood et al on DMPC/Chol mixtures at T = 303K, we find that our data can be well represented by a double linear fit to the volumetric data that corresponds to x ≤ 0.2 and x > 0.2 concentration ranges (Fig. 3B). Using Eq. 5, the values of the slope and intercept of each fitted line can be used to obtain two sets of values for VDMPC and VCHOL, corresponding to the partial molecular volumes of DMPC and Chol in the two concentration regimes(28; 43). Table 2 compares VDMPC and VCHOL derived from the linear fits to the data in Fig. 3B with those obtained in Ref.(28). Overall, we find good agreement between partial molecular volumes from MD and experimental data.
Table 2.
Partial molecular volumes (in Å3)a
| MD | Expt(28) | |
|---|---|---|
| Temperature | 308K | 303K |
| VDMPC | 1075.50 (x ≤ 0.2) | 1099.6 (x < 0.25) |
| VCHOL | 585.25 (x ≤ 0.2) | 565.1 (x < 0.25) |
| VDMPC | 1057.97 (x > 0.2) | 1076.8 (x ≥ 0.25) |
| VCHOL | 643.15 (x > 0.2) | 637.5 (x ≥ 0.25) |
Calculated from Figure 3B
In order to further explore the condensing effect of cholesterol on DMPC membranes, we evaluated the area per molecule a(x), defined as
| (6) |
Figure 3C shows a(x) as a function of cholesterol concentration. In agreement with experiments(29) and modeling studies(51) of DMPC-Cholesterol mixtures, we find a strong non-linear decrease in molecular area with increasing cholesterol content, indicative of the previously described cholesterol condensation on DMPC lipids(29). Taken together, the structural data presented in Figs. 2–4 provide a strong basis to conclude that all simulated bilayer mixtures are good models for further investigation of molecular properties. With that, we now proceed to the principal findings from our work.
Cholesterol orientation in DMPC bilayers
Average Cholesterol tilt angle
Figure 5A shows normalized probability densities P (θ) (see Methods) of cholesterol tilt angle in DMPC/Chol membranes for various sterol concentrations. For comparison, Fig. 5A also includes the expected probability density distribution of tilt angles in a hypothetical “ideal gas” of cholesterols, where non-interacting Chol molecules are oriented randomly, so as to maximize number of states accessible to them. Obviously, this random distribution is given by P0(θ) = sin θ, since the number of possible orientations that any vector making an angle θ with the z axis can assume is degenerate by a factor sin θ/2, and the range of tilt angles in Fig. 5A is [0; 90°] (see below for more details). For each sterol composition, we also calculated the average cholesterol tilt angle, defined as:
| (7) |
Note that, in principle, the average cholesterol tilt angle, can be defined in several ways, and the definition employed here may differ from the ones used in other MD studies(20; 22–26; 60)
We first discuss the values of 〈θ〉 as presented in Table 3, before examining the distribution plots themselves in more detail. The progression of 〈θ〉 indicates that the average cholesterol tilt decreases with increasing cholesterol content. This is in line with the results from electron spin resonance (ESR) experiments(61), and NMR(62) studies of different phospholipid(PC)-Chol systems. These studies suggest that the orientational ordering of cholesterol in PC-Chol mixtures indeed increases with sterol concentration. In fact, according to Ref.(61), this trend is most prominent for DMPC membranes, among saturated PCs of different hydrocarbon tail length.
Table 3.
Average tilt angles, 〈θ〉a
| Cholesterol fraction | Average tilt angle |
|---|---|
| 0.01 | 40.6° |
| 0.03 | 37.8° |
| 0.05 | 37.5° |
| 0.1 | 30.4° |
| 0.2 | 29.6° |
| 0.3 | 27.9° |
| 0.4 | 27.6° |
Cholesterol tilt correlates with bilayer thickness
To examine how changes in average cholesterol orientation upon increasing Chol concentration relate to the concomitant variation in membrane thickness, Figure 5D shows the head-head distance dHH (as presented in Fig. 3) versus 〈 θ〉. Remarkably, the plot reveals that sterol tilt and membrane thickness are strongly anti-correlated. Because bilayer thickness is directly related to ordering of lipid tails, these results suggest that sterol tilt is an important indicator of the order that cholesterol can induce in the membrane (see below for further discussion). The correlation between cholesterol tilt and membrane ordering persisted over the entire 1%–40% cholesterol concentration range that we have simulated. These results are in general agreement with MD studies by Aittoniemi et al(22) that examined instantaneous tilt angle of a sterol as a function of the corresponding average molecular order parameter of neighboring lipid chains in 20% DPPC-Chol and DOPC-Chol mixtures. These authors found a similar correlation between the two properties.
Interestingly, over the 1%–40% range of cholesterol concentrations and at T = 308K, DMPC-Cholesterol bilayers are known to undergo different levels of organization with changes in cholesterol content(27). Namely, for sterol concentrations lower than ~10%, DMPC-Cholesterol mixtures exhibit fluid-like properties; at moderate Chol densities (between ~10% and ~30% Chol), the temperature-composition diagram(27) predicts coexistence of fluid and Chol-rich liquid-ordered states, and lastly, at high Chol concentration regime (above ~30% Chol), DMPC-Cholesterol mixtures are expected to be in the one-phase liquid-ordered state. Fig. 5D indicates that cholesterol’s ability to affect membrane ordering in various fluidity states is strongly correlated with cholesterol’s preferred orientation.
Cholesterol alignment with increasing concentration as a possible mechanism for membrane ordering
To learn how sterol orientation may contribute to lipid tail ordering, we now examine in more detail the P (θ) functions as plotted in Fig. 5A for various DMPC/Chol mixtures. In the limit of low Chol concentration (1%–5% Chol) the tilt angle distributions are broad. As sterol content increases, P (θ) appears to develop a well-defined maximum at lower tilt angles, and the distributions become narrower, indicating stronger alignment of cholesterol molecules along the bilayer normal. This behavior appears to be analogous to the well-known isotropic-nematic (I-N) transition in liquid crystals(30), where hard-rod molecules assume preferred orientation upon increased concentration (compare Figs. 1B and 1C).
To understand the mechanism of cholesterol alignment, it is essential to consider several major factors that can contribute to the overall orientation of cholesterol molecules in the membrane. Pairwise interactions between sterol molecules and between Chol and PC tend to separate cholesterol molecules from each other, because Chol-Chol pair interactions are in general less favorable energetically compared to Chol-PC interactions(see, for instance, (63)). In fact, this circumstance gave rise to the idea of cholesterol forming complexes with phospholipids(64; 65). In addition to this energetic factor, and similarly to simple hard-rod molecules, each cholesterol, also possesses degrees of freedom associated with orientational and translational entropy of the molecule inside the membrane. As cholesterol tilts at an angle θ from the bilayer normal, it can span more configurations compared to the position where it is upright. This degeneracy, which is proportional to sin θ, would in principle cause an isotropically oriented cholesterol molecule to preferably assume orientations that are perpendicular to the bilayer normal. Obviously, this ideal behavior, governed purely by entropic tendencies, will occur only in a hypothetical system of non-interacting Chol molecules, where all cholesterols would eventually orient themselves randomly resulting in the P0(θ) distribution shown in Fig. 5A (dotted line). Indeed, the P (θ) plots in Fig. 5A indicate that at low sterol compositions, where Chol-Chol interaction effects are small, cholesterol is tilted, probably due mainly to the orientational entropy contribution that largely determine the maximum number of (tilted) states. This point can be clearly observed by comparing P (θ) for 1% Chol with the random distribution P0(θ). Remarkably, these two distributions nearly coincide for the θ ∈ [45°, 60°] interval, indicating that for 1% Chol the probability of finding cholesterol molecules tilted with respect to the vertical at any angle within this angular range is the same as for randomly oriented non-interacting molecules.
In the membrane environment, however, the preferred cholesterol configuration is dictated by an interplay between all the energetic and entropic contributions described above. As cholesterol concentration increases, these molecules can be expected to preferentially “stand up” in the membrane. This tendency is first due to the sterol’s attempt to gain “free volume” and hence translational entropy at the expense of orientational entropy. It can also result from lipid-mediated unfavorable chol-chol interactions that can be enthalpic in nature.
In an effort to avoid each other, sterols can align along the bilayer normal (see below). Thus, a nematic-like ordering of Chol molecules is established, where cholesterols do not directly interact with each other but instead become engaged in interactions with neighboring lipids. As a consequence, with increasing Chol concentration, condensation of cholesterols on DMPC lipids occurs(28; 29), and lipid hydrocarbon chains concomitantly become more ordered (Fig. 4), while the bilayer thickens (Figs. 3 and 5D).
To quantify losses in cholesterol orientational entropy upon increasing Chol concentration, we defined the orientational entropy ΔS = ΔS(x)(66; 67):
| (8) |
and in Fig. 5E we show ΔS as a function of cholesterol concentration. Note, that this orientational entropy loss as defined in Eq. 8 vanishes if Chol molecules are randomly oriented(66; 67). However, in DMPC/Cholesterol membranes ΔS is expected to deviate from zero, due to the anisotropic orientation of cholesterols that reflect losses in orientational entropy. Indeed, Fig. 5E reveals that for all mixtures ΔS is negative, and the orientational entropy decreases with increasing Chol concentrations. Furthermore, the change in ΔS is non-linear, and appears to be closely related to the change in membrane thickness (Figs. 3A and 5D).
The observed loss in cholesterol orientational entropy upon change in concentration is consistent with theoretical predictions on energetics of single cholesterol transfer between bilayers containing different lipids(68), as well as on free energies of single cholesterol desorption from membranes consisting of different lipids(69). In particular, using MD simulations, Zhang et al(68) carried out free energy calculations of cholesterol transfer from a bilayer containing unsaturated palmyltoyl-oleoyl-phosphatidylcholine (POPC) lipids to a bilayer consisting of ordered sphingomyielin (SM) lipid molecules. The process of transfer was found to be exothermic, suggesting that Chol transfer from POPC to SM was favorable energetically, but prohibitive entropically. Furthermore, the authors predicted a broader distribution of cholesterol tilt in the POPC bilayer compared to that in the SM membrane, indicative of loss of rotational entropy upon Chol transfer from POPC to SM. Notably, the POPC/Chol and SM/Chol membranes discussed in Ref.(68) exist in different fluidity states, so that the process of cholesterol exchange between these membranes can be deemed similar to Chol transfer from our low concentration DMPC/Chol mixtures to high Chol content DMPC/Chol membranes. Thus, in both types of mixtures, preferential cholesterol alignment in the high concentration regime (ordered state) is driven by sacrificing sterol’s orientational freedom in favor of other free energy gains.
Bennett et al(69) utilized atomistic as well as coarse-grained MD simulations to calculate free energies of cholesterol desorption from various PC membranes, as well as sterol flip-flop rates. These authors found that the free energy of cholesterol desorption from saturated lipid bilayers was higher than that from membranes containing poly-unsaturated lipids. At the same time, the rate of cholesterol flip-flop was reduced with increasing lipid tail order. Consistent with our results for low-Chol mixtures, and as noted in Ref.(69), the trends observed by Bennett et al are directly related to the fact that cholesterol in disordered environments, as found near poly-unsaturated lipids, can orient itself perpendicular to the bilayer normal and reside close to the membrane center, where it has greater orientational freedom compared to the low orientational entropy “standing up” configuration(70).
To better quantify cholesterol alignment in DMPC membranes, we defined cholesterol orientational order parameter σ(31) as:
| (9) |
Here β denotes the angle between the vectors defining the ring planes of two cholesterols (see Methods). Thus, σ=1 if Chol molecules are perfectly aligned, and σ = 0 for the orientationaly isotropic mixture(31). In Figure 6 we show σ as a function of the distance between cholesterol pairs for different mixtures. The plot clearly illustrates that for high concentrations (30%) orientational ordering of Chol molecules persists over large distances (see also Fig. 1C). However, as Chol concentration decreases, orientational order weakens, and for small Chol fractions (3%) σ fluctuates strongly between low and negative values (Fig. 1B) that correspond to a “lying down” configuration. Thus, cholesterol’s behavior in the membrane is somewhat reminiscent of the orientational transformations of so-called Langmuir monolayers of amphiphilic molecules at the air-water interface(see (31) and references therein).
Figure 6.

Cholesterol orientational order parameter σ (see text) as a function of distance between cholesterols. Results for 3%, 10% and 30% systems are shown as circles, and the lines represent guides to the eye.
Cholesterol can “lie down” in DMPC membranes
Remarkably, P (θ) plots reveal a non-zero probability for finding cholesterol molecules at very large tilt angles (Fig. 5A), even for the highest sterol concentrations that we have simulated. We find many instances where cholesterol molecules in DMPC membranes transiently orient perpendicular to the bilayer normal (see Figs. 1B and 1C). This result is interesting in light of recent experimental and simulation data on membranes containing poly-unsaturated fatty acids (PUFA)(16) and diC14:1PC lipids(26). These studies show that in the presence of PUFAs, or short-tail diC14:1PC lipids, the cholesterol with its aromatic ring and the hydroxyl group can reside deep inside the hydrocarbon region, lying either immersed in the membrane’s hydrocarbon core, or possibly in a flipped orientation(16). Further, comparing diC14:1PC lipid-containing membranes to longer-tail diC22:1PC bilayers, both at 40 mol% Chol, Kučerka et al(26) suggested that such cholesterol reorientations are mainly characteristic of thin membranes. Our data agree well with the findings in that study, and suggest that cholesterol orientation in DMPC and diC14:1PC (these lipids differing only by a single double bond in each hydrocarbon chain) may be similar, at least at high sterol content.
Cholesterol orientation is related to sterol depth in the membrane
Analyzing the positioning of cholesterols in different mixtures, we found that the change in cholesterol tilt upon increasing sterol concentration is linked to the vertical location (depth) of the cholesterol in the membrane, as detailed in Figure 7. For five DMPC/Chol mixtures, we show the normalized 2D probability densities (color shades) of finding cholesterol molecules with a tilt angle of θ (vertical axis) and with its hydroxyl (OH) group at a vertical distance h from the bilayer mid-plane (horizontal axis)(71). Thus, θ = 0 describes cholesterol with its ring plane parallel to the bilayer normal, and h = 0 corresponds to the cholesterol OH group at the membrane midplane. Fig. 7 shows a broad distribution in both tilt angle and OH group location for the low 3% Chol mixture, with an absence of a clear preferred orientation and most probable OH depth. But as cholesterol concentration increases, a most probable location of hydroxyl group emerges. This maximum shifts towards the lipid head-group region as Chol concentration rises further, and eventually centers around h ~1.25 nm from the bilayer mid-plane for 40% Chol, in complete agreement with recently published results based on X-ray studies of PC/Chol monolayers(72). At the same time, the broad angular distribution observed at 3% Chol also appears to merge into a single, narrower distribution of most probable angles.
Figure 7.

Normalized 2D probability densities (color shades), for selected systems, of finding cholesterol molecule in a configuration with a tilt angle of θ (vertical axis) and with its hydroxyl (OH) group at a vertical distance h from the bilayer mid-plane (horizontal axis). θ = 0 describes cholesterol with its ring plane parallel to the bilayer normal, and h = 0 corresponds to the cholesterol OH group at the membrane center.
Potential of mean force and cholesterol tilt modulus in DMPC bilayers
Our inferences so far highlight the competition between the entropic factors that tends to maximize the number of accessible states by orienting cholesterol molecules randomly at low cholesterol concentrations and aligning them at higher concentrations, and the energetic forces that are dominated by unfavorable Chol-Chol interactions. At low Chol densities both translational and rotational entropic contributions dominate. But as sterol concentration rises, the energetic factor, together with the translational entropy factors become more prominent, and the P (θ) distributions gradually diverge from the random distribution (Fig. 5A). This trend is more apparent from Fig. 5B, where we show the ratio of P (θ) from Fig. 5A to the P0(θ) = sin θ factor. With that, we remove from the P (θ) distributions the degeneracy related to the number of accessible orientational states. More importantly, the probabilities in Fig. 5B are useful for a quantitative description of the free energy associated with tilting cholesterol molecule away from the membrane normal in various DMPC/Chol mixtures.
Specifically, we now define a “potential of mean force” (PMF):
| (10) |
Shown in Fig. 5C, this PMF provides a measure of the free energy change associated with cholesterol tilt under different conditions, i.e. ΔP M F (θ1 − θ2) = P M F (θ1) − P M F (θ2) can be interpreted as the change in free energy due to tilting Chol molecule from an angle θ1 to an angle θ2. Note that this free energy will generally contain energetic contributions as well as entropic contributions that are not associated with orientational degeneracy. As expected, Fig. 5C illustrates that for a fully random distribution of sterols found at equilibrium, the transition between different states is associated with no free energy cost (PMF=0 for all θ). However, for realistic DMPC/Chol mixtures, as cholesterol density increases, for all θ1 > θ2 we find that PMF(Δ θ) also increases with growing Δθ = θ1 − θ2, indicating a greater penalty associated with rotating the Chol molecule some Δθ angle away from the membrane normal in Chol-rich bilayers.
The PMF we have defined here is closely related to the empirical free energy function used by Kessel et al(19) to describe the transfer of a single cholesterol molecule from the aqueous phase into a lipid bilayer at an angle θ. Calculating the desolvation free energy of Chol as a function of the tilt angle, the authors found that the corresponding difference in free energy G(θ) produced a well-pronounced minimum at an angle θ = 0, allowing for expansion of G(θ) around this point up to quadratic order in θ:
| (11) |
Here χ represents the tilt modulus of cholesterol, a quantitative measure of the force associated with tilting a molecule, and G0 = G(0). Kessel et al noted that the validity of this expansion is generally restricted to the limit of large tilt modulus χ ≫ kBT, where fluctuations of cholesterol orientation are small. Nevertheless, Eq. 11 provides a useful framework to discuss the influence of the different energetic contributions to cholesterol tilt.
Examining the PMF plots in light of the functional relationship given in Eq. 11 reveals that for lower tilt angles the PMFs indeed show a monotonic increase, which can be well approximated by a quadratic functional form. However, these plots clearly deviate from quadratic behavior for higher tilt angles, as they should, since expansion up to terms of θ2 order as in Eq. 11 is valid only for small fluctuations of tilt angle around θ = 0. Thus, a quadratic fit to the PMF plots for low tilt angles should provide a direct measure of the cholesterol tilt modulus, χ, that is responsible for aligning cholesterol in DMPC bilayers. The values of χ from the best fits to the PMF are presented as a function of Chol mole fraction in Figure 8. For each composition, fits were made in the angular range [8°, 20°] (see Methods) where sampling of cholesterol conformations was best, while still limiting the fit to the low angle regime. Error bars in Fig. 8 were calculated from standard deviations obtained from similar fits to [8°, 12°], [12°, 16°], and [16°, 20°] intervals.
Figure 8.

Tilt modulus of cholesterol, χ in DMPC bilayers as a function of sterol composition. For each model membrane, χ was obtained by fitting quadratic function to the PMF plots in Fig. 5C in the angular range of θ ∈ [8°; 20°]. The errorbars represent standard deviations from the similar fits obtained over [8°; 12°], [12°; 16°], and [16°; 20°]
Fig. 8 reveals a strong concentration-dependence of χ. While the cholesterol tilt modulus appears to be constant within numerical error for the 1–10% Chol concentration range, χ exhibits a rapid increase between 10% and 20% Chol, and then remains relatively unchanged upon further cholesterol addition. Larger χ values signify a higher energetic penalty for cholesterol molecules to be inserted in a tilted orientation into a lipid membrane. It is likely that the high and relatively constant tilt modulus in the 20%–40% mixtures is related to the fact that DMPC/Cholesterol membrane thickness reaches saturation levels at 20% Chol (Fig. 3). Thus, significant energy must be spent to add an additional cholesterol with a tilted orientation into these mixtures. For low Chol concentrations, on the other hand, DMPC/Chol bilayers are relatively disordered. Therefore, insertion of a tilted cholesterol molecule can be less costly energetically, as cholesterol molecules are largely non-interacting. As a result, the cholesterol tilt modulus is relatively low. Interestingly, χ varies significantly (by ~4kB T/rad2) between 10% and 20% Chol mixtures. Such a sudden increase in the tilt modulus can be attributed to the appearance of the Chol-rich liquid-order state when the system transitions from 10% to 20% Chol. Taken together, our results suggest that change in cholesterol tilt modulus upon increasing Chol concentration is closely related to the state of fluidity of lipid-cholesterol membranes.
Relation to function of transmembrane domains, the example of G-protein-coupled receptors (GPCRs) and antimicrobial peptides
Cholesterol tilt may affect not only the organization of the lipid matrix, but can also regulate the function and stability of transmembrane (TM) domains, such as GPCRs, or TM peptides. Recent microsecond-scale MD simulation of the prototypical GPCR, rhodopsin, in cholesterol-containing membrane environment(73) found cholesterols around the GPCR in a tilted conformation. Furthermore, dynamics in Chol tilt were linked to critical activation elements in GPCR(73), such as local helical distortions and kinks, ultimately leading to more global transmembrane helix movements. A recent experimental study of the nanoscale organization of the β2-adrenergic GPCR and its signaling partners(74), on the other hand, revealed that in the basal state GPCRs were homogeneously distributed between ordered lipid rafts and disordered non-raft membrane compartments, whereas partner G-proteins were found predominantly in ordered rafts. Upon Chol depletion, rafts were disrupted, leading to the release of a sequestered pool of G-proteins(74), which then became available to interact with the partner GPCR to trigger signaling cascade.
From this study, it appears that GPCR activation proceeds in membrane regions low in cholesterol content, where our study finds a higher probability for Chol tilt. It is reasonable to suspect, therefore, that the tilting of cholesterol around GPCR may be a crucial component in proper receptor functioning.
Cholesterol has been thought to have as well a mechanistic effect on the dynamics of antimicrobial TM peptides, such as pardaxin. NMR studies of membrane disruption by pardaxin(75) suggested that increased Chol concentration reduces the peptide’s orientational freedom in the membrane and alters its preferred orientation. The authors hypothesized that pardaxin in Chol-rich systems is oriented along the membrane normal and thus its channel-forming activity is suppressed in high cholesterol concentrational mixtures. Our findings suggest that the orientational freedom of TM peptides in Chol-enriched membrane domains could be strongly influenced by the aligning field induced by cholesterols, which would enforce an orientational preference for pardaxin along the membrane normal. Alternatively, a higher concentration of cholesterol could altogether prevent the membrane insertion of the peptide(75). Work towards establishing the role of cholesterol in membrane targeting by antimicrobial peptides is ongoing.
Concluding Remarks
To investigate the effect of cholesterol concentration on sterol orientation in phospholipid membranes, we have performed MD simulations on hydrated DMPC/Cholesterol bilayers of various Chol compositions. In so doing, our aim was to relate cholesterol tilt to overall organization in phospholipid-Chol bilayers. We analyzed the cholesterol orientation at various cholesterol contents using, to our knowledge, the first estimates of cholesterol tilt modulus χ in lipid membranes from MD simulations. Beyond providing valuable insights about energetics of cholesterol orientation in phopholipid bilayers, this empirical parameter should become a useful quantitative measure when developing more coarse-grained force fields to describe cholesterol interaction with lipid bilayers. On a practical note, we believe that the procedure used here to obtain χ from MD simulations can be routinely applied to estimate the tilt modulus of any rigid molecule inserted into lipid membranes.
We have verified the quality of the presented MD simulations by obtaining a remarkable fit between experimental and model form factors for all studied mixtures (Fig. 2), as well as between other important structural data derived from simulations and experiments (Figs. 3–4).
A detailed analysis of cholesterol tilt angle distributions in DMPC membranes revealed many instances when Chol molecules transiently oriented perpendicular to the bilayer normal. We showed that as Chol concentration increases, change in average cholesterol orientation strongly (anti)correlates with the concomitant increase in membrane thickness. Thus, we concluded that the sterol tilt may be an important factor capable of inducing membrane ordering. These results are in agreement with MD studies by Aittoniemi et al(22) who found similar correlations between the instantaneous tilt angle of a sterol and average molecular order parameter of neighboring lipid chains in 20% DPPC-Chol and DOPC-Chol mixtures. Our simulations show that correlation between cholesterol tilt and membrane ordering persisted over the entire 1%–40% cholesterol concentration range that we have studied.
With that we proposed a possible mechanism of cholesterol alignment upon increasing concentration that may be responsible for the overall order in DMPC-Chol membranes. We have, therefore, established a link between cholesterol orientation and the well-known lipid condensing effect. Specifically, at low sterol concentrations (1–5% Chol), cholesterol is tilted mainly because of the entropic tendency to assume the maximum number of accessible states. As the sterol content increases, the cholesterol probability density distributions become narrower and appear to develop a well-defined maximum at lower tilt angles, indicating alignment of cholesterol molecules along the bilayer normal. This behavior is analogous to the isotropic-nematic transition observed in liquid crystals, and can be the result of the interplay between entropic contributions that tends to orient cholesterol molecules randomly, as well as unfavorable cholesterol-cholesterol pairwise interactions.
We note that the observed rapid change in χ between 10%–20% can be explained by the appearance of the liquid-ordered state. In this Chol-rich fluidity state, phopholipid-cholesterol bilayers become ordered, Chol molecules align, and the membrane increases in thickness. Thus, in crowded cholesterol environments such as the liquid-ordered state, there is substantial loss in the orientational entropy of Chol molecules that is sacrificed to maintain a larger degree of translational entropy, as well as more favorable chol-lipid energetic interactions. Therefore, adding additional tilted Chol molecules into these bilayers will be accompanied by a high free-energy penalty. As a result, the tilt modulus increases.
To conclude, our analysis suggests that change in cholesterol tilt modulus upon increasing Chol concentration is closely related to the state of fluidity of lipid-cholesterol membranes. It will be interesting to link these findings to changes in membrane material properties and to the way that lipids affect the proteins that are embedded within them, and work along these lines is ongoing.
Acknowledgments
GK is supported by grants from the National Institutes of Health P01 DA012408 and P01 DA012923. DH acknowledges the supported from the Israeli Science Foundation (ISF, grant Nos. 1011/07 and 1012/07). The Fritz Haber research center is supported by the Minerva Foundation, Munich, Germany. Computational resources of the David A. Cofrin Center for Biomedical Information in the HRH Prince Alwaleed Bin Talal Bin Abdulaziz Alsaud Institute for Computational Biomedicine, are gratefully acknowledged.
References
- 1.Yeagle PL. Cholesterol in Membrane Models. CRC Press; Boca Raton, FL: 1993. The biophysics and cell biology of cholesterol: an hypothesis for the essential role of cholesterol in mammalian cells; pp. 1–12. [Google Scholar]
- 2.Liscum L, Underwood KW. J Biol Chem. 1995;270:15443. doi: 10.1074/jbc.270.26.15443. [DOI] [PubMed] [Google Scholar]
- 3.Liscum L, Munn NJ. Biocim Biophys Acta. 1999;1438:19. doi: 10.1016/s1388-1981(99)00043-8. [DOI] [PubMed] [Google Scholar]
- 4.Simons K, Ikonen E. Science. 2000;290:1721. doi: 10.1126/science.290.5497.1721. [DOI] [PubMed] [Google Scholar]
- 5.Mouritsen OG, Zuckermann MJ. Lipids. 2004;39:1101. doi: 10.1007/s11745-004-1336-x. [DOI] [PubMed] [Google Scholar]
- 6.Rukmini R, Rawat SS, Biswas SC, Chattopadhyay A. Biophys J. 2001;81:2122. doi: 10.1016/S0006-3495(01)75860-2. [DOI] [PMC free article] [PubMed] [Google Scholar]
- 7.Schroeder F, Woodford JK, Kavecansky J, Wood WG, Joiner C. Mol Membr Biol. 1995;21:113. doi: 10.3109/09687689509038505. [DOI] [PubMed] [Google Scholar]
- 8.Schroeder F, Frolov AA, Murphy EJ, Atshaves BP, Jefferson JR, Pu L, Wood WG, Foxworth WB, Kier AB. Proc Soc Exp Biol Med. 1996;213:150. doi: 10.3181/00379727-213-44047. [DOI] [PubMed] [Google Scholar]
- 9.Simons K, Ikonen E. Nature. 1997;387:569. doi: 10.1038/42408. [DOI] [PubMed] [Google Scholar]
- 10.Xu X, London E. Biochemistry. 2000;39:843. doi: 10.1021/bi992543v. [DOI] [PubMed] [Google Scholar]
- 11.Schroeder F, Nemecz G, Wood WG, Joiner C, Morrot G, Ayraut-Jarrier M, Devaux PF. Biochim Biophys Acta. 1991;1066:181. doi: 10.1016/0005-2736(91)90185-b. [DOI] [PubMed] [Google Scholar]
- 12.Epand RM. Prog Lip Res. 2006;45:279. doi: 10.1016/j.plipres.2006.02.001. [DOI] [PubMed] [Google Scholar]
- 13.Bloom M, Evans E, Mouritsen OG. Q Rev Biophys. 1991;24:293. doi: 10.1017/s0033583500003735. [DOI] [PubMed] [Google Scholar]
- 14.Weihs D, Schmidt J, Goldiner I, Danino D, Rubin M, Talmon Y, Konikoff FM. J Lip Res. 2005;46:942. doi: 10.1194/jlr.M400458-JLR200. [DOI] [PubMed] [Google Scholar]
- 15.Troup GM, Xie Y, Boesze-Battaglia K, Huang Y, Kirk T, Hanley F, Tulenko TN. Macromolecular Symposia. 2004;219:25. [Google Scholar]
- 16.Harroun TA, Katsaras J, Wassall SR. Biochemistry. 2006;45:1227. doi: 10.1021/bi0520840. [DOI] [PubMed] [Google Scholar]
- 17.Léonard A, Esrive C, Laguerre M, Pebay-Peyroula E, Néri W, Pott T, Katsaras J, Dufour EJ. Langmuir. 2001;17:2019. [Google Scholar]
- 18.Marsan MP, Muller I, Ramos C, Rodriguez F, Dufourc EJ, Czaplicki J, Milon A. Biophys J. 1999;76:351. doi: 10.1016/S0006-3495(99)77202-4. [DOI] [PMC free article] [PubMed] [Google Scholar]
- 19.Kessel A, Ben-Tal N, May S. Biophys J. 2001;81:643. doi: 10.1016/S0006-3495(01)75729-3. [DOI] [PMC free article] [PubMed] [Google Scholar]
- 20.Pasenkiewicz-Gierula M, Róg T, Kitamura K, Kusumi A. Biophys J. 2000;78:1376. doi: 10.1016/S0006-3495(00)76691-4. [DOI] [PMC free article] [PubMed] [Google Scholar]
- 21.Róg T, Pasenkiewicz-Gierula M, Vattulainen I, Karttunen M. Biochim Biophys Acta. 2008 doi: 10.1016/j.bbamem.2008.08.022. [DOI] [PubMed] [Google Scholar]
- 22.Aittoniemi J, Róg T, Pasenkiewicz-Gierula M, Karttunen M, Vattulainen I. J Phys Chem B. 2006;110:25562. doi: 10.1021/jp064931u. [DOI] [PubMed] [Google Scholar]
- 23.Smondyrev AM, Berkowitz ML. Biophys J. 2001;80:1649. doi: 10.1016/S0006-3495(01)76137-1. [DOI] [PMC free article] [PubMed] [Google Scholar]
- 24.Czub J, Baginski M. Biophys J. 2006;90:2368. doi: 10.1529/biophysj.105.072801. [DOI] [PMC free article] [PubMed] [Google Scholar]
- 25.Pandit SA, Bostick D, Berkowitz ML. Biophys J. 2004;86:1345. doi: 10.1016/S0006-3495(04)74206-X. [DOI] [PMC free article] [PubMed] [Google Scholar]
- 26.Kučerka N, Perlmutter JD, Pan J, Tristram-Nagle S, Katsaras J, Sachs JN. Biophys J. 2008;95:2792. doi: 10.1529/biophysj.107.122465. [DOI] [PMC free article] [PubMed] [Google Scholar]
- 27.Almeida PFF, Vaz WLC, Thompson TE. Biochemistry. 1992;31:6739. doi: 10.1021/bi00144a013. [DOI] [PubMed] [Google Scholar]
- 28.Greenwood AI, Tristam-Nagle S, Nagle JF. Chem Phys Lip. 2006;143:1. doi: 10.1016/j.chemphyslip.2006.04.002. [DOI] [PMC free article] [PubMed] [Google Scholar]
- 29.Hung WC, Lee MT, Chen FY, Huang HW. Biophys J. 2007;92:3960. doi: 10.1529/biophysj.106.099234. [DOI] [PMC free article] [PubMed] [Google Scholar]
- 30.de Gennes PG, Prost J. The physics of liquid crystals. Clarendon Press; Oxford: 1993. [Google Scholar]
- 31.Kramer D, Ben-Shaul A, Chen ZY, Gelbart WM. J Chem Phys. 1992;96:2236. [Google Scholar]
- 32.Hodzic A, Rappolt M, Amenitsch H, Laggner P, Pabst G. Biophys J. 2008;94:3935. doi: 10.1529/biophysj.107.123224. [DOI] [PMC free article] [PubMed] [Google Scholar]
- 33.Pan J, Mills TT, Tristam-Nagle S, Nagle JF. Phys Rev Lett. 2008;100:198103. doi: 10.1103/PhysRevLett.100.198103. [DOI] [PMC free article] [PubMed] [Google Scholar]
- 34.Tulenko TN, Chen M, Mason PE, Mason RP. J Lipid Res. 1998;39:947. [PubMed] [Google Scholar]
- 35.Chiu SW, Pandit SA, Scott HL, Jakobsson E. J Phys Chem B. 2009;113:2748. doi: 10.1021/jp807056c. [DOI] [PubMed] [Google Scholar]
- 36.Berendsen H, van der Spoel D, vad Drunen R. Comput Phys Commun. 1995;91:43. [Google Scholar]
- 37.Lindahl E, Hess B, van der Spoel D. J Mol Model. 2001;7:306. [Google Scholar]
- 38.Hess B, Bekker H, Berendsen HJC, Fraaige JGEM. J Comput Chem. 1997;18:1463. [Google Scholar]
- 39.Essmann U, Perera L, Berkowitz ML, Darden T, Lee H, Pedersen LG. J Chem Phys. 1995;103:8577. [Google Scholar]
- 40.Nose S, Klein ML. Mol Phys. 1983;50:1055. [Google Scholar]
- 41.Parrinello M, Rahman A. J Appl Phys. 1981;52:182. [Google Scholar]
- 42.Evans DJ, Holian BL. J Chem Phys. 1985;83:4069. [Google Scholar]
- 43.Pandit SA, Chiu SW, Jakobsson E, Grama A, Scott HL. Langmuir. 2008;24:6858. doi: 10.1021/la8004135. [DOI] [PMC free article] [PubMed] [Google Scholar]
- 44.Pabst G. Biophys Rev Lett. 2006;1:57. [Google Scholar]
- 45.Pabst G, Rappolt M, Amenitsch H, Laggner P. Phys Rev E. 2000;62:4000. doi: 10.1103/physreve.62.4000. [DOI] [PubMed] [Google Scholar]
- 46.Pabst G, Koschuch B, Pozo-Navas B, Rappolt M, Lohner K, Laggner P. J Appl Crystallogr. 2003;63:1378. [Google Scholar]
- 47.Zhang R, Suter RM, Nagle JF. Phys Rev E. 1994;50:5047. doi: 10.1103/physreve.50.5047. [DOI] [PubMed] [Google Scholar]
- 48.Rappolt M, Vidal MF, Kriechbaum M, Steinhart M, Amentisch H, Bernstorff S, Laggner P. Eur Biophys J. 2003;31:575. doi: 10.1007/s00249-002-0253-z. [DOI] [PubMed] [Google Scholar]
- 49.Gallova J, Uhrikova D, Hanulova J, Teixeria J, Balgavy P. Colloids Surf B Biointerfaces. 2004;38:11. doi: 10.1016/j.colsurfb.2004.07.012. [DOI] [PubMed] [Google Scholar]
- 50.McIntosh TJ. Biochim Biophys Acta. 1978;513:43. doi: 10.1016/0005-2736(78)90110-4. [DOI] [PubMed] [Google Scholar]
- 51.de Meyer F, Smit B. PNAS. 2009;106(10):3654. doi: 10.1073/pnas.0809959106. [DOI] [PMC free article] [PubMed] [Google Scholar]
- 52.Douliez JP, Léonard A, Dufourc EJ. Biophys J. 1995;68:1727. doi: 10.1016/S0006-3495(95)80350-4. [DOI] [PMC free article] [PubMed] [Google Scholar]
- 53.Douliez JP, Léonard A, Dufourc EJ. J Phys Chem. 1996;100:18450. [Google Scholar]
- 54.Urbina JA, Peterar S, Le H-b, Patterson J, Montez B, Oldfield E. Biochim Biophys Acta. 1995;1238:163. doi: 10.1016/0005-2736(95)00117-l. [DOI] [PubMed] [Google Scholar]
- 55.Urbina JA, Moreno B, Arnold W, Taron CH, Orlean P, Oldfield E. Biophys J. 1998;75:1372. doi: 10.1016/S0006-3495(98)74055-X. [DOI] [PMC free article] [PubMed] [Google Scholar]
- 56.Nielsen M, Thewalt J, Miao L, Ipsen JH, Bloom M, Zuckermann MJ, Mouritsen OG. Europhys Lett. 2000;52:368. [Google Scholar]
- 57.Sankaram MB, Thompson TE. Biochemistry. 1990;29:10676. doi: 10.1021/bi00499a015. [DOI] [PubMed] [Google Scholar]
- 58.Róg T, Pasenkiewicz-Gierula M. Biophys Chem. 2004;107:151. doi: 10.1016/j.bpc.2003.09.002. [DOI] [PubMed] [Google Scholar]
- 59.Jedlovsky P, Mezei M. J Phys Chem B. 2003;107:5311. [Google Scholar]
- 60.Róg T, Pasenkiewicz-Gierula M. Biophys J. 2001;81:2190. doi: 10.1016/S0006-3495(01)75867-5. [DOI] [PMC free article] [PubMed] [Google Scholar]
- 61.Pasenkiewicz-Gierula M, Subczynski WK, Kusumi A. Biochemistry. 1990;29:4059. doi: 10.1021/bi00469a006. [DOI] [PubMed] [Google Scholar]
- 62.Murari R, Murari MP, Baumann WJ. Biochemistry. 1986;25:1062. doi: 10.1021/bi00353a017. [DOI] [PubMed] [Google Scholar]
- 63.Khelashvili G, Pandit SA, Scott HL. J Chem Phys. 2005;123:034910. doi: 10.1063/1.1943412. [DOI] [PMC free article] [PubMed] [Google Scholar]
- 64.Subramaniam S, McConnell HM. J Phys Chem. 1987;91:1715. [Google Scholar]
- 65.Gershfeld NL. Biophys J. 1978;22:469. doi: 10.1016/S0006-3495(78)85500-3. [DOI] [PMC free article] [PubMed] [Google Scholar]
- 66.Vroege GJ, Lekkerkerker HNW. Rep Prog Phys. 1992;55:1241. [Google Scholar]
- 67.Almeida PFF, Wiegel FW. J Theor Biol. 2006;238:269. doi: 10.1016/j.jtbi.2005.05.028. [DOI] [PubMed] [Google Scholar]
- 68.Zhang Z, Lu L, Berkowitz ML. J Phys Chem B. 2008;112:3807. doi: 10.1021/jp077735b. [DOI] [PubMed] [Google Scholar]
- 69.Bennett WFD, MacCallum JL, Hinner MJ, Marrink SJ, Tieleman DP. JACS. 2009;131:12714. doi: 10.1021/ja903529f. [DOI] [PubMed] [Google Scholar]
- 70.Kucerka N, Marquardt D, Harroun TA, Nieh MP, Wassall SR, Katsaras J. JACS. 2009;131:16358. doi: 10.1021/ja907659u. [DOI] [PubMed] [Google Scholar]
- 71.Olsen BN, Schlesinger PH, Baker NA. JACS. 2009;131:4854. doi: 10.1021/ja8095224. [DOI] [PMC free article] [PubMed] [Google Scholar]
- 72.Ivankin A, Kuzmenko I, Gidalevitz D. PRL. 2010;104:108101. doi: 10.1103/PhysRevLett.104.108101. [DOI] [PMC free article] [PubMed] [Google Scholar]
- 73.Khelashvili G, Grossfield A, Feller SE, Pitman MC, Weinstein H. Proteins: Structure, function and Bioinformatics. 2009;76:403. doi: 10.1002/prot.22355. [DOI] [PMC free article] [PubMed] [Google Scholar]
- 74.Pontier SM, Percherancier Y, Galandrin S, Breit A, Gales C, Bouvier M. JBC. 2008;283:24659. doi: 10.1074/jbc.M800778200. [DOI] [PMC free article] [PubMed] [Google Scholar]
- 75.Ramomoorthy A, Lee D-K, Narasimhaswamy T, Nanga RPR. BBA. 2009 doi: 10.1016/j.bbamem.2009.08.012. [DOI] [Google Scholar]