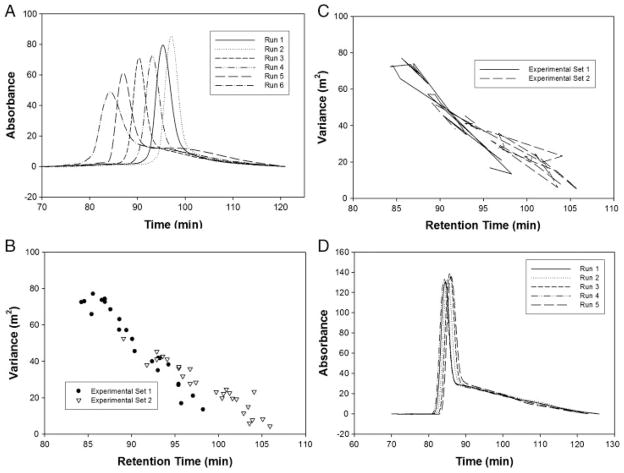
Figure 6.
(A) Elution profiles performed under no electric field conditions illustrating run-to-run variation. The changes in peak retention time and peak shape are caused by changes in the volume of the packed separation channel. (B) The trend for variance plotted against retention time. As the variance increases, the retention time decreases. (C) This plot shows the same data as in (B) except that the data points have been connected to illustrate that the trend does not proceed in a chronological fashion. (D) Elution profiles performed under no electric field conditions illustrating the decrease in run-to-run variation provided by the insertion of a ceramic support behind the flexible dialysis membrane. The peak tails can be attributed to adsorption of the protein onto the surface of the stationary phase and the interaction with stagnant flow regions within the packed bead.

